
|
|||||
|
 | |
| |
| |
| |
| |
| |
|
Gene: RASL11A |
Gene summary for RASL11A |
| Gene information | Species | Human | Gene symbol | RASL11A | Gene ID | 387496 |
| Gene name | RAS like family 11 member A | |
| Gene Alias | RASL11A | |
| Cytomap | 13q12.2 | |
| Gene Type | protein-coding | GO ID | GO:0006139 | UniProtAcc | Q6T310 |
Top |
Malignant transformation analysis |
| Identification of the aberrant gene expression in precancerous and cancerous lesions by comparing the gene expression of stem-like cells in diseased tissues with normal stem cells |
| Entrez ID | Symbol | Replicates | Species | Organ | Tissue | Adj P-value | Log2FC | Malignancy |
| 387496 | RASL11A | LZE8T | Human | Esophagus | ESCC | 4.02e-05 | 1.66e-01 | 0.067 |
| 387496 | RASL11A | P1T-E | Human | Esophagus | ESCC | 1.64e-05 | 4.55e-01 | 0.0875 |
| 387496 | RASL11A | P2T-E | Human | Esophagus | ESCC | 3.06e-02 | 9.46e-02 | 0.1177 |
| 387496 | RASL11A | P4T-E | Human | Esophagus | ESCC | 1.75e-05 | 1.85e-01 | 0.1323 |
| 387496 | RASL11A | P8T-E | Human | Esophagus | ESCC | 3.29e-20 | 4.42e-01 | 0.0889 |
| 387496 | RASL11A | P9T-E | Human | Esophagus | ESCC | 5.41e-23 | 7.80e-01 | 0.1131 |
| 387496 | RASL11A | P10T-E | Human | Esophagus | ESCC | 2.40e-07 | 1.20e-01 | 0.116 |
| 387496 | RASL11A | P11T-E | Human | Esophagus | ESCC | 1.72e-04 | 2.28e-01 | 0.1426 |
| 387496 | RASL11A | P12T-E | Human | Esophagus | ESCC | 1.21e-08 | 2.79e-01 | 0.1122 |
| 387496 | RASL11A | P15T-E | Human | Esophagus | ESCC | 8.38e-13 | 3.02e-01 | 0.1149 |
| 387496 | RASL11A | P16T-E | Human | Esophagus | ESCC | 1.08e-03 | 7.23e-02 | 0.1153 |
| 387496 | RASL11A | P17T-E | Human | Esophagus | ESCC | 8.50e-05 | 2.30e-01 | 0.1278 |
| 387496 | RASL11A | P20T-E | Human | Esophagus | ESCC | 1.51e-02 | 1.29e-01 | 0.1124 |
| 387496 | RASL11A | P21T-E | Human | Esophagus | ESCC | 1.04e-08 | 7.69e-02 | 0.1617 |
| 387496 | RASL11A | P23T-E | Human | Esophagus | ESCC | 5.52e-07 | 2.32e-01 | 0.108 |
| 387496 | RASL11A | P26T-E | Human | Esophagus | ESCC | 9.86e-22 | 6.79e-01 | 0.1276 |
| 387496 | RASL11A | P27T-E | Human | Esophagus | ESCC | 2.30e-12 | 4.08e-01 | 0.1055 |
| 387496 | RASL11A | P28T-E | Human | Esophagus | ESCC | 1.38e-19 | 5.44e-01 | 0.1149 |
| 387496 | RASL11A | P30T-E | Human | Esophagus | ESCC | 5.30e-14 | 4.92e-01 | 0.137 |
| 387496 | RASL11A | P32T-E | Human | Esophagus | ESCC | 3.37e-02 | 5.92e-02 | 0.1666 |
| Page: 1 2 3 |
| Tissue | Expression Dynamics | Abbreviation |
| Esophagus | 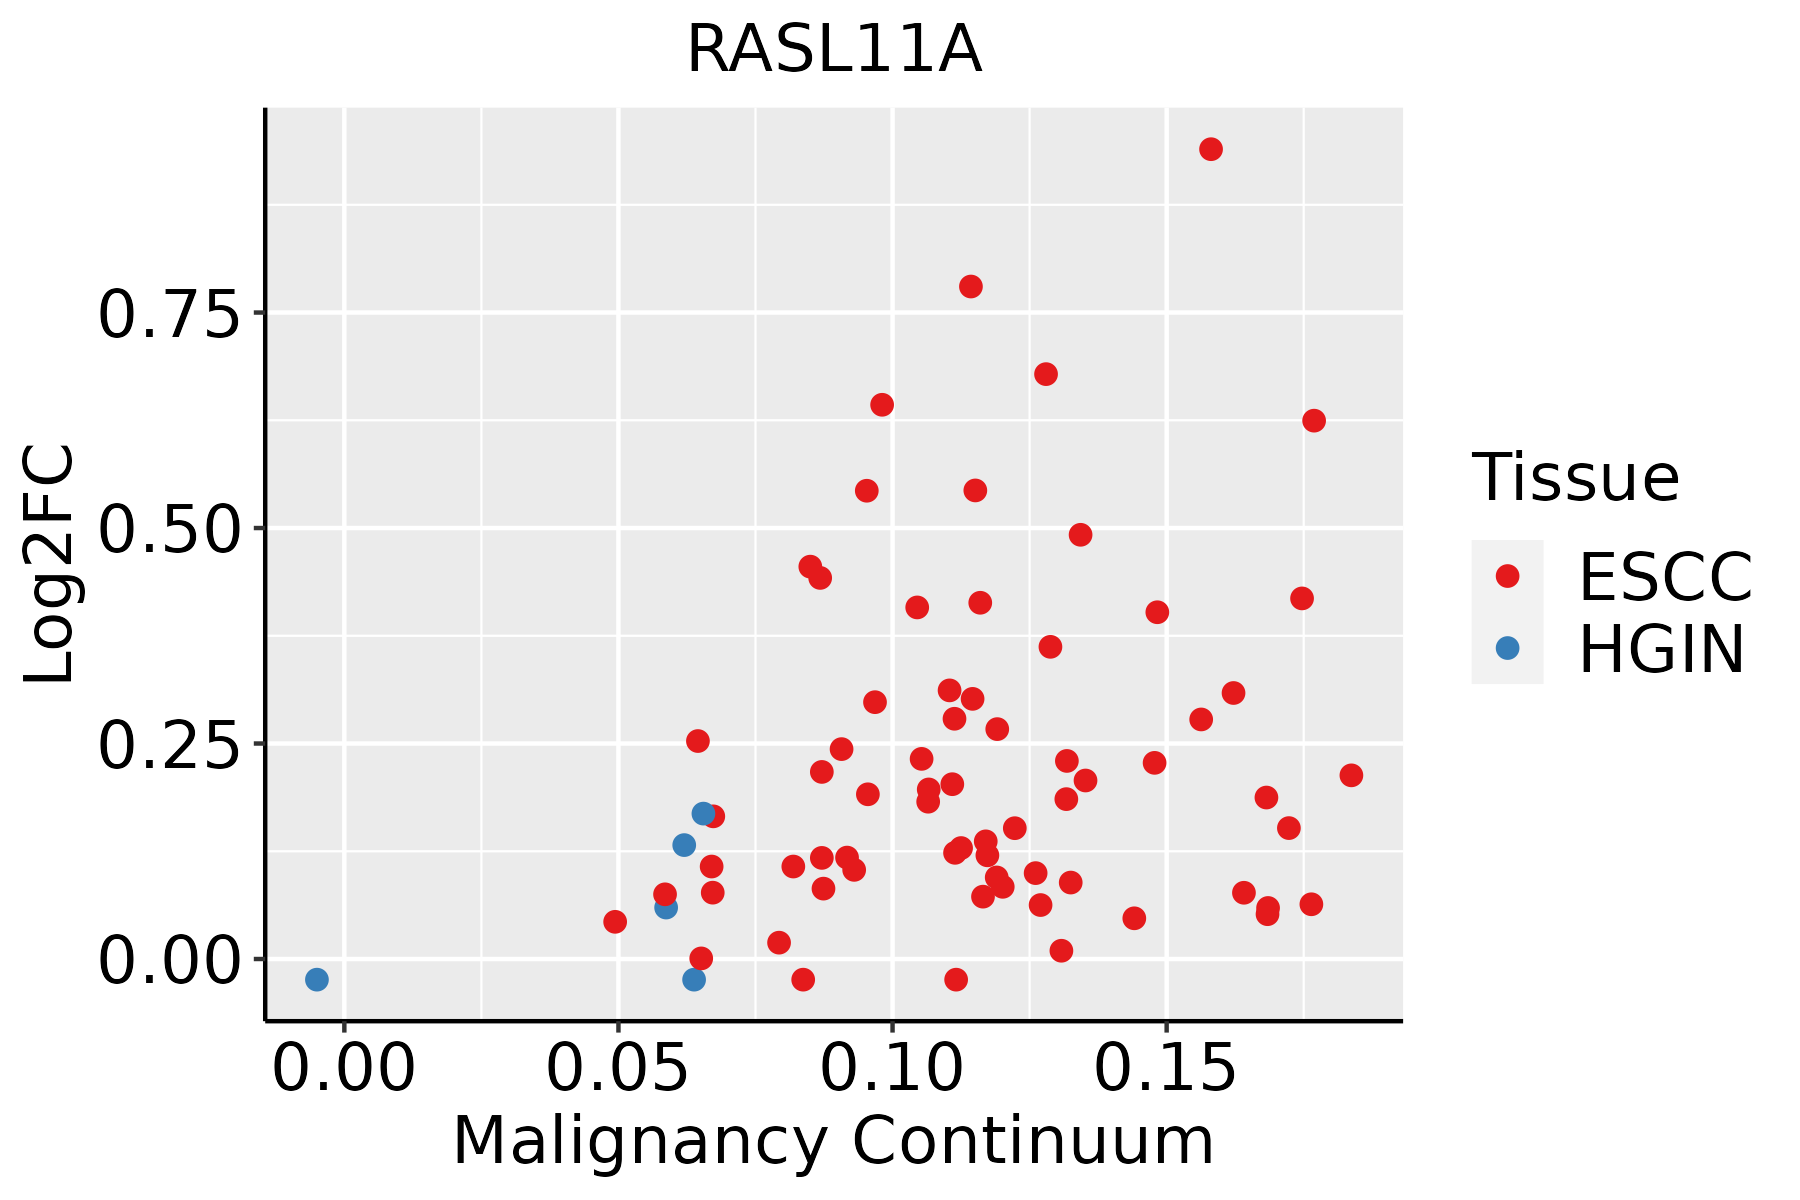 | ESCC: Esophageal squamous cell carcinoma |
| HGIN: High-grade intraepithelial neoplasias | ||
| LGIN: Low-grade intraepithelial neoplasias | ||
| Oral Cavity | 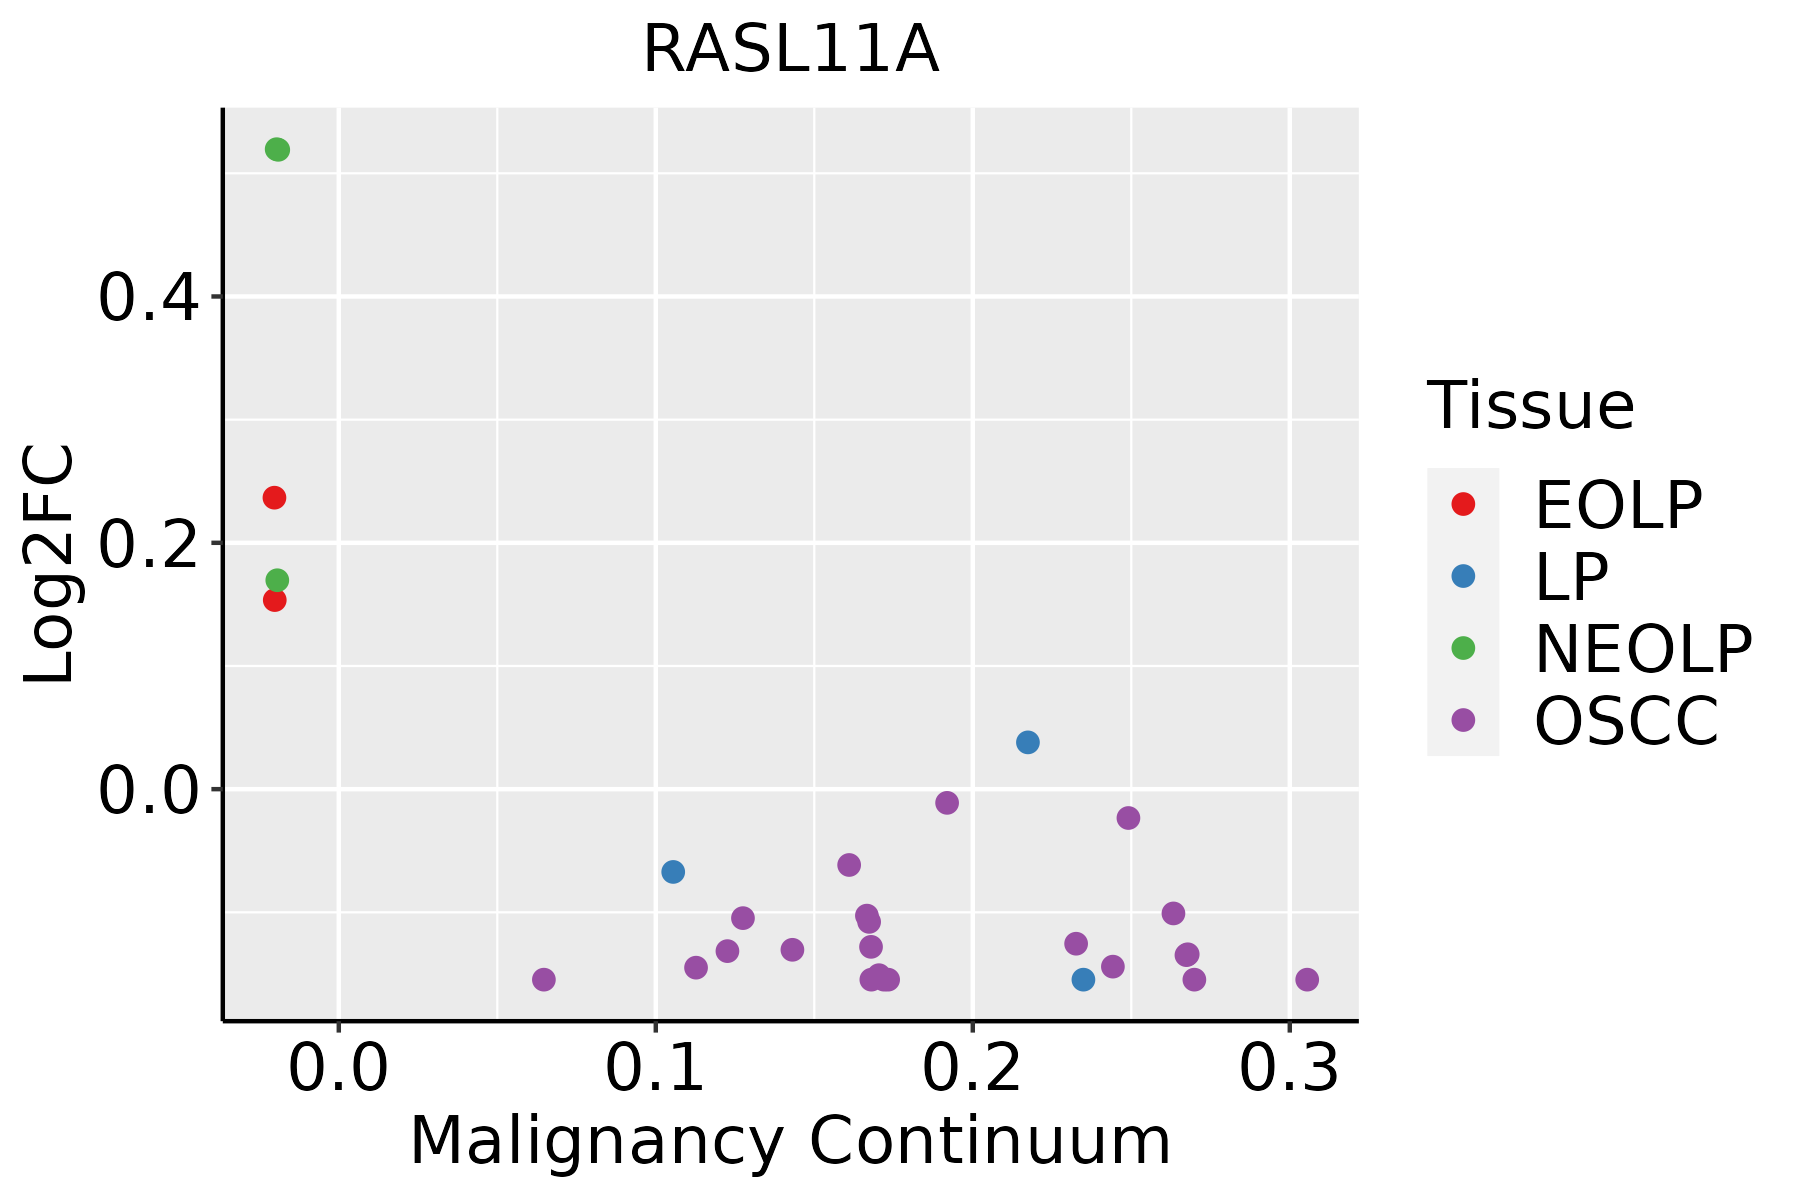 | EOLP: Erosive Oral lichen planus |
| LP: leukoplakia | ||
| NEOLP: Non-erosive oral lichen planus | ||
| OSCC: Oral squamous cell carcinoma |
| ∗log2FC in expression of this searched gene in stem-like cells from each diseased tissue sample relative to stem-like cells in normal samples in each tissue plotted against the malignancy continuum. Samples are colored based on if they are from different disease stage. |
Top |
Malignant transformation related pathway analysis |
| Find out the enriched GO biological processes and KEGG pathways involved in transition from healthy to precancer to cancer |
| Tissue | Disease Stage | Enriched GO biological Processes |
| Colorectum | AD |  |
| Colorectum | SER |  |
| Colorectum | MSS |  |
| Colorectum | MSI-H |  |
| Colorectum | FAP |  |
| ∗Top 15 enriched GO BP terms are showed in the bar plot of each disease state in each tissue. Each row represents a significant GO biological process which is colored according to the -log10(p.adjust). |
| Page: 1 2 3 4 5 6 7 8 9 |
| GO ID | Tissue | Disease Stage | Description | Gene Ratio | Bg Ratio | pvalue | p.adjust | Count |
| GO:00063602 | Esophagus | ESCC | transcription by RNA polymerase I | 42/8552 | 55/18723 | 3.41e-06 | 3.78e-05 | 42 |
| GO:00063564 | Esophagus | ESCC | regulation of transcription by RNA polymerase I | 27/8552 | 34/18723 | 6.01e-05 | 4.62e-04 | 27 |
| GO:00459432 | Esophagus | ESCC | positive regulation of transcription by RNA polymerase I | 19/8552 | 23/18723 | 3.12e-04 | 1.85e-03 | 19 |
| GO:00063563 | Oral cavity | OSCC | regulation of transcription by RNA polymerase I | 25/7305 | 34/18723 | 4.63e-05 | 3.90e-04 | 25 |
| GO:00063601 | Oral cavity | OSCC | transcription by RNA polymerase I | 36/7305 | 55/18723 | 6.42e-05 | 5.22e-04 | 36 |
| GO:00459431 | Oral cavity | OSCC | positive regulation of transcription by RNA polymerase I | 18/7305 | 23/18723 | 1.47e-04 | 1.04e-03 | 18 |
| Page: 1 |
| Pathway ID | Tissue | Disease Stage | Description | Gene Ratio | Bg Ratio | pvalue | p.adjust | qvalue | Count |
| Page: 1 |
Top |
Cell-cell communication analysis |
| Identification of potential cell-cell interactions between two cell types and their ligand-receptor pairs for different disease states |
| Ligand | Receptor | LRpair | Pathway | Tissue | Disease Stage |
| Page: 1 |
Top |
Single-cell gene regulatory network inference analysis |
| Find out the significant the regulons (TFs) and the target genes of each regulon across cell types for different disease states |
| TF | Cell Type | Tissue | Disease Stage | Target Gene | RSS | Regulon Activity |
| ∗The dot plots of a searched regulon are shown for all cell subpopulations in each disease state of each tissue based on the regulon specific score inferred using pySCENIC and by calculating the average expression. |
| Page: 1 |
Top |
Somatic mutation of malignant transformation related genes |
| Annotation of somatic variants for genes involved in malignant transformation |
| Hugo Symbol | Variant Class | Variant Classification | dbSNP RS | HGVSc | HGVSp | HGVSp Short | SWISSPROT | BIOTYPE | SIFT | PolyPhen | Tumor Sample Barcode | Tissue | Histology | Sex | Age | Stage | Therapy Types | Drugs | Outcome |
| RASL11A | SNV | Missense_Mutation | c.570N>C | p.Gln190His | p.Q190H | Q6T310 | protein_coding | tolerated(1) | benign(0.021) | TCGA-AR-A251-01 | Breast | breast invasive carcinoma | Female | <65 | III/IV | Chemotherapy | doxorubicin | SD | |
| RASL11A | SNV | Missense_Mutation | c.211G>A | p.Glu71Lys | p.E71K | Q6T310 | protein_coding | deleterious(0) | possibly_damaging(0.71) | TCGA-A6-6653-01 | Colorectum | colon adenocarcinoma | Male | >=65 | I/II | Unknown | Unknown | SD | |
| RASL11A | SNV | Missense_Mutation | rs372800147 | c.176N>C | p.Asn59Thr | p.N59T | Q6T310 | protein_coding | tolerated(0.49) | probably_damaging(1) | TCGA-AA-3510-01 | Colorectum | colon adenocarcinoma | Male | >=65 | I/II | Unknown | Unknown | SD |
| RASL11A | SNV | Missense_Mutation | c.710C>A | p.Ala237Asp | p.A237D | Q6T310 | protein_coding | deleterious(0) | benign(0.282) | TCGA-AA-A01D-01 | Colorectum | colon adenocarcinoma | Female | <65 | III/IV | Chemotherapy | capecitabine | PD | |
| RASL11A | deletion | Frame_Shift_Del | c.276delN | p.Gln94ArgfsTer72 | p.Q94Rfs*72 | Q6T310 | protein_coding | TCGA-AZ-6598-01 | Colorectum | colon adenocarcinoma | Female | >=65 | I/II | Unknown | Unknown | SD | |||
| RASL11A | insertion | Frame_Shift_Ins | novel | c.613dupG | p.Glu205GlyfsTer56 | p.E205Gfs*56 | Q6T310 | protein_coding | TCGA-NH-A5IV-01 | Colorectum | colon adenocarcinoma | Female | >=65 | I/II | Unknown | Unknown | SD | ||
| RASL11A | SNV | Missense_Mutation | novel | c.656N>T | p.Asn219Ile | p.N219I | Q6T310 | protein_coding | deleterious(0) | probably_damaging(0.999) | TCGA-A5-A0G1-01 | Endometrium | uterine corpus endometrioid carcinoma | Female | >=65 | I/II | Unknown | Unknown | SD |
| RASL11A | SNV | Missense_Mutation | novel | c.433N>A | p.Val145Met | p.V145M | Q6T310 | protein_coding | deleterious(0.04) | possibly_damaging(0.903) | TCGA-A5-A0G2-01 | Endometrium | uterine corpus endometrioid carcinoma | Female | <65 | III/IV | Unknown | Unknown | SD |
| RASL11A | SNV | Missense_Mutation | rs200613411 | c.547G>A | p.Glu183Lys | p.E183K | Q6T310 | protein_coding | tolerated(0.24) | benign(0.164) | TCGA-A5-A2K5-01 | Endometrium | uterine corpus endometrioid carcinoma | Female | >=65 | I/II | Unknown | Unknown | SD |
| RASL11A | SNV | Missense_Mutation | novel | c.506N>C | p.Leu169Pro | p.L169P | Q6T310 | protein_coding | deleterious(0) | probably_damaging(0.999) | TCGA-AJ-A3OK-01 | Endometrium | uterine corpus endometrioid carcinoma | Female | >=65 | I/II | Chemotherapy | carboplatin | CR |
| Page: 1 2 3 4 |
Top |
Related drugs of malignant transformation related genes |
| Identification of chemicals and drugs interact with genes involved in malignant transfromation |
| (DGIdb 4.0) |
| Entrez ID | Symbol | Category | Interaction Types | Drug Claim Name | Drug Name | PMIDs |
| Page: 1 |

Copyright 2023-Present -The University of Texas Health Science Center at Houston |