
|
|||||
|
 | |
| |
| |
| |
| |
| |
|
Gene: RASIP1 |
Gene summary for RASIP1 |
| Gene information | Species | Human | Gene symbol | RASIP1 | Gene ID | 54922 |
| Gene name | Ras interacting protein 1 | |
| Gene Alias | RAIN | |
| Cytomap | 19q13.33 | |
| Gene Type | protein-coding | GO ID | GO:0001525 | UniProtAcc | Q5U651 |
Top |
Malignant transformation analysis |
| Identification of the aberrant gene expression in precancerous and cancerous lesions by comparing the gene expression of stem-like cells in diseased tissues with normal stem cells |
| Entrez ID | Symbol | Replicates | Species | Organ | Tissue | Adj P-value | Log2FC | Malignancy |
| 54922 | RASIP1 | CA_HPV_2 | Human | Cervix | CC | 3.49e-07 | 1.89e-01 | 0.0391 |
| 54922 | RASIP1 | Tumor | Human | Cervix | CC | 4.04e-37 | 5.62e-01 | 0.1241 |
| 54922 | RASIP1 | sample3 | Human | Cervix | CC | 9.28e-41 | 5.35e-01 | 0.1387 |
| 54922 | RASIP1 | T3 | Human | Cervix | CC | 6.77e-41 | 5.18e-01 | 0.1389 |
| 54922 | RASIP1 | P8T-E | Human | Esophagus | ESCC | 1.88e-06 | 1.99e-01 | 0.0889 |
| 54922 | RASIP1 | P20T-E | Human | Esophagus | ESCC | 2.71e-31 | 5.52e-01 | 0.1124 |
| 54922 | RASIP1 | P24T-E | Human | Esophagus | ESCC | 7.90e-03 | 1.03e-01 | 0.1287 |
| 54922 | RASIP1 | P27T-E | Human | Esophagus | ESCC | 1.43e-42 | 7.45e-01 | 0.1055 |
| 54922 | RASIP1 | P36T-E | Human | Esophagus | ESCC | 2.11e-03 | 1.69e-01 | 0.1187 |
| 54922 | RASIP1 | P37T-E | Human | Esophagus | ESCC | 2.04e-14 | 2.93e-01 | 0.1371 |
| 54922 | RASIP1 | P54T-E | Human | Esophagus | ESCC | 1.06e-31 | 5.88e-01 | 0.0975 |
| 54922 | RASIP1 | P127T-E | Human | Esophagus | ESCC | 1.29e-22 | 4.00e-01 | 0.0826 |
| 54922 | RASIP1 | C04 | Human | Oral cavity | OSCC | 3.83e-27 | 1.05e+00 | 0.2633 |
| 54922 | RASIP1 | C30 | Human | Oral cavity | OSCC | 5.46e-51 | 1.93e+00 | 0.3055 |
| 54922 | RASIP1 | C51 | Human | Oral cavity | OSCC | 3.75e-16 | 7.42e-01 | 0.2674 |
| 54922 | RASIP1 | C06 | Human | Oral cavity | OSCC | 6.61e-08 | 1.29e+00 | 0.2699 |
| 54922 | RASIP1 | C86 | Human | Oral cavity | OSCC | 1.06e-02 | 7.07e-01 | 0.161 |
| 54922 | RASIP1 | C09 | Human | Oral cavity | OSCC | 3.78e-10 | 2.90e-01 | 0.1431 |
| 54922 | RASIP1 | LP17 | Human | Oral cavity | LP | 7.16e-06 | 4.55e-01 | 0.2349 |
| 54922 | RASIP1 | P1_cSCC | Human | Skin | cSCC | 1.65e-28 | 7.50e-01 | 0.0292 |
| Page: 1 2 |
| Tissue | Expression Dynamics | Abbreviation |
| Cervix | 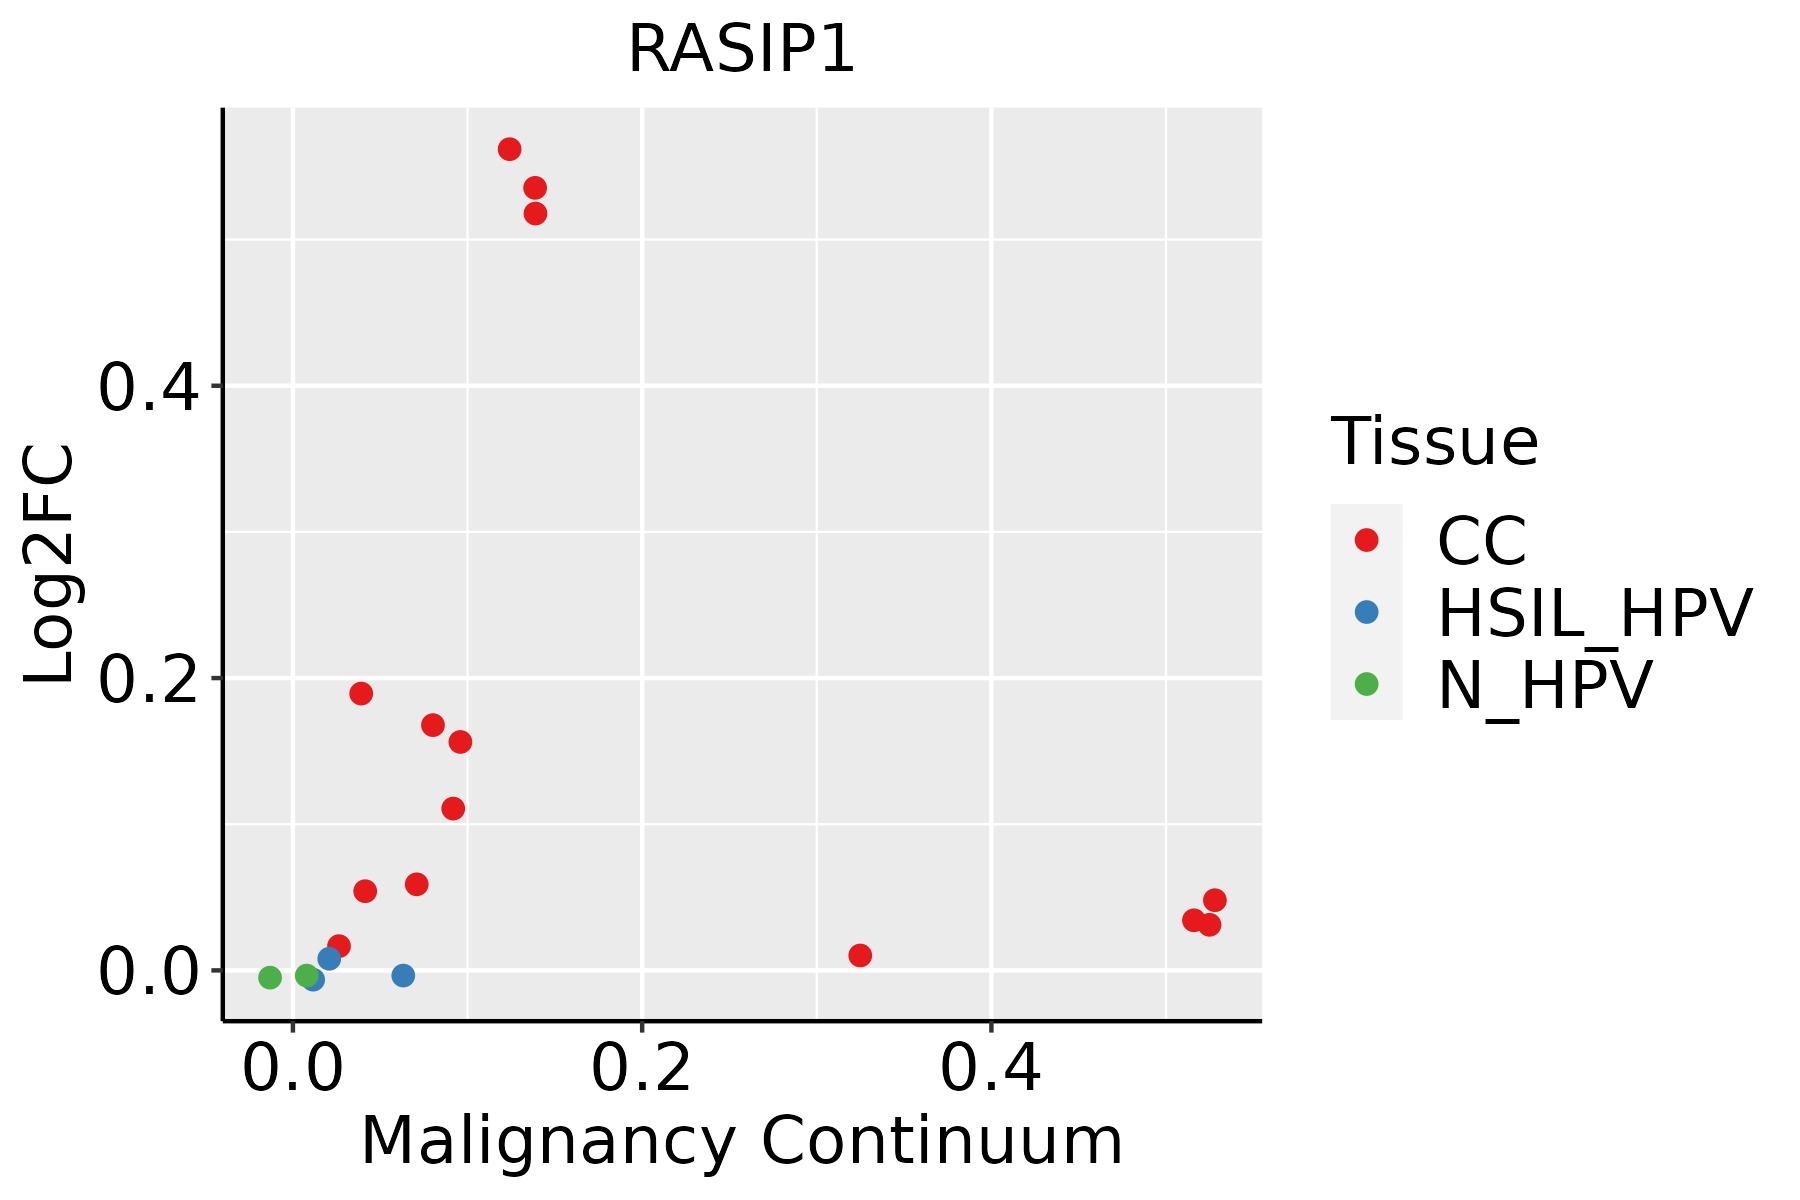 | CC: Cervix cancer |
| HSIL_HPV: HPV-infected high-grade squamous intraepithelial lesions | ||
| N_HPV: HPV-infected normal cervix | ||
| Esophagus |  | ESCC: Esophageal squamous cell carcinoma |
| HGIN: High-grade intraepithelial neoplasias | ||
| LGIN: Low-grade intraepithelial neoplasias | ||
| Oral Cavity | 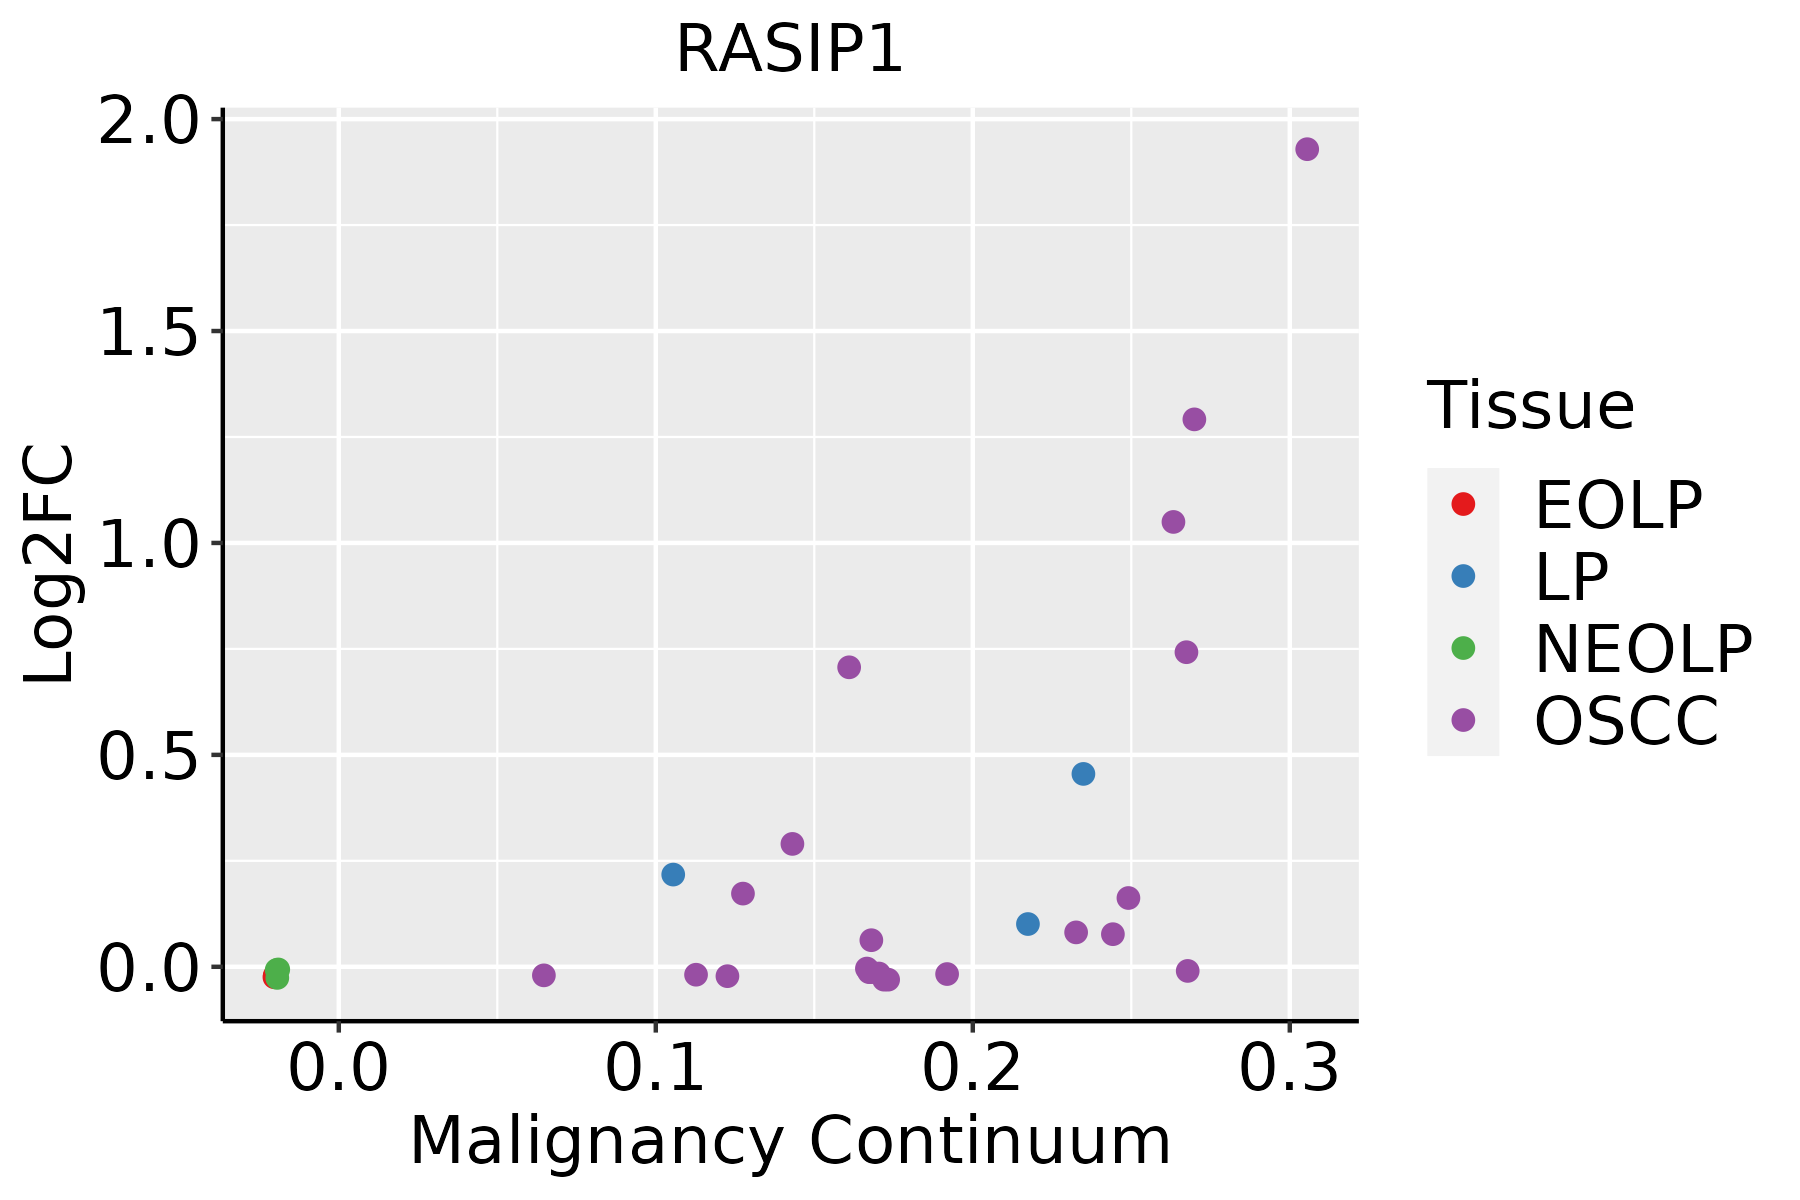 | EOLP: Erosive Oral lichen planus |
| LP: leukoplakia | ||
| NEOLP: Non-erosive oral lichen planus | ||
| OSCC: Oral squamous cell carcinoma | ||
| Skin | 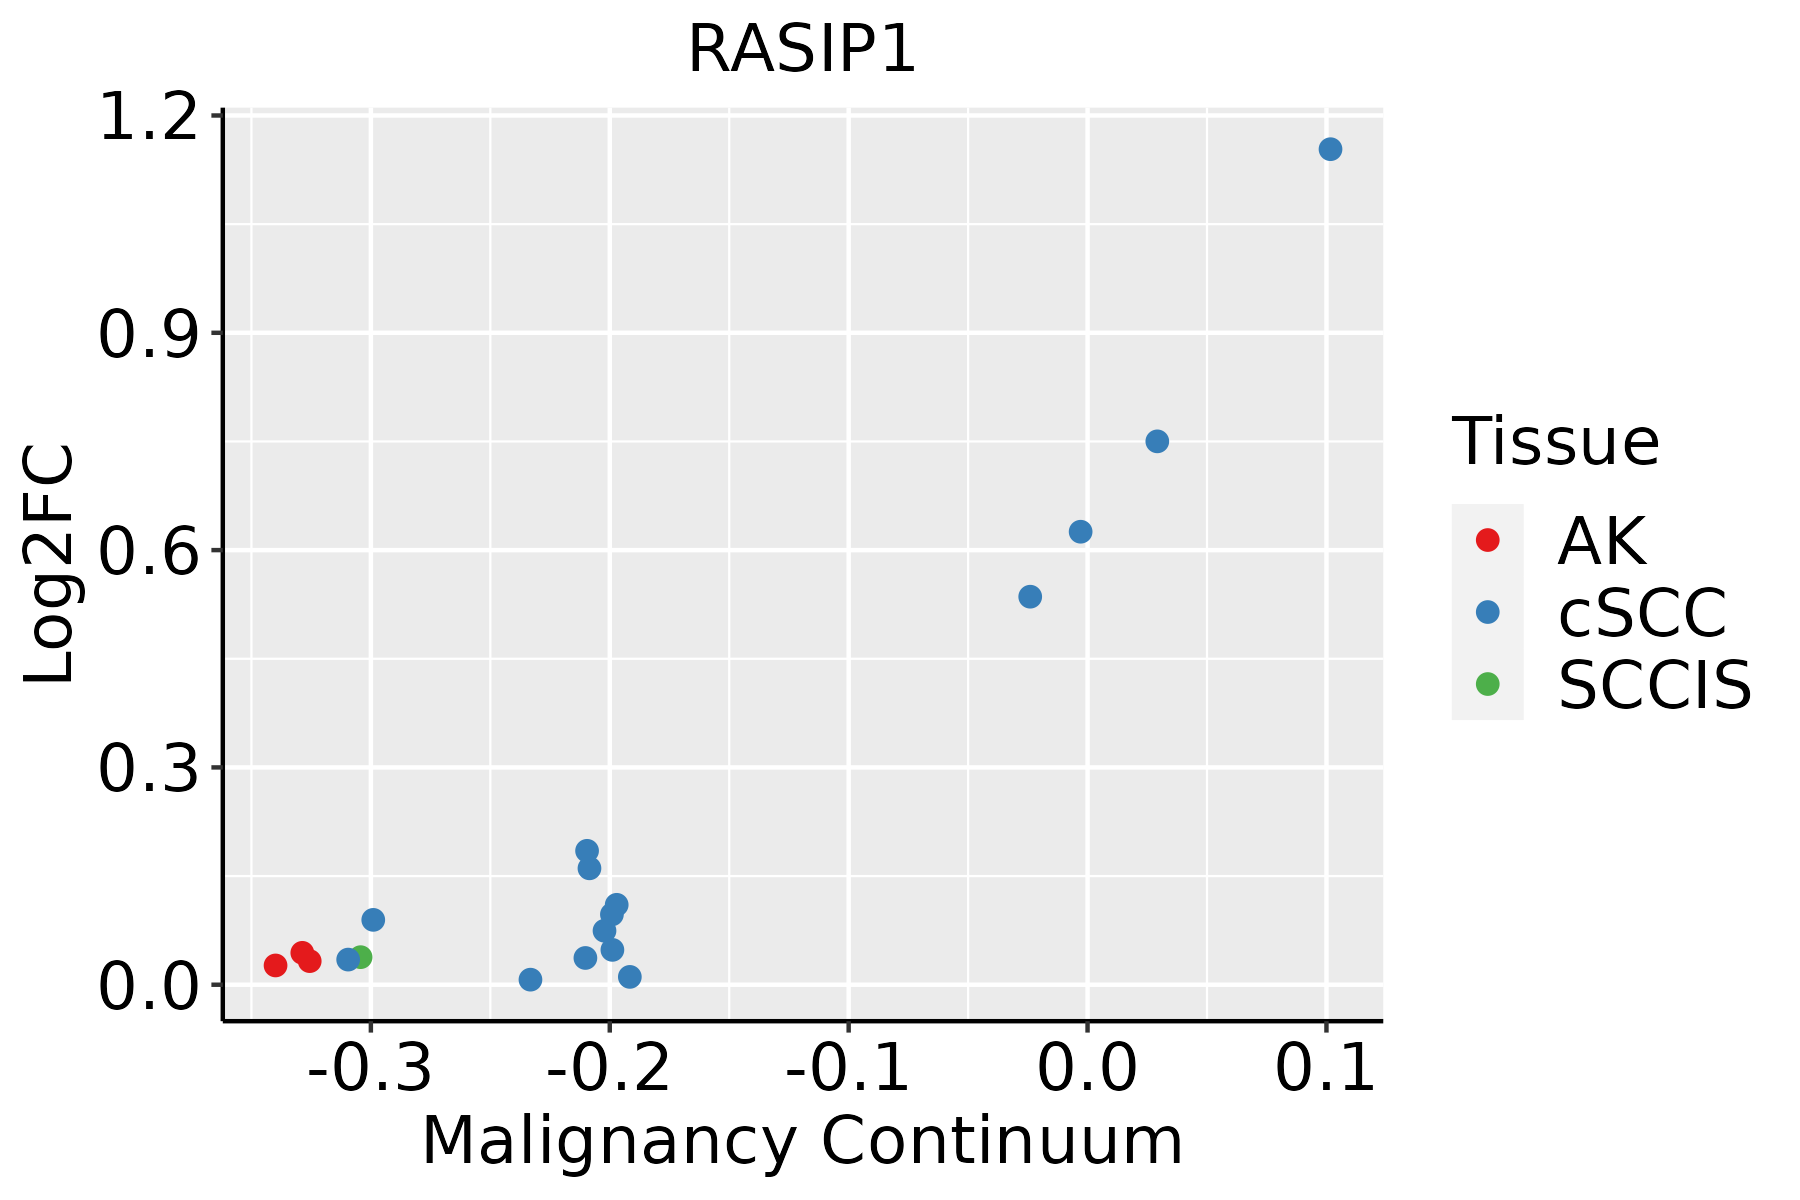 | AK: Actinic keratosis |
| cSCC: Cutaneous squamous cell carcinoma | ||
| SCCIS:squamous cell carcinoma in situ |
| ∗log2FC in expression of this searched gene in stem-like cells from each diseased tissue sample relative to stem-like cells in normal samples in each tissue plotted against the malignancy continuum. Samples are colored based on if they are from different disease stage. |
Top |
Malignant transformation related pathway analysis |
| Find out the enriched GO biological processes and KEGG pathways involved in transition from healthy to precancer to cancer |
| Tissue | Disease Stage | Enriched GO biological Processes |
| Colorectum | AD |  |
| Colorectum | SER |  |
| Colorectum | MSS |  |
| Colorectum | MSI-H |  |
| Colorectum | FAP |  |
| ∗Top 15 enriched GO BP terms are showed in the bar plot of each disease state in each tissue. Each row represents a significant GO biological process which is colored according to the -log10(p.adjust). |
| Page: 1 2 3 4 5 6 7 8 9 |
| GO ID | Tissue | Disease Stage | Description | Gene Ratio | Bg Ratio | pvalue | p.adjust | Count |
| GO:00510566 | Cervix | CC | regulation of small GTPase mediated signal transduction | 75/2311 | 302/18723 | 1.54e-09 | 1.74e-07 | 75 |
| GO:004325410 | Cervix | CC | regulation of protein-containing complex assembly | 96/2311 | 428/18723 | 2.91e-09 | 3.05e-07 | 96 |
| GO:00072656 | Cervix | CC | Ras protein signal transduction | 79/2311 | 337/18723 | 9.49e-09 | 7.77e-07 | 79 |
| GO:00430877 | Cervix | CC | regulation of GTPase activity | 79/2311 | 348/18723 | 4.21e-08 | 2.60e-06 | 79 |
| GO:003133010 | Cervix | CC | negative regulation of cellular catabolic process | 63/2311 | 262/18723 | 1.10e-07 | 5.68e-06 | 63 |
| GO:000989510 | Cervix | CC | negative regulation of catabolic process | 69/2311 | 320/18723 | 2.15e-06 | 6.55e-05 | 69 |
| GO:003133410 | Cervix | CC | positive regulation of protein-containing complex assembly | 55/2311 | 237/18723 | 2.25e-06 | 6.73e-05 | 55 |
| GO:00719007 | Cervix | CC | regulation of protein serine/threonine kinase activity | 75/2311 | 359/18723 | 2.76e-06 | 8.02e-05 | 75 |
| GO:005134810 | Cervix | CC | negative regulation of transferase activity | 60/2311 | 268/18723 | 2.77e-06 | 8.02e-05 | 60 |
| GO:004593610 | Cervix | CC | negative regulation of phosphate metabolic process | 88/2311 | 441/18723 | 2.92e-06 | 8.27e-05 | 88 |
| GO:001056310 | Cervix | CC | negative regulation of phosphorus metabolic process | 88/2311 | 442/18723 | 3.21e-06 | 8.77e-05 | 88 |
| GO:004232610 | Cervix | CC | negative regulation of phosphorylation | 77/2311 | 385/18723 | 1.09e-05 | 2.38e-04 | 77 |
| GO:00072666 | Cervix | CC | Rho protein signal transduction | 35/2311 | 137/18723 | 1.77e-05 | 3.33e-04 | 35 |
| GO:00465785 | Cervix | CC | regulation of Ras protein signal transduction | 44/2311 | 189/18723 | 2.05e-05 | 3.73e-04 | 44 |
| GO:000193310 | Cervix | CC | negative regulation of protein phosphorylation | 69/2311 | 342/18723 | 2.29e-05 | 4.01e-04 | 69 |
| GO:000646910 | Cervix | CC | negative regulation of protein kinase activity | 47/2311 | 212/18723 | 4.13e-05 | 6.36e-04 | 47 |
| GO:00336739 | Cervix | CC | negative regulation of kinase activity | 50/2311 | 237/18723 | 9.22e-05 | 1.21e-03 | 50 |
| GO:00015704 | Cervix | CC | vasculogenesis | 22/2311 | 80/18723 | 1.97e-04 | 2.26e-03 | 22 |
| GO:00105067 | Cervix | CC | regulation of autophagy | 61/2311 | 317/18723 | 2.61e-04 | 2.87e-03 | 61 |
| GO:00350235 | Cervix | CC | regulation of Rho protein signal transduction | 22/2311 | 86/18723 | 5.93e-04 | 5.60e-03 | 22 |
| Page: 1 2 3 4 5 6 |
| Pathway ID | Tissue | Disease Stage | Description | Gene Ratio | Bg Ratio | pvalue | p.adjust | qvalue | Count |
| hsa0452020 | Cervix | CC | Adherens junction | 33/1267 | 93/8465 | 6.99e-07 | 7.31e-06 | 4.32e-06 | 33 |
| hsa04520110 | Cervix | CC | Adherens junction | 33/1267 | 93/8465 | 6.99e-07 | 7.31e-06 | 4.32e-06 | 33 |
| hsa0452029 | Oral cavity | OSCC | Adherens junction | 62/3704 | 93/8465 | 6.34e-06 | 3.12e-05 | 1.59e-05 | 62 |
| hsa04520113 | Oral cavity | OSCC | Adherens junction | 62/3704 | 93/8465 | 6.34e-06 | 3.12e-05 | 1.59e-05 | 62 |
| Page: 1 |
Top |
Cell-cell communication analysis |
| Identification of potential cell-cell interactions between two cell types and their ligand-receptor pairs for different disease states |
| Ligand | Receptor | LRpair | Pathway | Tissue | Disease Stage |
| Page: 1 |
Top |
Single-cell gene regulatory network inference analysis |
| Find out the significant the regulons (TFs) and the target genes of each regulon across cell types for different disease states |
| TF | Cell Type | Tissue | Disease Stage | Target Gene | RSS | Regulon Activity |
| ∗The dot plots of a searched regulon are shown for all cell subpopulations in each disease state of each tissue based on the regulon specific score inferred using pySCENIC and by calculating the average expression. |
| Page: 1 |
Top |
Somatic mutation of malignant transformation related genes |
| Annotation of somatic variants for genes involved in malignant transformation |
| Hugo Symbol | Variant Class | Variant Classification | dbSNP RS | HGVSc | HGVSp | HGVSp Short | SWISSPROT | BIOTYPE | SIFT | PolyPhen | Tumor Sample Barcode | Tissue | Histology | Sex | Age | Stage | Therapy Types | Drugs | Outcome |
| RASIP1 | insertion | Frame_Shift_Ins | novel | c.2657_2658insTCCCCAGTCTCCTTCTAACCCCAGATTCTGGACCCCTGTCC | p.Pro888GlnfsTer52 | p.P888Qfs*52 | Q5U651 | protein_coding | TCGA-AN-A0G0-01 | Breast | breast invasive carcinoma | Female | <65 | I/II | Unknown | Unknown | SD | ||
| RASIP1 | SNV | Missense_Mutation | c.1840N>T | p.Ile614Phe | p.I614F | Q5U651 | protein_coding | deleterious(0) | possibly_damaging(0.795) | TCGA-EK-A2RJ-01 | Cervix | cervical & endocervical cancer | Female | <65 | I/II | Unknown | Unknown | SD | |
| RASIP1 | SNV | Missense_Mutation | novel | c.899N>T | p.Pro300Leu | p.P300L | Q5U651 | protein_coding | deleterious(0.02) | benign(0.177) | TCGA-HM-A4S6-01 | Cervix | cervical & endocervical cancer | Female | <65 | III/IV | Chemotherapy | cisplatin | CR |
| RASIP1 | SNV | Missense_Mutation | c.2002N>A | p.Glu668Lys | p.E668K | Q5U651 | protein_coding | tolerated(0.12) | possibly_damaging(0.883) | TCGA-Q1-A73P-01 | Cervix | cervical & endocervical cancer | Female | <65 | I/II | Unknown | Unknown | SD | |
| RASIP1 | SNV | Missense_Mutation | novel | c.2185N>A | p.Glu729Lys | p.E729K | Q5U651 | protein_coding | tolerated(0.08) | benign(0.284) | TCGA-VS-A959-01 | Cervix | cervical & endocervical cancer | Female | >=65 | I/II | Unknown | Unknown | SD |
| RASIP1 | insertion | Frame_Shift_Ins | novel | c.2694_2695insCCCGT | p.Asp899ProfsTer29 | p.D899Pfs*29 | Q5U651 | protein_coding | TCGA-DS-A1OB-01 | Cervix | cervical & endocervical cancer | Female | <65 | I/II | Chemotherapy | carboplatin | PD | ||
| RASIP1 | SNV | Missense_Mutation | c.2768G>A | p.Gly923Asp | p.G923D | Q5U651 | protein_coding | tolerated(0.37) | benign(0.366) | TCGA-4N-A93T-01 | Colorectum | colon adenocarcinoma | Male | >=65 | III/IV | Chemotherapy | xeloda | SD | |
| RASIP1 | SNV | Missense_Mutation | rs374430911 | c.2590N>A | p.Ala864Thr | p.A864T | Q5U651 | protein_coding | deleterious(0.01) | possibly_damaging(0.475) | TCGA-AA-3837-01 | Colorectum | colon adenocarcinoma | Male | >=65 | I/II | Unknown | Unknown | SD |
| RASIP1 | SNV | Missense_Mutation | novel | c.2176G>A | p.Ala726Thr | p.A726T | Q5U651 | protein_coding | tolerated(0.34) | benign(0.05) | TCGA-AA-3984-01 | Colorectum | colon adenocarcinoma | Female | <65 | I/II | Unknown | Unknown | SD |
| RASIP1 | SNV | Missense_Mutation | c.1066G>A | p.Ala356Thr | p.A356T | Q5U651 | protein_coding | tolerated(0.16) | benign(0) | TCGA-AA-A01P-01 | Colorectum | colon adenocarcinoma | Female | >=65 | III/IV | Unknown | Unknown | PD |
| Page: 1 2 3 4 5 6 |
Top |
Related drugs of malignant transformation related genes |
| Identification of chemicals and drugs interact with genes involved in malignant transfromation |
| (DGIdb 4.0) |
| Entrez ID | Symbol | Category | Interaction Types | Drug Claim Name | Drug Name | PMIDs |
| Page: 1 |

Copyright 2023-Present -The University of Texas Health Science Center at Houston |