
|
|||||
|
 | |
| |
| |
| |
| |
| |
|
Gene: RASGEF1B |
Gene summary for RASGEF1B |
| Gene information | Species | Human | Gene symbol | RASGEF1B | Gene ID | 153020 |
| Gene name | RasGEF domain family member 1B | |
| Gene Alias | GPIG4 | |
| Cytomap | 4q21.21 | |
| Gene Type | protein-coding | GO ID | GO:0007154 | UniProtAcc | Q0VAM2 |
Top |
Malignant transformation analysis |
| Identification of the aberrant gene expression in precancerous and cancerous lesions by comparing the gene expression of stem-like cells in diseased tissues with normal stem cells |
| Entrez ID | Symbol | Replicates | Species | Organ | Tissue | Adj P-value | Log2FC | Malignancy |
| 153020 | RASGEF1B | HTA11_3410_2000001011 | Human | Colorectum | AD | 1.32e-05 | -4.10e-01 | 0.0155 |
| 153020 | RASGEF1B | HTA11_3361_2000001011 | Human | Colorectum | AD | 7.69e-28 | 1.35e+00 | -0.1207 |
| 153020 | RASGEF1B | HTA11_866_2000001011 | Human | Colorectum | AD | 2.57e-06 | 4.04e-01 | -0.1001 |
| 153020 | RASGEF1B | HTA11_866_3004761011 | Human | Colorectum | AD | 1.04e-03 | -2.80e-01 | 0.096 |
| 153020 | RASGEF1B | HTA11_10711_2000001011 | Human | Colorectum | AD | 3.09e-05 | -6.05e-01 | 0.0338 |
| 153020 | RASGEF1B | HTA11_7696_3000711011 | Human | Colorectum | AD | 8.54e-11 | -5.67e-01 | 0.0674 |
| 153020 | RASGEF1B | HTA11_6818_2000001011 | Human | Colorectum | AD | 5.84e-35 | 1.76e+00 | 0.0112 |
| 153020 | RASGEF1B | HTA11_99999970781_79442 | Human | Colorectum | MSS | 4.54e-12 | -4.73e-01 | 0.294 |
| 153020 | RASGEF1B | HTA11_99999971662_82457 | Human | Colorectum | MSS | 3.73e-02 | -3.22e-01 | 0.3859 |
| 153020 | RASGEF1B | A015-C-203 | Human | Colorectum | FAP | 4.66e-144 | 1.53e+00 | -0.1294 |
| 153020 | RASGEF1B | A015-C-204 | Human | Colorectum | FAP | 1.74e-58 | 1.26e+00 | -0.0228 |
| 153020 | RASGEF1B | A014-C-040 | Human | Colorectum | FAP | 6.48e-50 | 1.56e+00 | -0.1184 |
| 153020 | RASGEF1B | A002-C-201 | Human | Colorectum | FAP | 4.26e-98 | 1.38e+00 | 0.0324 |
| 153020 | RASGEF1B | A002-C-203 | Human | Colorectum | FAP | 6.32e-23 | 7.17e-01 | 0.2786 |
| 153020 | RASGEF1B | A001-C-119 | Human | Colorectum | FAP | 4.01e-19 | 8.53e-01 | -0.1557 |
| 153020 | RASGEF1B | A001-C-108 | Human | Colorectum | FAP | 3.09e-03 | 4.14e-02 | -0.0272 |
| 153020 | RASGEF1B | A002-C-021 | Human | Colorectum | FAP | 2.55e-13 | 5.15e-01 | 0.1171 |
| 153020 | RASGEF1B | A002-C-205 | Human | Colorectum | FAP | 6.43e-19 | 6.34e-01 | -0.1236 |
| 153020 | RASGEF1B | A014-C-108 | Human | Colorectum | FAP | 5.86e-19 | 7.74e-01 | -0.124 |
| 153020 | RASGEF1B | A001-C-104 | Human | Colorectum | FAP | 4.62e-18 | 6.96e-01 | 0.0184 |
| Page: 1 2 3 4 5 |
| Tissue | Expression Dynamics | Abbreviation |
| Colorectum (GSE201348) |  | FAP: Familial adenomatous polyposis |
| CRC: Colorectal cancer | ||
| Colorectum (HTA11) |  | AD: Adenomas |
| SER: Sessile serrated lesions | ||
| MSI-H: Microsatellite-high colorectal cancer | ||
| MSS: Microsatellite stable colorectal cancer | ||
| Esophagus | 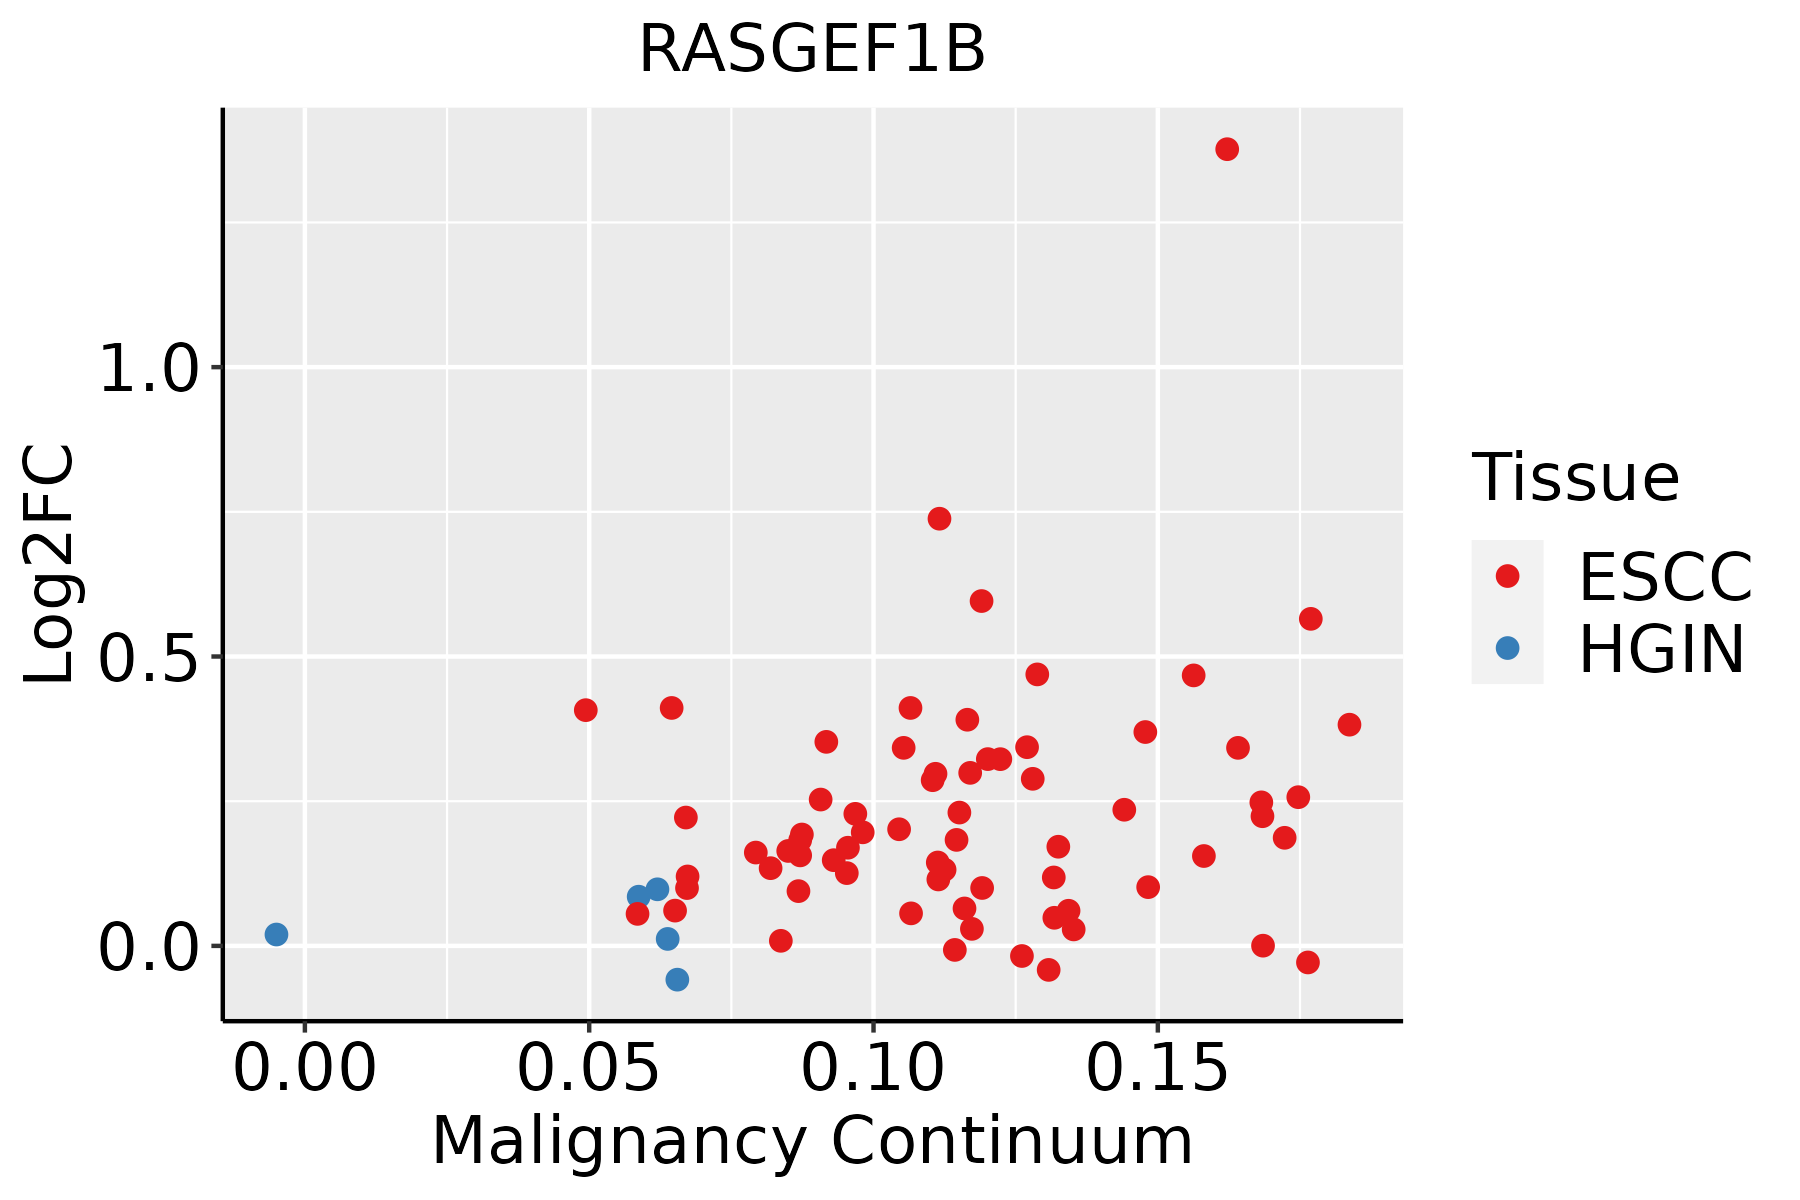 | ESCC: Esophageal squamous cell carcinoma |
| HGIN: High-grade intraepithelial neoplasias | ||
| LGIN: Low-grade intraepithelial neoplasias | ||
| Liver | 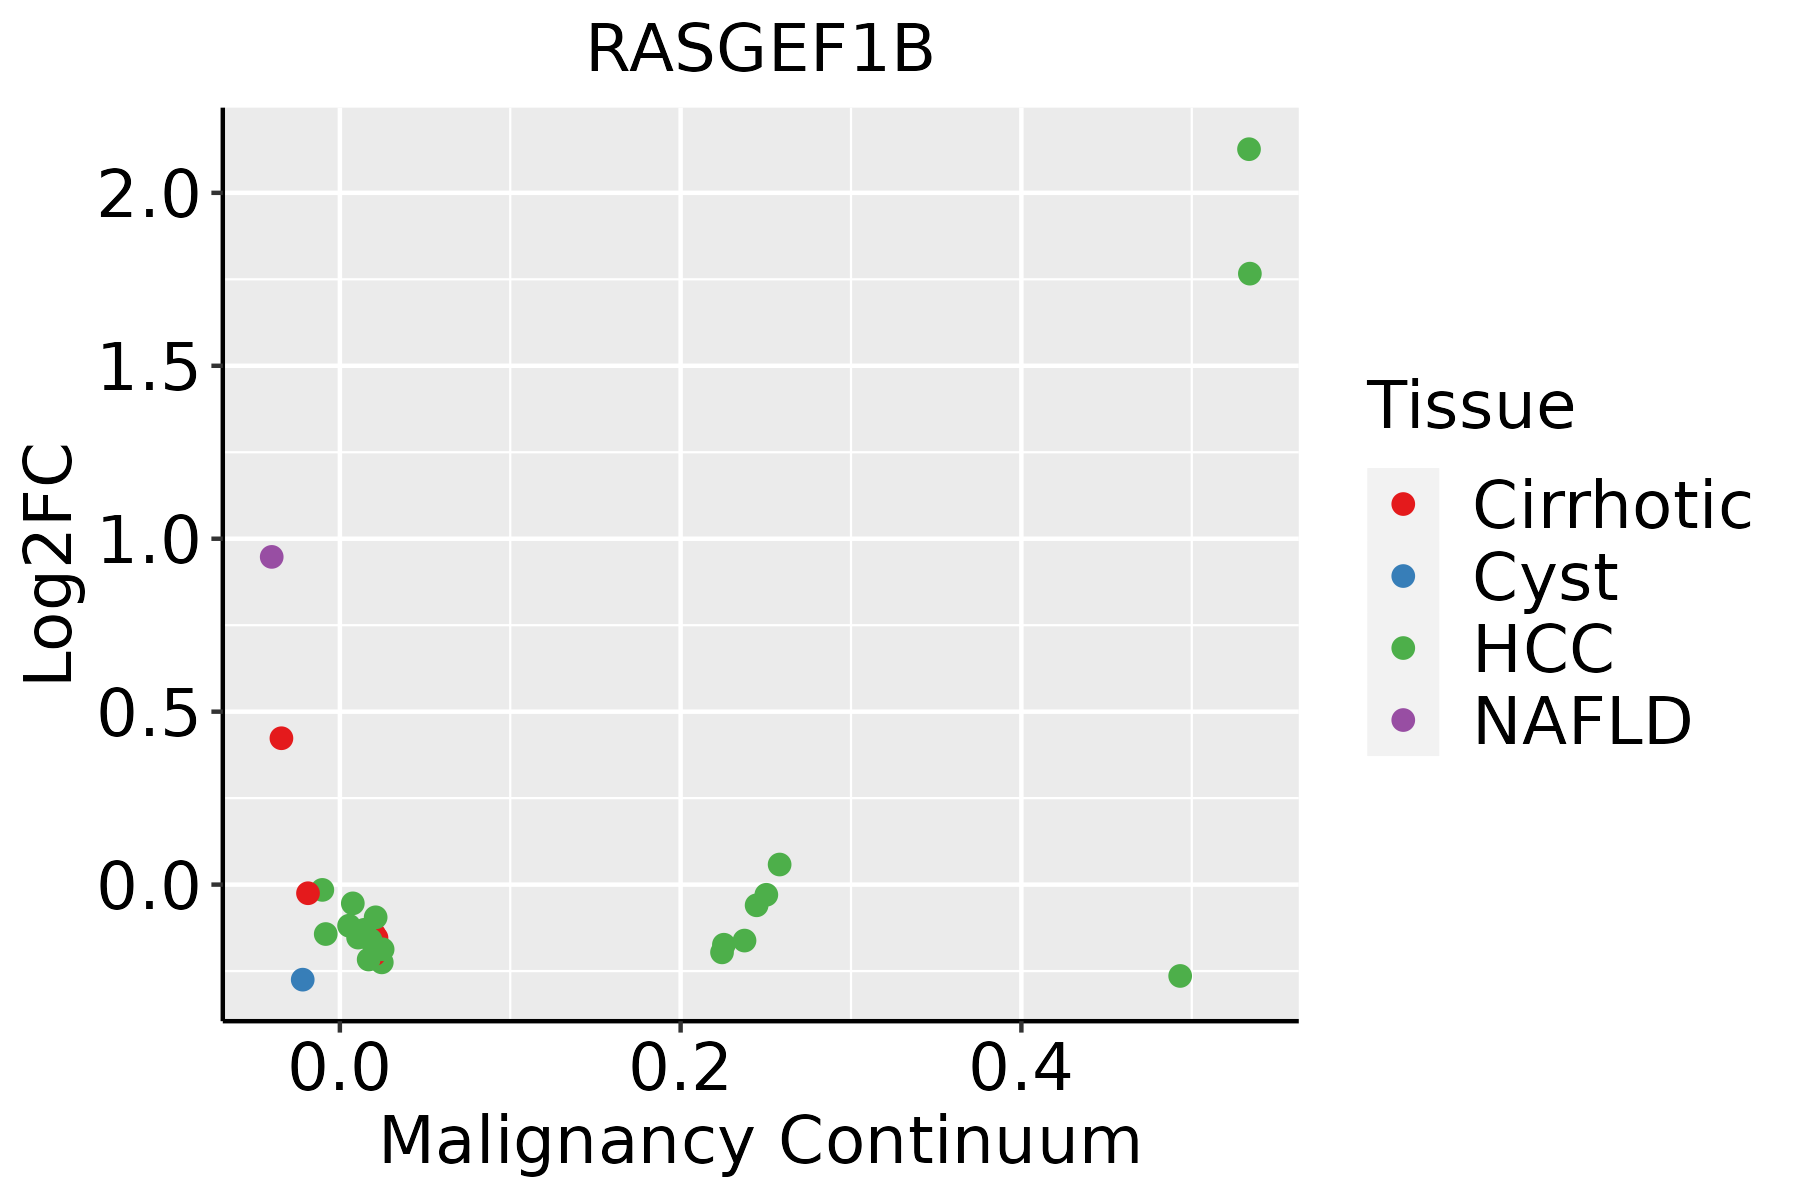 | HCC: Hepatocellular carcinoma |
| NAFLD: Non-alcoholic fatty liver disease | ||
| Skin | 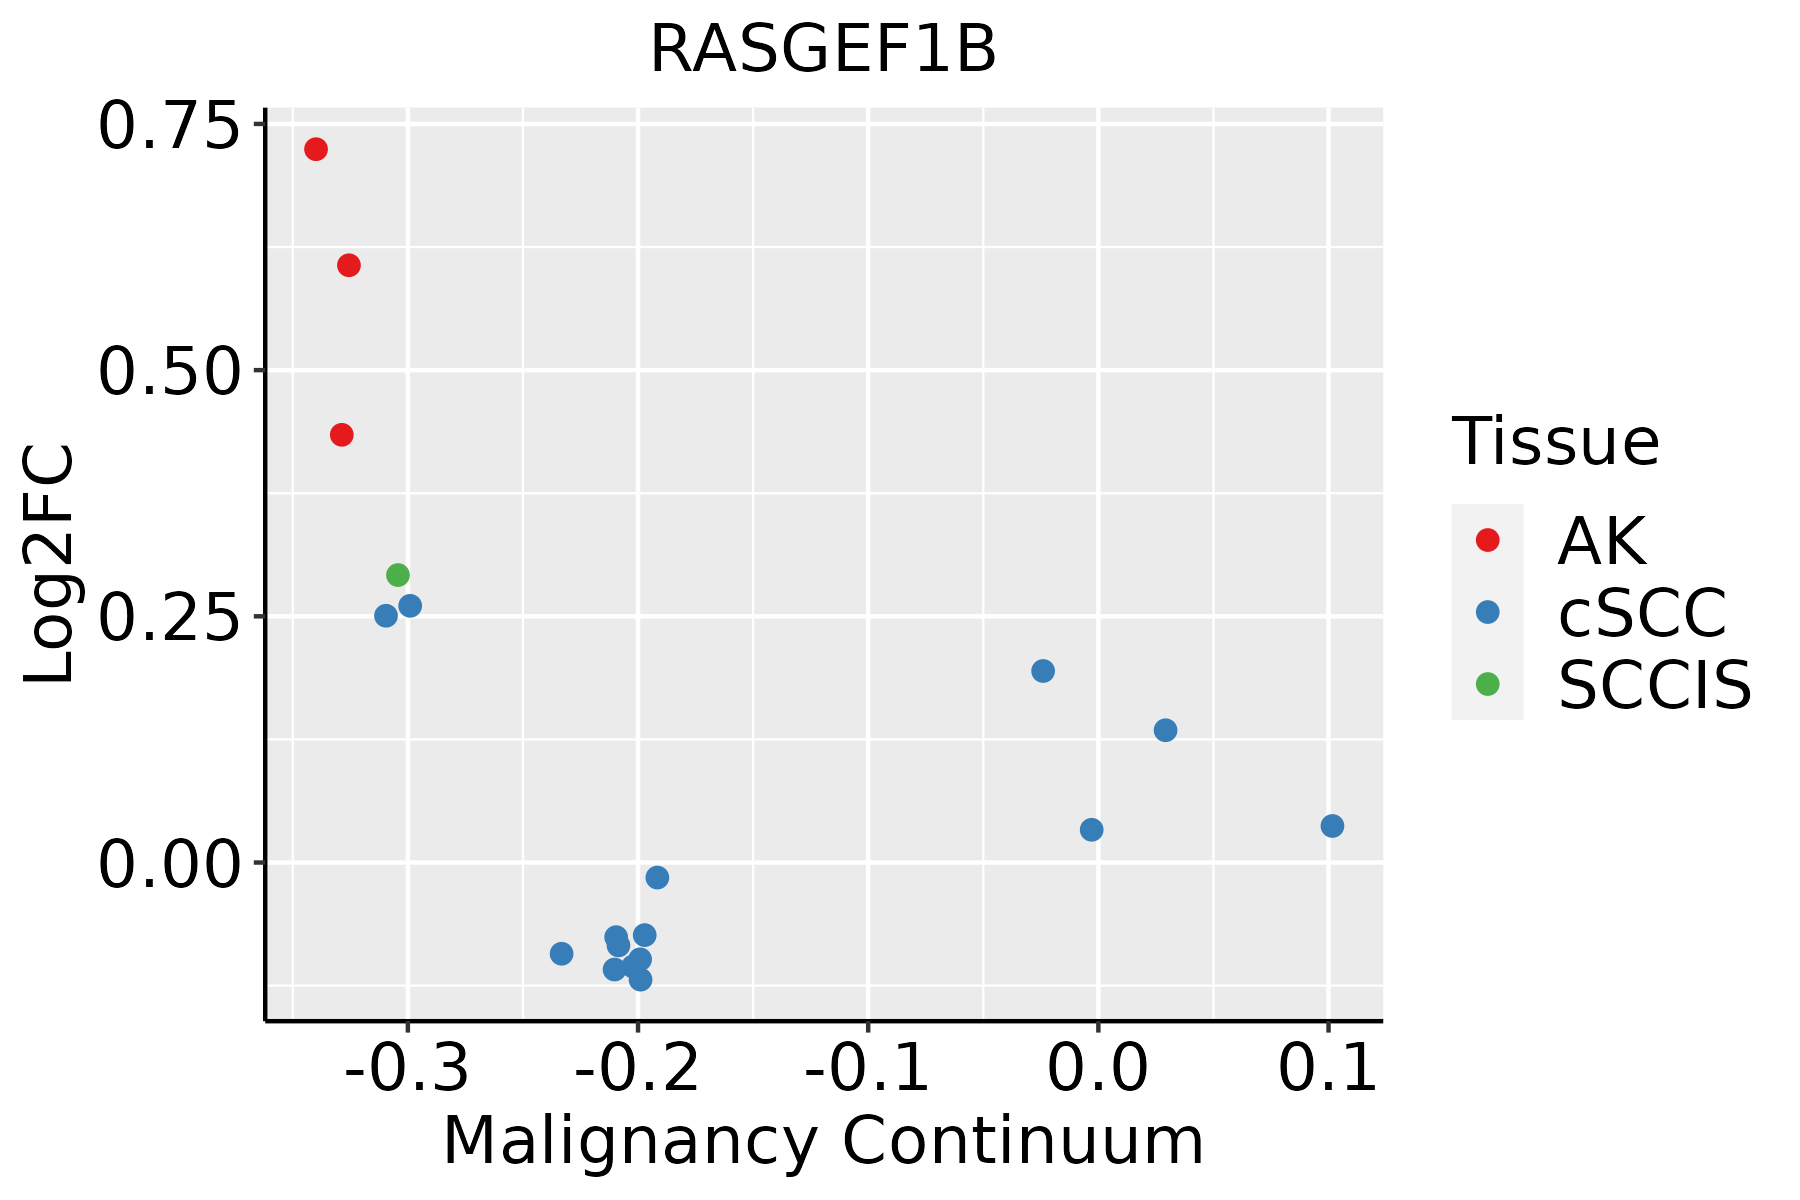 | AK: Actinic keratosis |
| cSCC: Cutaneous squamous cell carcinoma | ||
| SCCIS:squamous cell carcinoma in situ | ||
| Thyroid |  | ATC: Anaplastic thyroid cancer |
| HT: Hashimoto's thyroiditis | ||
| PTC: Papillary thyroid cancer |
| ∗log2FC in expression of this searched gene in stem-like cells from each diseased tissue sample relative to stem-like cells in normal samples in each tissue plotted against the malignancy continuum. Samples are colored based on if they are from different disease stage. |
Top |
Malignant transformation related pathway analysis |
| Find out the enriched GO biological processes and KEGG pathways involved in transition from healthy to precancer to cancer |
| Tissue | Disease Stage | Enriched GO biological Processes |
| Colorectum | AD |  |
| Colorectum | SER |  |
| Colorectum | MSS |  |
| Colorectum | MSI-H |  |
| Colorectum | FAP |  |
| ∗Top 15 enriched GO BP terms are showed in the bar plot of each disease state in each tissue. Each row represents a significant GO biological process which is colored according to the -log10(p.adjust). |
| Page: 1 2 3 4 5 6 7 8 9 |
| GO ID | Tissue | Disease Stage | Description | Gene Ratio | Bg Ratio | pvalue | p.adjust | Count |
| Page: 1 |
| Pathway ID | Tissue | Disease Stage | Description | Gene Ratio | Bg Ratio | pvalue | p.adjust | qvalue | Count |
| Page: 1 |
Top |
Cell-cell communication analysis |
| Identification of potential cell-cell interactions between two cell types and their ligand-receptor pairs for different disease states |
| Ligand | Receptor | LRpair | Pathway | Tissue | Disease Stage |
| Page: 1 |
Top |
Single-cell gene regulatory network inference analysis |
| Find out the significant the regulons (TFs) and the target genes of each regulon across cell types for different disease states |
| TF | Cell Type | Tissue | Disease Stage | Target Gene | RSS | Regulon Activity |
| ∗The dot plots of a searched regulon are shown for all cell subpopulations in each disease state of each tissue based on the regulon specific score inferred using pySCENIC and by calculating the average expression. |
| Page: 1 |
Top |
Somatic mutation of malignant transformation related genes |
| Annotation of somatic variants for genes involved in malignant transformation |
| Hugo Symbol | Variant Class | Variant Classification | dbSNP RS | HGVSc | HGVSp | HGVSp Short | SWISSPROT | BIOTYPE | SIFT | PolyPhen | Tumor Sample Barcode | Tissue | Histology | Sex | Age | Stage | Therapy Types | Drugs | Outcome |
| RASGEF1B | SNV | Missense_Mutation | c.705N>C | p.Gln235His | p.Q235H | Q0VAM2 | protein_coding | tolerated(0.57) | benign(0.006) | TCGA-AC-A23H-01 | Breast | breast invasive carcinoma | Female | >=65 | I/II | Unknown | Unknown | PD | |
| RASGEF1B | SNV | Missense_Mutation | c.1239G>A | p.Met413Ile | p.M413I | Q0VAM2 | protein_coding | tolerated(0.96) | benign(0.001) | TCGA-AQ-A04J-01 | Breast | breast invasive carcinoma | Female | <65 | I/II | Chemotherapy | cytoxan | SD | |
| RASGEF1B | insertion | Nonsense_Mutation | novel | c.745_746insAGCCACTGTAATAT | p.Arg249GlnfsTer4 | p.R249Qfs*4 | Q0VAM2 | protein_coding | TCGA-E9-A1NC-01 | Breast | breast invasive carcinoma | Female | <65 | I/II | Chemotherapy | doxorubicin | CR | ||
| RASGEF1B | SNV | Missense_Mutation | c.247G>A | p.Val83Ile | p.V83I | Q0VAM2 | protein_coding | tolerated(0.14) | benign(0.206) | TCGA-AA-3510-01 | Colorectum | colon adenocarcinoma | Male | >=65 | I/II | Unknown | Unknown | SD | |
| RASGEF1B | SNV | Missense_Mutation | rs373675008 | c.1171C>T | p.Arg391Cys | p.R391C | Q0VAM2 | protein_coding | deleterious(0.02) | probably_damaging(0.953) | TCGA-AA-3848-01 | Colorectum | colon adenocarcinoma | Female | >=65 | III/IV | Unknown | Unknown | PD |
| RASGEF1B | SNV | Missense_Mutation | c.346N>A | p.Glu116Lys | p.E116K | Q0VAM2 | protein_coding | deleterious(0.04) | possibly_damaging(0.897) | TCGA-AA-3864-01 | Colorectum | colon adenocarcinoma | Male | >=65 | I/II | Unknown | Unknown | SD | |
| RASGEF1B | SNV | Missense_Mutation | c.179N>T | p.Arg60Ile | p.R60I | Q0VAM2 | protein_coding | deleterious(0.01) | possibly_damaging(0.781) | TCGA-AA-A00N-01 | Colorectum | colon adenocarcinoma | Male | >=65 | I/II | Unknown | Unknown | PD | |
| RASGEF1B | SNV | Missense_Mutation | c.547N>A | p.Asp183Asn | p.D183N | Q0VAM2 | protein_coding | tolerated(0.06) | benign(0.196) | TCGA-WS-AB45-01 | Colorectum | colon adenocarcinoma | Female | <65 | I/II | Unknown | Unknown | SD | |
| RASGEF1B | SNV | Missense_Mutation | novel | c.750N>T | p.Lys250Asn | p.K250N | Q0VAM2 | protein_coding | deleterious(0.02) | benign(0.16) | TCGA-AG-A002-01 | Colorectum | rectum adenocarcinoma | Male | <65 | I/II | Unknown | Unknown | SD |
| RASGEF1B | SNV | Missense_Mutation | c.1046G>A | p.Arg349Gln | p.R349Q | Q0VAM2 | protein_coding | deleterious(0) | probably_damaging(0.998) | TCGA-EI-6917-01 | Colorectum | rectum adenocarcinoma | Male | <65 | III/IV | Chemotherapy | 5fluorouracil+oxaciplatina+l-folinian | SD |
| Page: 1 2 3 4 5 6 |
Top |
Related drugs of malignant transformation related genes |
| Identification of chemicals and drugs interact with genes involved in malignant transfromation |
| (DGIdb 4.0) |
| Entrez ID | Symbol | Category | Interaction Types | Drug Claim Name | Drug Name | PMIDs |
| Page: 1 |

Copyright 2023-Present -The University of Texas Health Science Center at Houston |