
|
|||||
|
 | |
| |
| |
| |
| |
| |
|
Gene: RASGEF1A |
Gene summary for RASGEF1A |
| Gene information | Species | Human | Gene symbol | RASGEF1A | Gene ID | 221002 |
| Gene name | RasGEF domain family member 1A | |
| Gene Alias | CG4853 | |
| Cytomap | 10q11.21 | |
| Gene Type | protein-coding | GO ID | GO:0006928 | UniProtAcc | Q8N9B8 |
Top |
Malignant transformation analysis |
| Identification of the aberrant gene expression in precancerous and cancerous lesions by comparing the gene expression of stem-like cells in diseased tissues with normal stem cells |
| Entrez ID | Symbol | Replicates | Species | Organ | Tissue | Adj P-value | Log2FC | Malignancy |
| 221002 | RASGEF1A | P2T-E | Human | Esophagus | ESCC | 1.70e-02 | 1.18e-01 | 0.1177 |
| 221002 | RASGEF1A | P5T-E | Human | Esophagus | ESCC | 9.02e-11 | 2.31e-01 | 0.1327 |
| 221002 | RASGEF1A | P11T-E | Human | Esophagus | ESCC | 1.22e-13 | 4.94e-01 | 0.1426 |
| 221002 | RASGEF1A | P17T-E | Human | Esophagus | ESCC | 3.92e-04 | 2.29e-01 | 0.1278 |
| 221002 | RASGEF1A | P19T-E | Human | Esophagus | ESCC | 2.17e-08 | 6.40e-01 | 0.1662 |
| 221002 | RASGEF1A | P24T-E | Human | Esophagus | ESCC | 4.30e-10 | 2.55e-01 | 0.1287 |
| 221002 | RASGEF1A | P27T-E | Human | Esophagus | ESCC | 1.66e-02 | 8.99e-02 | 0.1055 |
| 221002 | RASGEF1A | P28T-E | Human | Esophagus | ESCC | 2.02e-06 | 1.31e-01 | 0.1149 |
| 221002 | RASGEF1A | P36T-E | Human | Esophagus | ESCC | 3.07e-02 | 1.70e-01 | 0.1187 |
| 221002 | RASGEF1A | P37T-E | Human | Esophagus | ESCC | 4.28e-10 | 1.70e-01 | 0.1371 |
| 221002 | RASGEF1A | P38T-E | Human | Esophagus | ESCC | 1.85e-04 | 2.26e-01 | 0.127 |
| 221002 | RASGEF1A | P80T-E | Human | Esophagus | ESCC | 1.51e-08 | 2.31e-01 | 0.155 |
| 221002 | RASGEF1A | P89T-E | Human | Esophagus | ESCC | 1.07e-13 | 7.81e-01 | 0.1752 |
| 221002 | RASGEF1A | P107T-E | Human | Esophagus | ESCC | 1.56e-06 | 1.61e-01 | 0.171 |
| 221002 | RASGEF1A | P128T-E | Human | Esophagus | ESCC | 3.32e-03 | 1.49e-01 | 0.1241 |
| 221002 | RASGEF1A | P130T-E | Human | Esophagus | ESCC | 6.36e-33 | 6.22e-01 | 0.1676 |
| Page: 1 |
| Tissue | Expression Dynamics | Abbreviation |
| Esophagus | 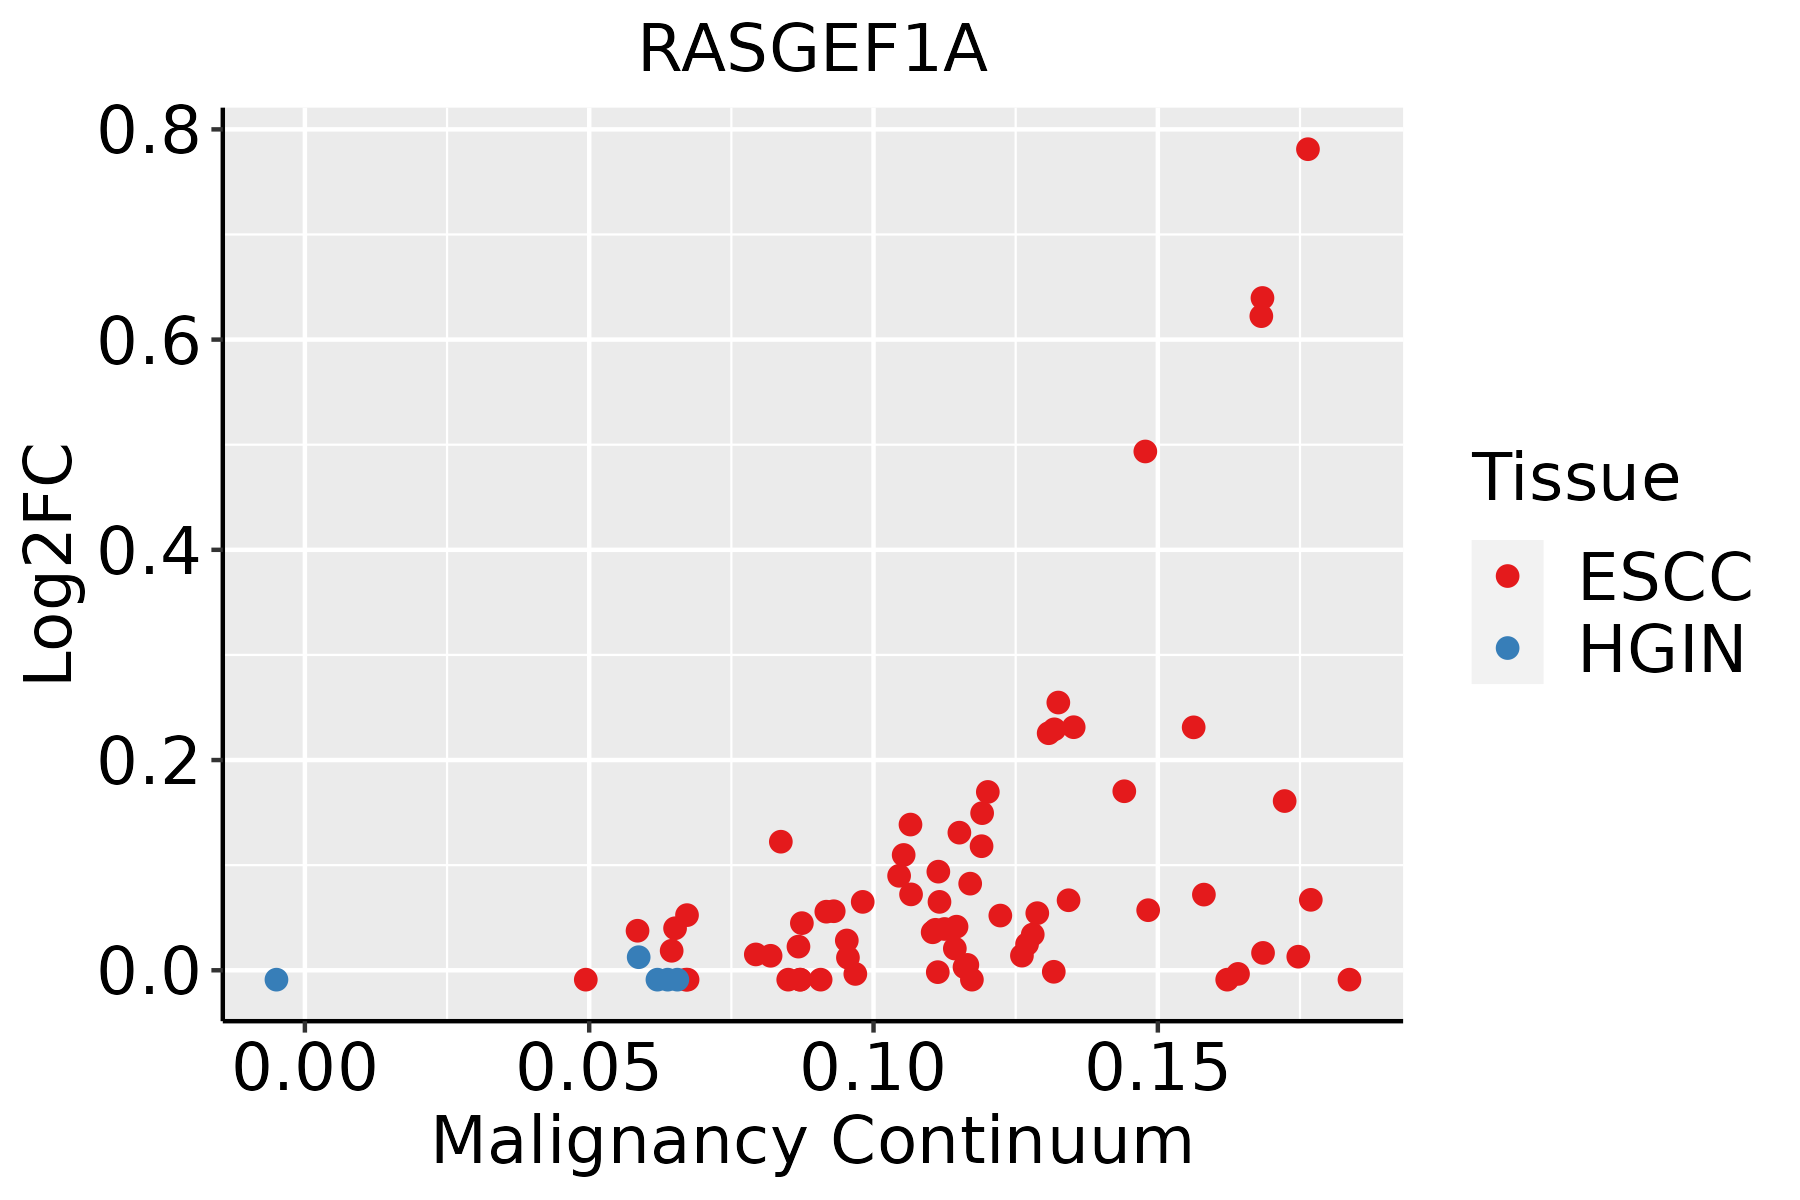 | ESCC: Esophageal squamous cell carcinoma |
| HGIN: High-grade intraepithelial neoplasias | ||
| LGIN: Low-grade intraepithelial neoplasias |
| ∗log2FC in expression of this searched gene in stem-like cells from each diseased tissue sample relative to stem-like cells in normal samples in each tissue plotted against the malignancy continuum. Samples are colored based on if they are from different disease stage. |
Top |
Malignant transformation related pathway analysis |
| Find out the enriched GO biological processes and KEGG pathways involved in transition from healthy to precancer to cancer |
| Tissue | Disease Stage | Enriched GO biological Processes |
| Colorectum | AD |  |
| Colorectum | SER |  |
| Colorectum | MSS |  |
| Colorectum | MSI-H |  |
| Colorectum | FAP |  |
| ∗Top 15 enriched GO BP terms are showed in the bar plot of each disease state in each tissue. Each row represents a significant GO biological process which is colored according to the -log10(p.adjust). |
| Page: 1 2 3 4 5 6 7 8 9 |
| GO ID | Tissue | Disease Stage | Description | Gene Ratio | Bg Ratio | pvalue | p.adjust | Count |
| GO:000726510 | Esophagus | ESCC | Ras protein signal transduction | 201/8552 | 337/18723 | 1.44e-07 | 2.30e-06 | 201 |
| GO:00465789 | Esophagus | ESCC | regulation of Ras protein signal transduction | 106/8552 | 189/18723 | 2.49e-03 | 1.08e-02 | 106 |
| GO:005105610 | Esophagus | ESCC | regulation of small GTPase mediated signal transduction | 157/8552 | 302/18723 | 1.55e-02 | 4.98e-02 | 157 |
| Page: 1 |
| Pathway ID | Tissue | Disease Stage | Description | Gene Ratio | Bg Ratio | pvalue | p.adjust | qvalue | Count |
| Page: 1 |
Top |
Cell-cell communication analysis |
| Identification of potential cell-cell interactions between two cell types and their ligand-receptor pairs for different disease states |
| Ligand | Receptor | LRpair | Pathway | Tissue | Disease Stage |
| Page: 1 |
Top |
Single-cell gene regulatory network inference analysis |
| Find out the significant the regulons (TFs) and the target genes of each regulon across cell types for different disease states |
| TF | Cell Type | Tissue | Disease Stage | Target Gene | RSS | Regulon Activity |
| ∗The dot plots of a searched regulon are shown for all cell subpopulations in each disease state of each tissue based on the regulon specific score inferred using pySCENIC and by calculating the average expression. |
| Page: 1 |
Top |
Somatic mutation of malignant transformation related genes |
| Annotation of somatic variants for genes involved in malignant transformation |
| Hugo Symbol | Variant Class | Variant Classification | dbSNP RS | HGVSc | HGVSp | HGVSp Short | SWISSPROT | BIOTYPE | SIFT | PolyPhen | Tumor Sample Barcode | Tissue | Histology | Sex | Age | Stage | Therapy Types | Drugs | Outcome |
| RASGEF1A | SNV | Missense_Mutation | c.493N>T | p.Thr165Ser | p.T165S | Q8N9B8 | protein_coding | tolerated(0.37) | benign(0.061) | TCGA-E2-A1IK-01 | Breast | breast invasive carcinoma | Female | >=65 | I/II | Hormone Therapy | arimidex | SD | |
| RASGEF1A | SNV | Missense_Mutation | rs767084570 | c.634N>A | p.Ala212Thr | p.A212T | Q8N9B8 | protein_coding | tolerated(0.53) | benign(0.003) | TCGA-DS-A0VM-01 | Cervix | cervical & endocervical cancer | Female | <65 | I/II | Chemotherapy | cisplatin | PD |
| RASGEF1A | SNV | Missense_Mutation | novel | c.442N>A | p.Glu148Lys | p.E148K | Q8N9B8 | protein_coding | tolerated(0.18) | benign(0.103) | TCGA-5M-AAT6-01 | Colorectum | colon adenocarcinoma | Female | <65 | III/IV | Unknown | Unknown | PD |
| RASGEF1A | SNV | Missense_Mutation | c.1099N>A | p.Ala367Thr | p.A367T | Q8N9B8 | protein_coding | tolerated(0.34) | benign(0.111) | TCGA-AA-3510-01 | Colorectum | colon adenocarcinoma | Male | >=65 | I/II | Unknown | Unknown | SD | |
| RASGEF1A | SNV | Missense_Mutation | novel | c.1192N>C | p.Tyr398His | p.Y398H | Q8N9B8 | protein_coding | deleterious(0.02) | possibly_damaging(0.477) | TCGA-AA-A00N-01 | Colorectum | colon adenocarcinoma | Male | >=65 | I/II | Unknown | Unknown | PD |
| RASGEF1A | SNV | Missense_Mutation | c.148N>T | p.Asp50Tyr | p.D50Y | Q8N9B8 | protein_coding | deleterious(0) | probably_damaging(0.993) | TCGA-CA-6717-01 | Colorectum | colon adenocarcinoma | Male | <65 | I/II | Chemotherapy | oxaliplatin | CR | |
| RASGEF1A | SNV | Missense_Mutation | c.1358N>C | p.Ile453Thr | p.I453T | Q8N9B8 | protein_coding | deleterious(0) | benign(0.219) | TCGA-CM-6171-01 | Colorectum | colon adenocarcinoma | Female | >=65 | I/II | Unknown | Unknown | SD | |
| RASGEF1A | SNV | Missense_Mutation | novel | c.134N>G | p.Asp45Gly | p.D45G | Q8N9B8 | protein_coding | tolerated(0.46) | benign(0.003) | TCGA-DM-A1HA-01 | Colorectum | colon adenocarcinoma | Male | >=65 | III/IV | Unknown | Unknown | SD |
| RASGEF1A | SNV | Missense_Mutation | c.1384N>A | p.Ala462Thr | p.A462T | Q8N9B8 | protein_coding | deleterious(0) | possibly_damaging(0.637) | TCGA-AG-A002-01 | Colorectum | rectum adenocarcinoma | Male | <65 | I/II | Unknown | Unknown | SD | |
| RASGEF1A | SNV | Missense_Mutation | rs764016510 | c.872N>A | p.Arg291Gln | p.R291Q | Q8N9B8 | protein_coding | tolerated(0.21) | possibly_damaging(0.497) | TCGA-AG-A02N-01 | Colorectum | rectum adenocarcinoma | Male | >=65 | I/II | Chemotherapy | folinic | CR |
| Page: 1 2 3 4 5 6 |
Top |
Related drugs of malignant transformation related genes |
| Identification of chemicals and drugs interact with genes involved in malignant transfromation |
| (DGIdb 4.0) |
| Entrez ID | Symbol | Category | Interaction Types | Drug Claim Name | Drug Name | PMIDs |
| Page: 1 |

Copyright 2023-Present -The University of Texas Health Science Center at Houston |