
|
|||||
|
 | |
| |
| |
| |
| |
| |
|
Gene: RASEF |
Gene summary for RASEF |
| Gene information | Species | Human | Gene symbol | RASEF | Gene ID | 158158 |
| Gene name | RAS and EF-hand domain containing | |
| Gene Alias | RAB45 | |
| Cytomap | 9q21.32 | |
| Gene Type | protein-coding | GO ID | GO:0005575 | UniProtAcc | Q8IZ41 |
Top |
Malignant transformation analysis |
| Identification of the aberrant gene expression in precancerous and cancerous lesions by comparing the gene expression of stem-like cells in diseased tissues with normal stem cells |
| Entrez ID | Symbol | Replicates | Species | Organ | Tissue | Adj P-value | Log2FC | Malignancy |
| 158158 | RASEF | CCI_1 | Human | Cervix | CC | 2.32e-04 | 3.16e-01 | 0.528 |
| 158158 | RASEF | CCI_2 | Human | Cervix | CC | 5.98e-15 | 7.71e-01 | 0.5249 |
| 158158 | RASEF | CCI_3 | Human | Cervix | CC | 1.20e-09 | 4.56e-01 | 0.516 |
| 158158 | RASEF | H2 | Human | Cervix | HSIL_HPV | 1.63e-02 | 1.51e-01 | 0.0632 |
| 158158 | RASEF | T1 | Human | Cervix | CC | 4.32e-03 | 1.67e-01 | 0.0918 |
| 158158 | RASEF | HTA11_3410_2000001011 | Human | Colorectum | AD | 2.05e-08 | -3.88e-01 | 0.0155 |
| 158158 | RASEF | HTA11_78_2000001011 | Human | Colorectum | AD | 2.01e-04 | 4.67e-01 | -0.1088 |
| 158158 | RASEF | HTA11_347_2000001011 | Human | Colorectum | AD | 2.18e-06 | 4.93e-01 | -0.1954 |
| 158158 | RASEF | HTA11_411_2000001011 | Human | Colorectum | SER | 2.13e-03 | 1.15e+00 | -0.2602 |
| 158158 | RASEF | HTA11_99999974143_84620 | Human | Colorectum | MSS | 3.55e-07 | -4.57e-01 | 0.3005 |
| 158158 | RASEF | A015-C-203 | Human | Colorectum | FAP | 1.33e-22 | -3.46e-01 | -0.1294 |
| 158158 | RASEF | A002-C-201 | Human | Colorectum | FAP | 2.08e-06 | -2.14e-01 | 0.0324 |
| 158158 | RASEF | A001-C-108 | Human | Colorectum | FAP | 1.03e-09 | 1.18e-02 | -0.0272 |
| 158158 | RASEF | A002-C-205 | Human | Colorectum | FAP | 2.10e-12 | -2.94e-01 | -0.1236 |
| 158158 | RASEF | A015-C-006 | Human | Colorectum | FAP | 7.98e-11 | -3.71e-01 | -0.0994 |
| 158158 | RASEF | A015-C-106 | Human | Colorectum | FAP | 1.15e-07 | 4.39e-02 | -0.0511 |
| 158158 | RASEF | A002-C-114 | Human | Colorectum | FAP | 2.33e-12 | -5.15e-02 | -0.1561 |
| 158158 | RASEF | A015-C-104 | Human | Colorectum | FAP | 1.86e-22 | -3.17e-01 | -0.1899 |
| 158158 | RASEF | A001-C-014 | Human | Colorectum | FAP | 1.44e-07 | 9.06e-02 | 0.0135 |
| 158158 | RASEF | A002-C-016 | Human | Colorectum | FAP | 1.82e-14 | -7.81e-02 | 0.0521 |
| Page: 1 2 3 4 5 6 7 |
| Tissue | Expression Dynamics | Abbreviation |
| Cervix | 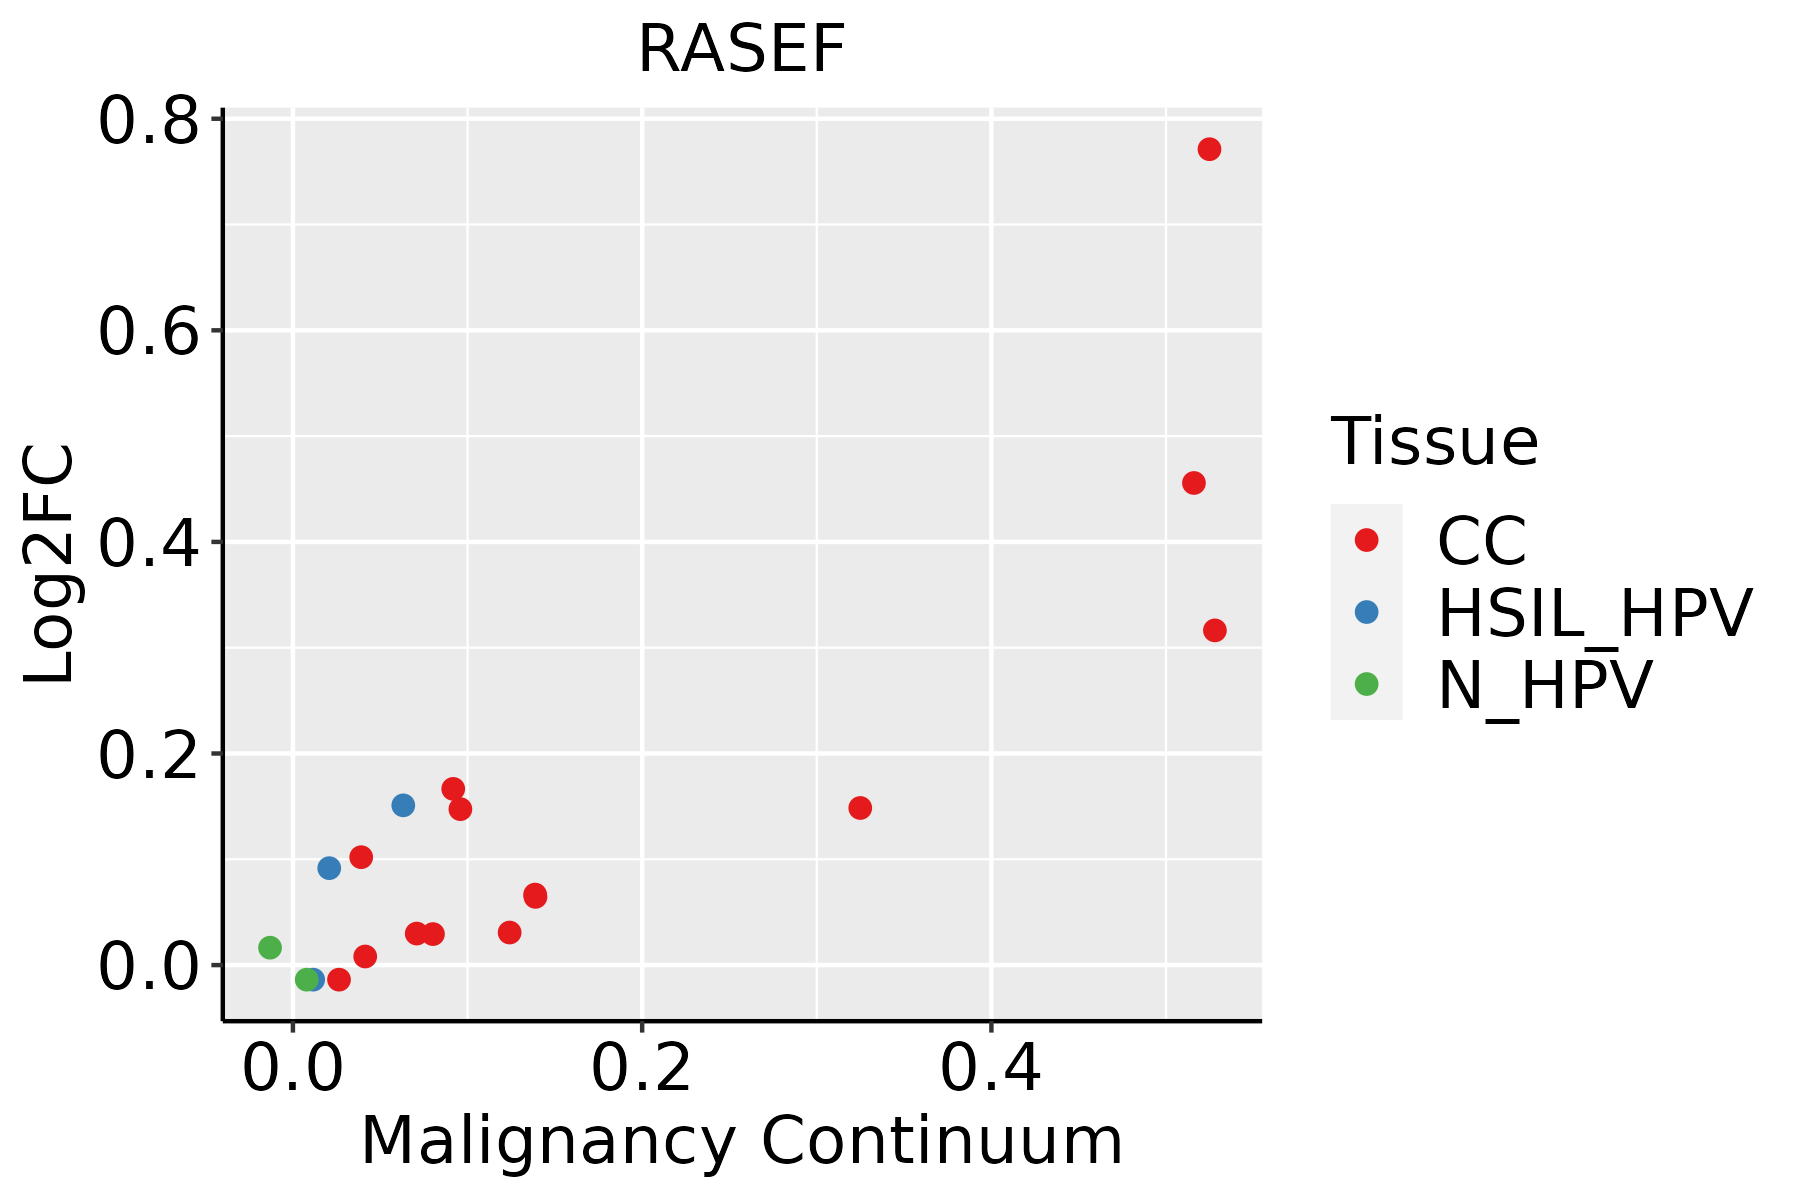 | CC: Cervix cancer |
| HSIL_HPV: HPV-infected high-grade squamous intraepithelial lesions | ||
| N_HPV: HPV-infected normal cervix | ||
| Colorectum (GSE201348) |  | FAP: Familial adenomatous polyposis |
| CRC: Colorectal cancer | ||
| Colorectum (HTA11) |  | AD: Adenomas |
| SER: Sessile serrated lesions | ||
| MSI-H: Microsatellite-high colorectal cancer | ||
| MSS: Microsatellite stable colorectal cancer | ||
| Esophagus | 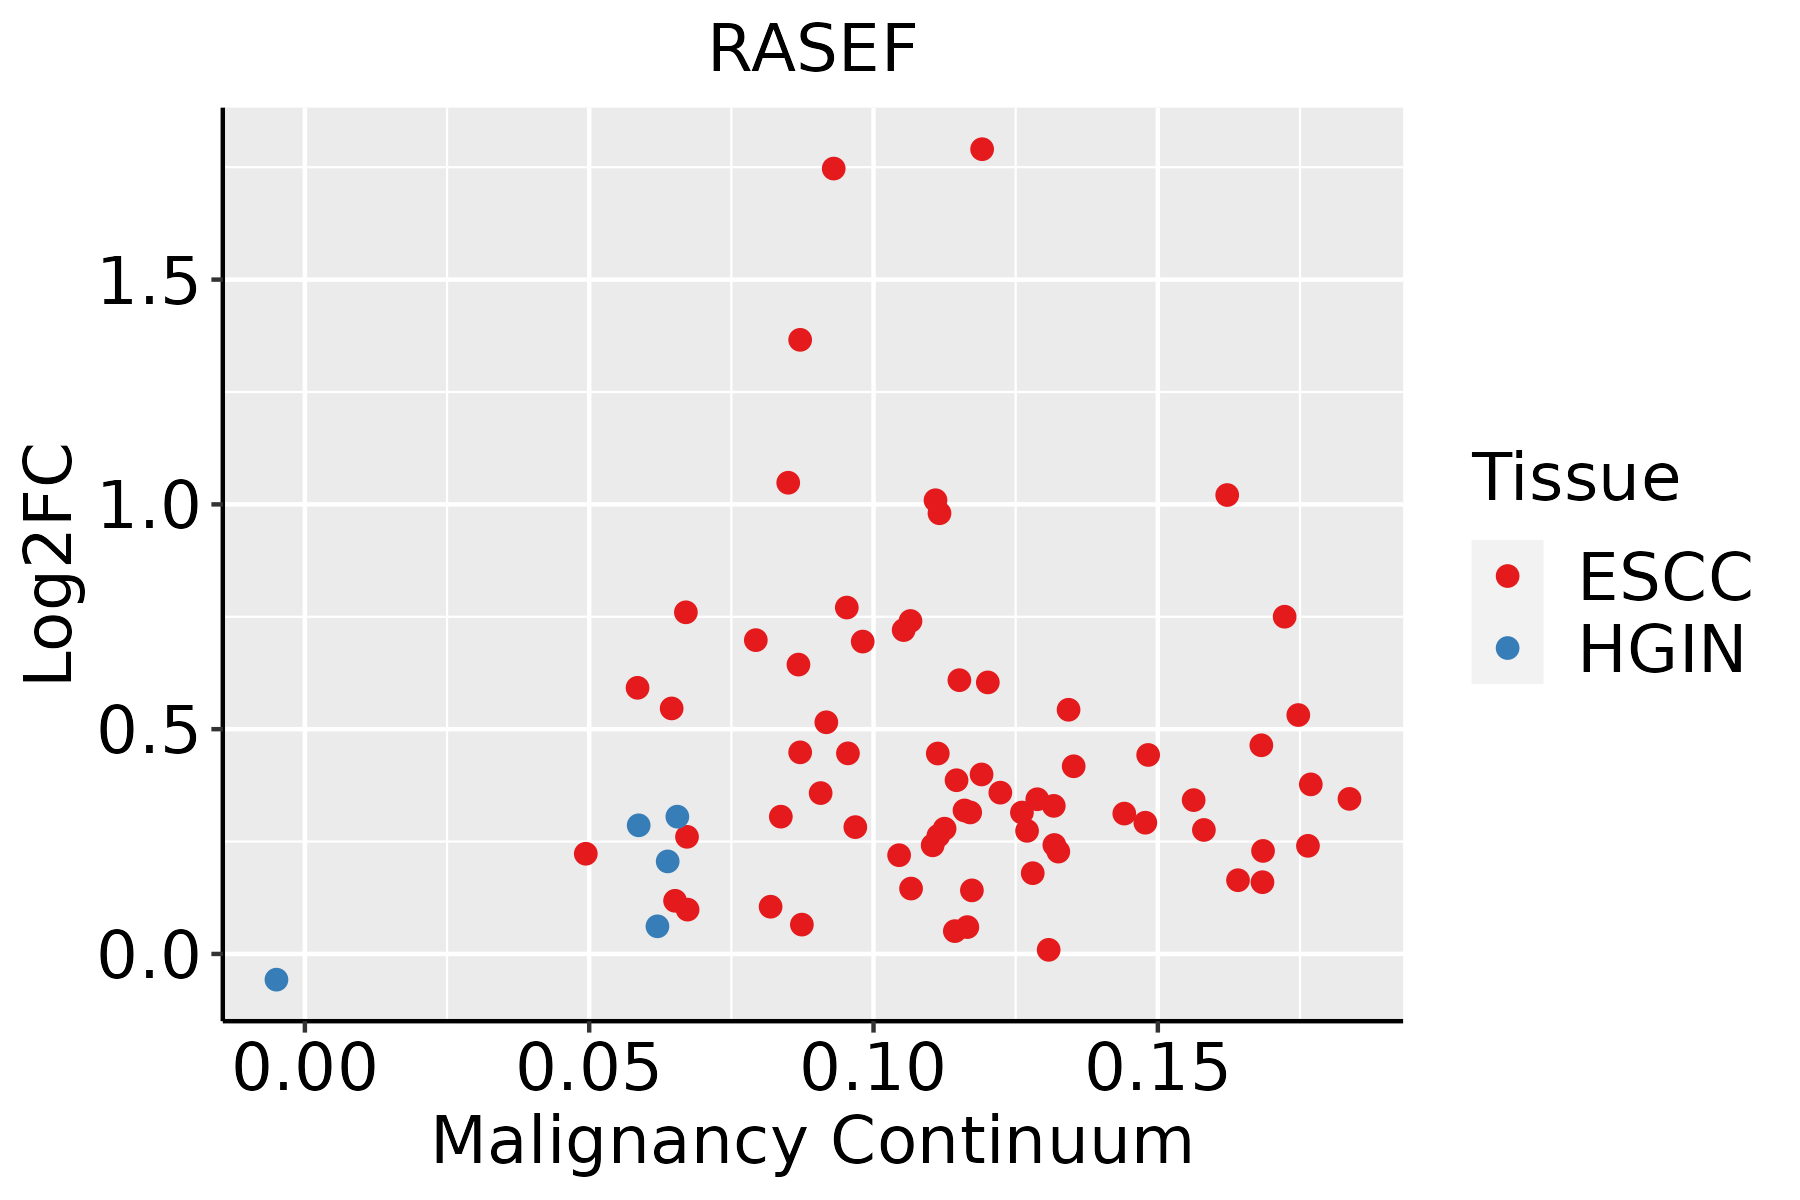 | ESCC: Esophageal squamous cell carcinoma |
| HGIN: High-grade intraepithelial neoplasias | ||
| LGIN: Low-grade intraepithelial neoplasias | ||
| Liver | 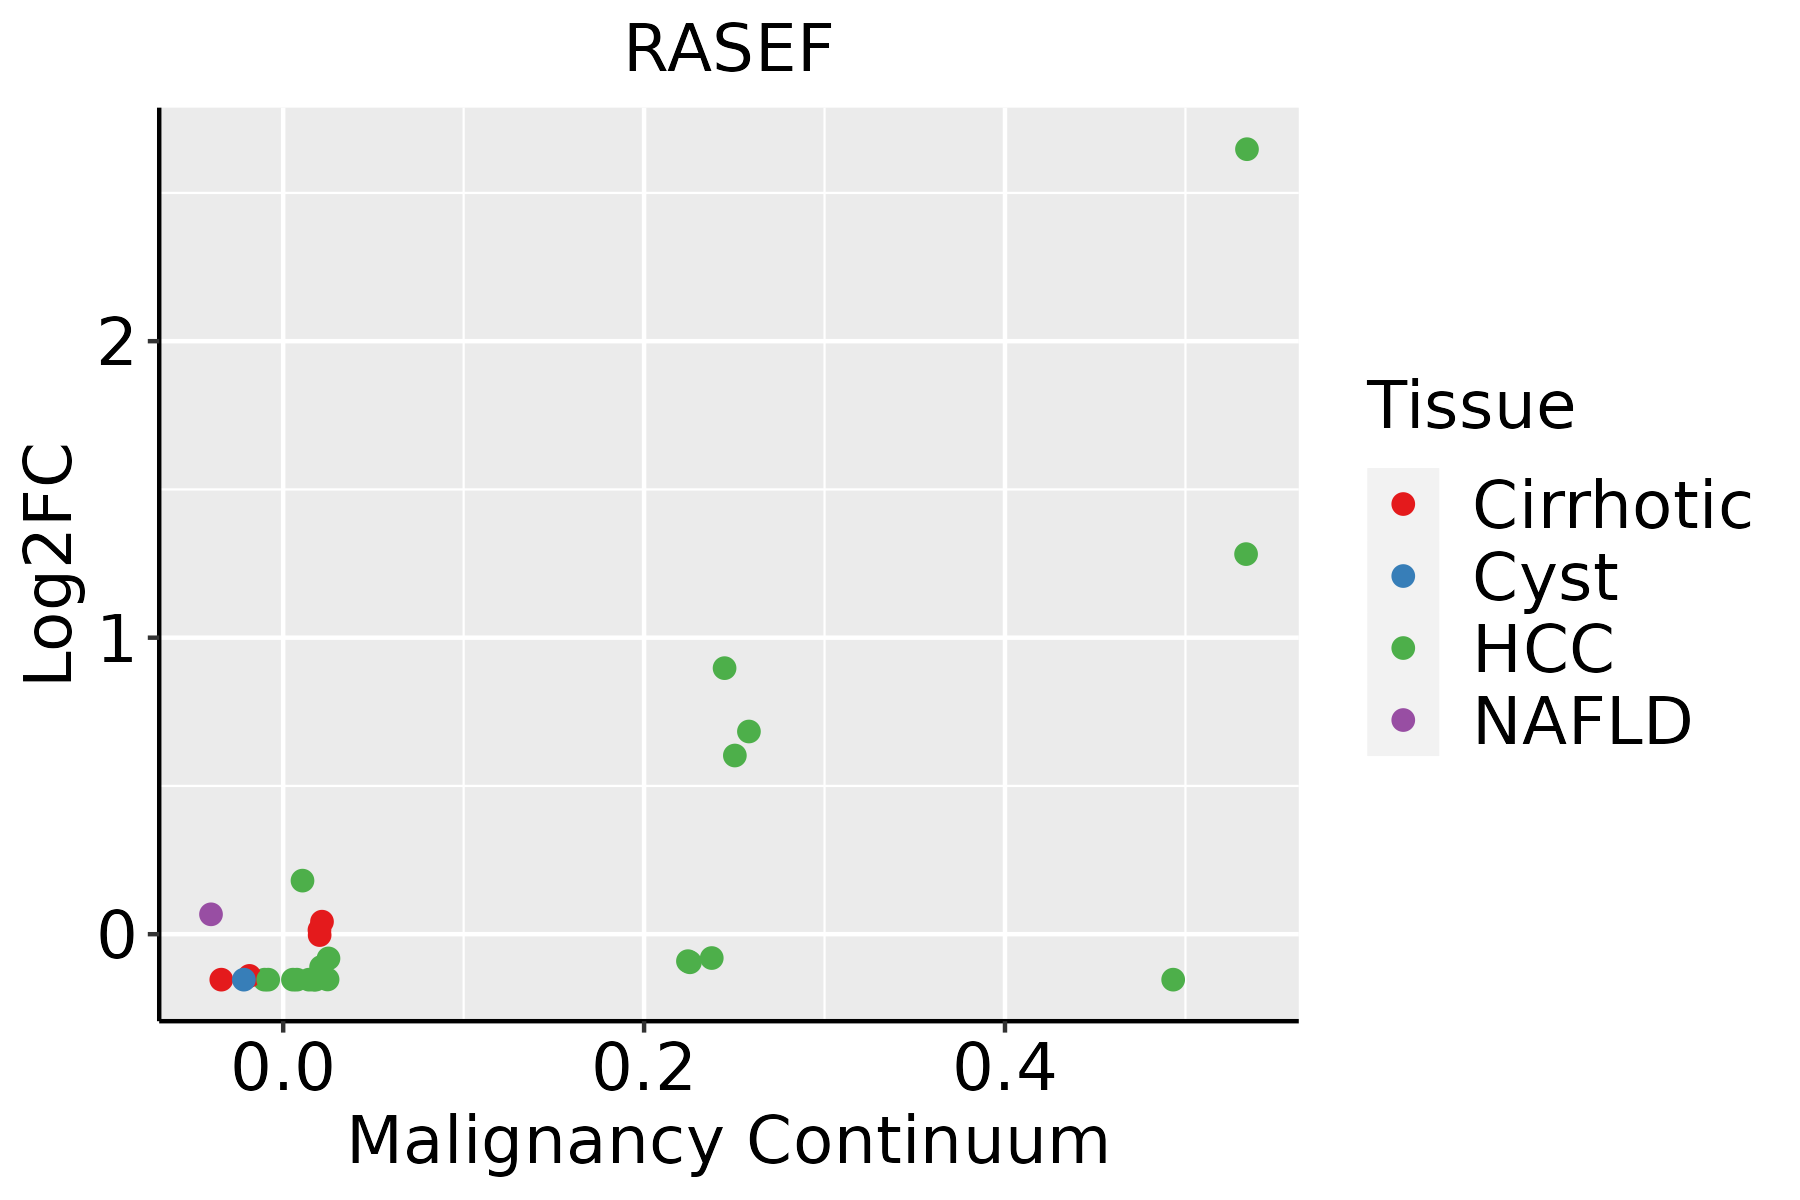 | HCC: Hepatocellular carcinoma |
| NAFLD: Non-alcoholic fatty liver disease | ||
| Lung |  | AAH: Atypical adenomatous hyperplasia |
| AIS: Adenocarcinoma in situ | ||
| IAC: Invasive lung adenocarcinoma | ||
| MIA: Minimally invasive adenocarcinoma | ||
| Prostate | 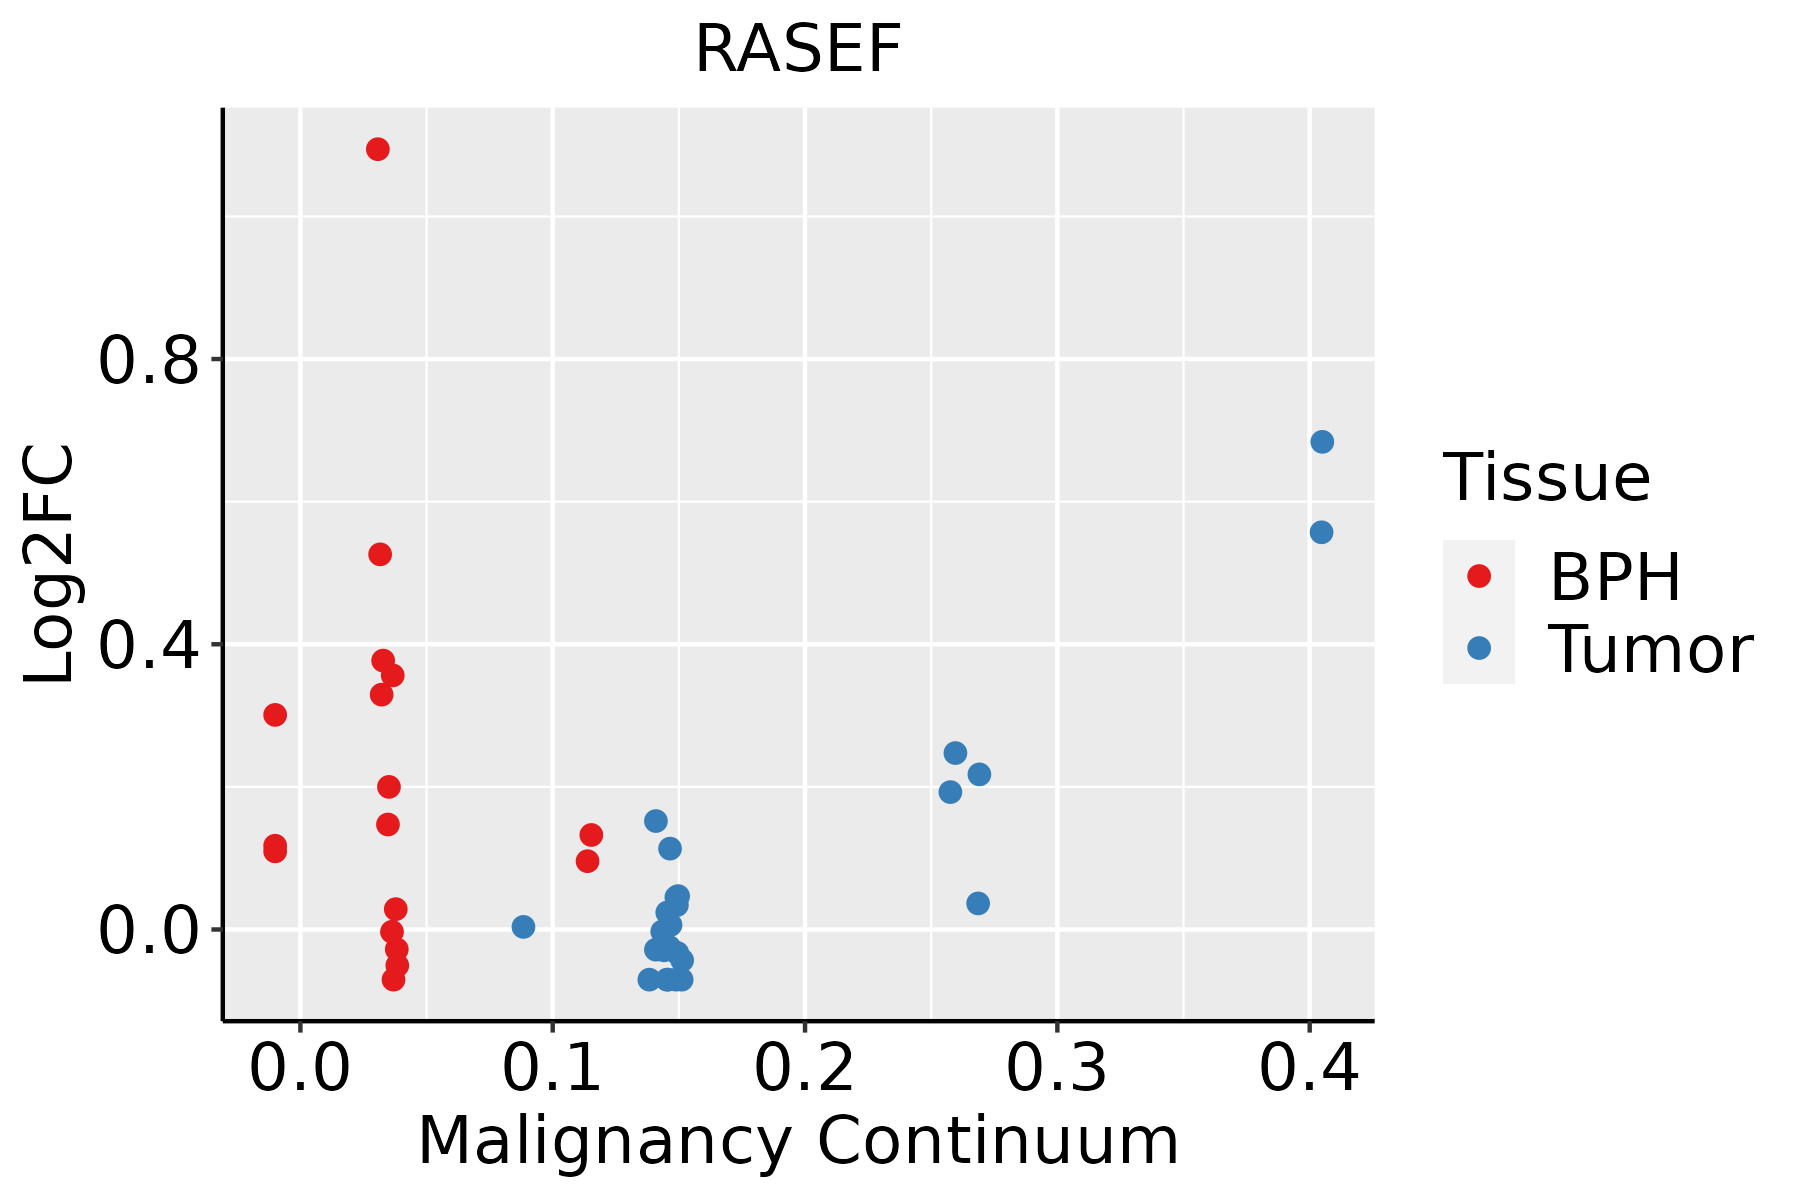 | BPH: Benign Prostatic Hyperplasia |
| Thyroid | 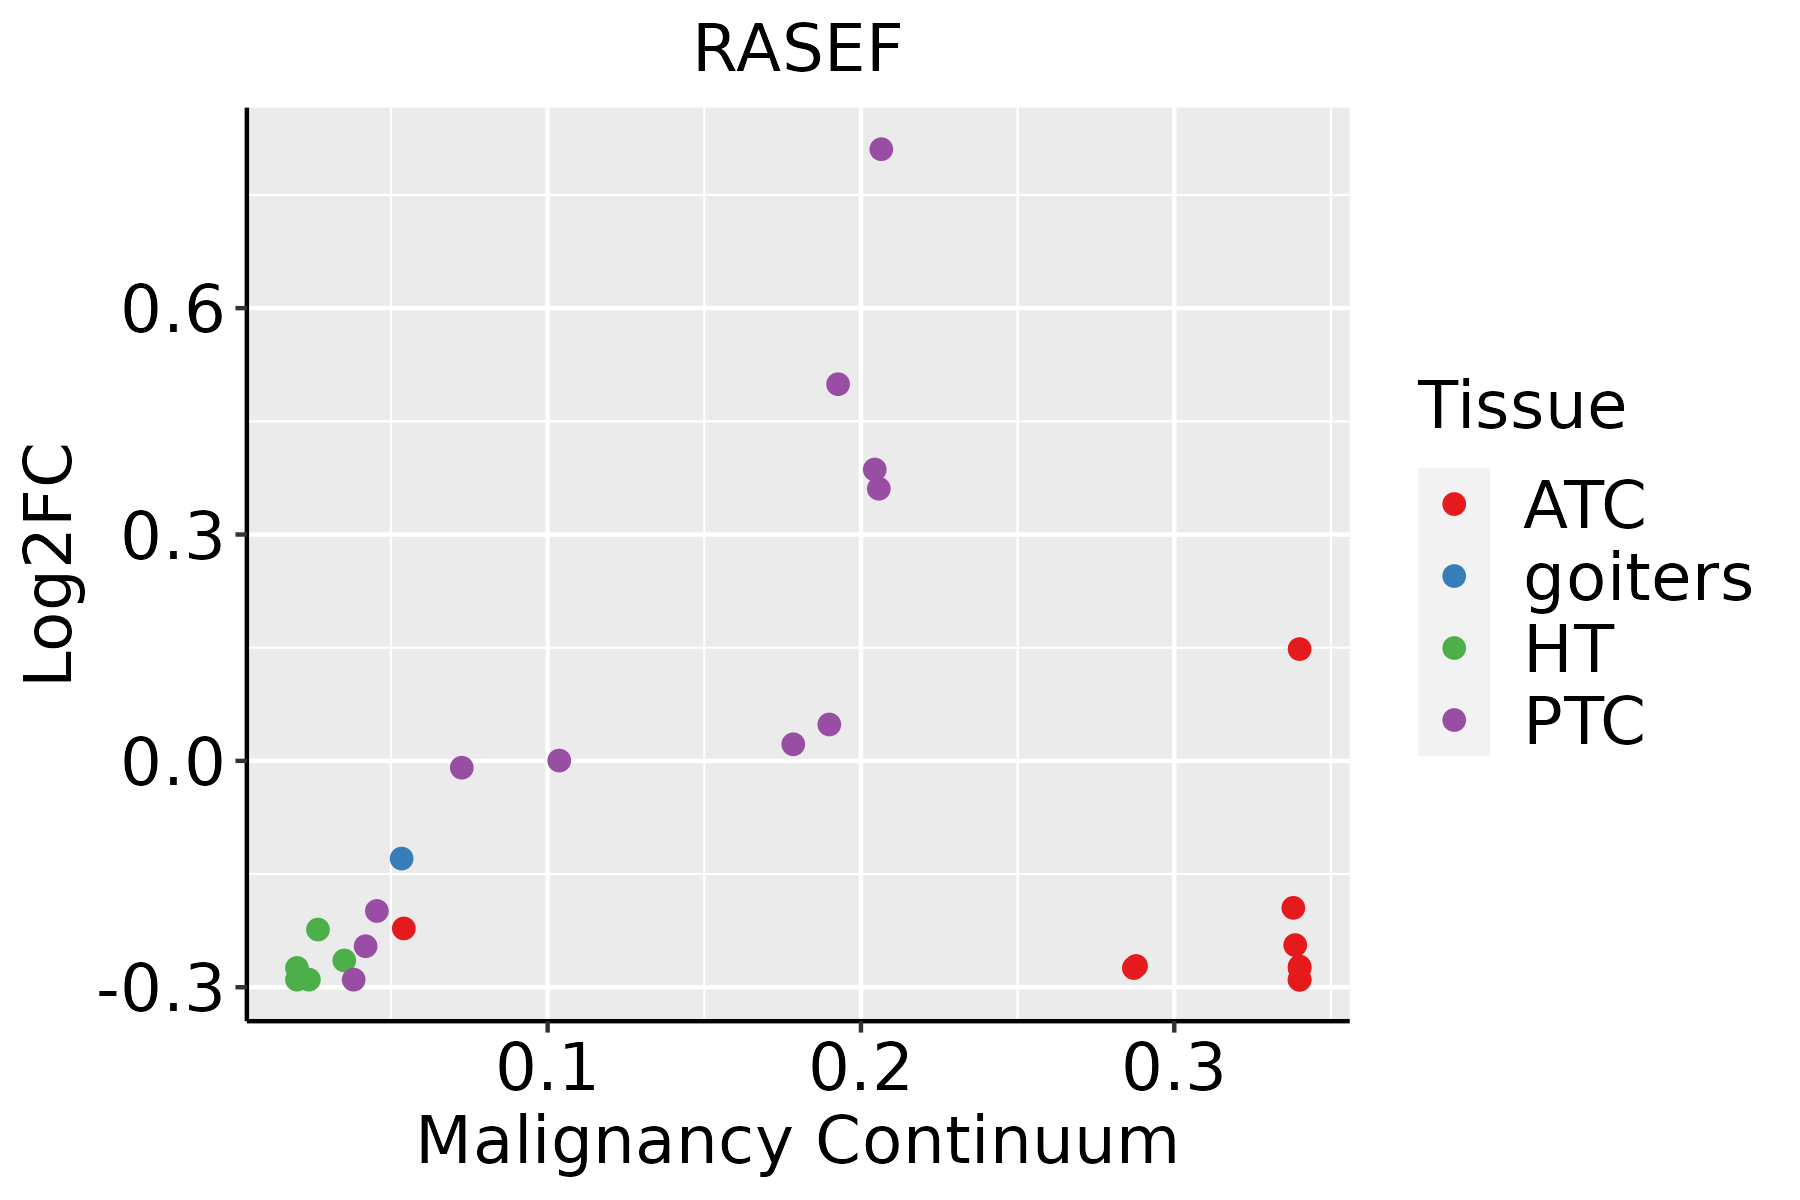 | ATC: Anaplastic thyroid cancer |
| HT: Hashimoto's thyroiditis | ||
| PTC: Papillary thyroid cancer |
| ∗log2FC in expression of this searched gene in stem-like cells from each diseased tissue sample relative to stem-like cells in normal samples in each tissue plotted against the malignancy continuum. Samples are colored based on if they are from different disease stage. |
Top |
Malignant transformation related pathway analysis |
| Find out the enriched GO biological processes and KEGG pathways involved in transition from healthy to precancer to cancer |
| Tissue | Disease Stage | Enriched GO biological Processes |
| Colorectum | AD |  |
| Colorectum | SER |  |
| Colorectum | MSS |  |
| Colorectum | MSI-H |  |
| Colorectum | FAP |  |
| ∗Top 15 enriched GO BP terms are showed in the bar plot of each disease state in each tissue. Each row represents a significant GO biological process which is colored according to the -log10(p.adjust). |
| Page: 1 2 3 4 5 6 7 8 9 |
| GO ID | Tissue | Disease Stage | Description | Gene Ratio | Bg Ratio | pvalue | p.adjust | Count |
| Page: 1 |
| Pathway ID | Tissue | Disease Stage | Description | Gene Ratio | Bg Ratio | pvalue | p.adjust | qvalue | Count |
| Page: 1 |
Top |
Cell-cell communication analysis |
| Identification of potential cell-cell interactions between two cell types and their ligand-receptor pairs for different disease states |
| Ligand | Receptor | LRpair | Pathway | Tissue | Disease Stage |
| Page: 1 |
Top |
Single-cell gene regulatory network inference analysis |
| Find out the significant the regulons (TFs) and the target genes of each regulon across cell types for different disease states |
| TF | Cell Type | Tissue | Disease Stage | Target Gene | RSS | Regulon Activity |
| ∗The dot plots of a searched regulon are shown for all cell subpopulations in each disease state of each tissue based on the regulon specific score inferred using pySCENIC and by calculating the average expression. |
| Page: 1 |
Top |
Somatic mutation of malignant transformation related genes |
| Annotation of somatic variants for genes involved in malignant transformation |
| Hugo Symbol | Variant Class | Variant Classification | dbSNP RS | HGVSc | HGVSp | HGVSp Short | SWISSPROT | BIOTYPE | SIFT | PolyPhen | Tumor Sample Barcode | Tissue | Histology | Sex | Age | Stage | Therapy Types | Drugs | Outcome |
| RASEF | SNV | Missense_Mutation | c.698G>T | p.Ser233Ile | p.S233I | Q8IZ41 | protein_coding | deleterious(0.02) | benign(0.003) | TCGA-A8-A09Z-01 | Breast | breast invasive carcinoma | Female | >=65 | I/II | Unknown | Unknown | SD | |
| RASEF | SNV | Missense_Mutation | rs769582859 | c.995N>A | p.Arg332Gln | p.R332Q | Q8IZ41 | protein_coding | deleterious(0.02) | benign(0.132) | TCGA-AN-A046-01 | Breast | breast invasive carcinoma | Female | >=65 | I/II | Unknown | Unknown | SD |
| RASEF | SNV | Missense_Mutation | novel | c.1792N>A | p.Ala598Thr | p.A598T | Q8IZ41 | protein_coding | deleterious(0) | probably_damaging(0.998) | TCGA-BH-A0B8-01 | Breast | breast invasive carcinoma | Female | <65 | I/II | Hormone Therapy | arimidex | SD |
| RASEF | SNV | Missense_Mutation | novel | c.644N>T | p.Ala215Val | p.A215V | Q8IZ41 | protein_coding | deleterious(0.03) | possibly_damaging(0.843) | TCGA-D8-A1J8-01 | Breast | breast invasive carcinoma | Female | >=65 | I/II | Hormone Therapy | nolvadex | SD |
| RASEF | SNV | Missense_Mutation | c.1689N>C | p.Lys563Asn | p.K563N | Q8IZ41 | protein_coding | deleterious(0.02) | probably_damaging(0.978) | TCGA-D8-A27G-01 | Breast | breast invasive carcinoma | Female | >=65 | I/II | Unknown | Unknown | SD | |
| RASEF | SNV | Missense_Mutation | novel | c.1876G>C | p.Glu626Gln | p.E626Q | Q8IZ41 | protein_coding | tolerated(0.06) | probably_damaging(0.929) | TCGA-D8-A73U-01 | Breast | breast invasive carcinoma | Female | >=65 | I/II | Hormone Therapy | tamoxiphen | SD |
| RASEF | SNV | Missense_Mutation | c.953C>T | p.Thr318Ile | p.T318I | Q8IZ41 | protein_coding | tolerated(0.29) | benign(0.068) | TCGA-E2-A10C-01 | Breast | breast invasive carcinoma | Female | <65 | I/II | Chemotherapy | cytoxan | SD | |
| RASEF | insertion | Nonsense_Mutation | novel | c.1942_1943insAATGAAG | p.Pro648GlnfsTer2 | p.P648Qfs*2 | Q8IZ41 | protein_coding | TCGA-A8-A09X-01 | Breast | breast invasive carcinoma | Female | <65 | III/IV | Unknown | Unknown | SD | ||
| RASEF | insertion | Frame_Shift_Ins | novel | c.1789_1790insGGGCATGTGTGTTGAGGTGTTCTCTTCC | p.Thr597ArgfsTer35 | p.T597Rfs*35 | Q8IZ41 | protein_coding | TCGA-BH-A0B8-01 | Breast | breast invasive carcinoma | Female | <65 | I/II | Hormone Therapy | arimidex | SD | ||
| RASEF | deletion | Frame_Shift_Del | novel | c.2180delA | p.Asn727IlefsTer8 | p.N727Ifs*8 | Q8IZ41 | protein_coding | TCGA-EW-A2FV-01 | Breast | breast invasive carcinoma | Female | <65 | III/IV | Chemotherapy | docetaxel | SD |
| Page: 1 2 3 4 5 6 7 8 |
Top |
Related drugs of malignant transformation related genes |
| Identification of chemicals and drugs interact with genes involved in malignant transfromation |
| (DGIdb 4.0) |
| Entrez ID | Symbol | Category | Interaction Types | Drug Claim Name | Drug Name | PMIDs |
| Page: 1 |

Copyright 2023-Present -The University of Texas Health Science Center at Houston |