
|
|||||
|
 | |
| |
| |
| |
| |
| |
|
Gene: RASD1 |
Gene summary for RASD1 |
| Gene information | Species | Human | Gene symbol | RASD1 | Gene ID | 51655 |
| Gene name | ras related dexamethasone induced 1 | |
| Gene Alias | AGS1 | |
| Cytomap | 17p11.2 | |
| Gene Type | protein-coding | GO ID | GO:0006139 | UniProtAcc | Q9Y272 |
Top |
Malignant transformation analysis |
| Identification of the aberrant gene expression in precancerous and cancerous lesions by comparing the gene expression of stem-like cells in diseased tissues with normal stem cells |
| Entrez ID | Symbol | Replicates | Species | Organ | Tissue | Adj P-value | Log2FC | Malignancy |
| 51655 | RASD1 | HSIL_HPV_2 | Human | Cervix | HSIL_HPV | 3.84e-02 | -1.54e-01 | 0.0208 |
| 51655 | RASD1 | sample1 | Human | Cervix | CC | 3.25e-04 | 4.71e-01 | 0.0959 |
| 51655 | RASD1 | H2 | Human | Cervix | HSIL_HPV | 2.04e-07 | 4.07e-01 | 0.0632 |
| 51655 | RASD1 | T1 | Human | Cervix | CC | 2.44e-11 | 5.50e-01 | 0.0918 |
| 51655 | RASD1 | T2 | Human | Cervix | CC | 3.76e-13 | 8.84e-01 | 0.0709 |
| 51655 | RASD1 | AEH-subject1 | Human | Endometrium | AEH | 1.08e-08 | 4.68e-01 | -0.3059 |
| 51655 | RASD1 | EEC-subject1 | Human | Endometrium | EEC | 8.97e-07 | -2.78e-01 | -0.2682 |
| 51655 | RASD1 | EEC-subject2 | Human | Endometrium | EEC | 8.22e-04 | -2.93e-01 | -0.2607 |
| 51655 | RASD1 | EEC-subject3 | Human | Endometrium | EEC | 1.61e-15 | -2.45e-01 | -0.2525 |
| 51655 | RASD1 | EEC-subject4 | Human | Endometrium | EEC | 6.38e-07 | 3.07e-01 | -0.2571 |
| 51655 | RASD1 | GSM5276934 | Human | Endometrium | EEC | 2.77e-24 | -5.38e-01 | -0.0913 |
| 51655 | RASD1 | GSM5276937 | Human | Endometrium | EEC | 5.22e-06 | -4.33e-01 | -0.0897 |
| 51655 | RASD1 | GSM6177620_NYU_UCEC1_lib1_lib1 | Human | Endometrium | EEC | 8.84e-11 | -1.70e-01 | -0.1869 |
| 51655 | RASD1 | GSM6177620_NYU_UCEC1_lib2_lib2 | Human | Endometrium | EEC | 1.23e-11 | -2.93e-01 | -0.1875 |
| 51655 | RASD1 | GSM6177620_NYU_UCEC1_lib3_lib3 | Human | Endometrium | EEC | 1.86e-10 | -2.34e-01 | -0.1883 |
| 51655 | RASD1 | GSM6177621_NYU_UCEC2_lib1_lib1 | Human | Endometrium | EEC | 9.84e-11 | -2.38e-02 | -0.1934 |
| 51655 | RASD1 | GSM6177622_NYU_UCEC3_lib1_lib1 | Human | Endometrium | EEC | 8.57e-27 | -4.12e-01 | -0.1917 |
| 51655 | RASD1 | GSM6177622_NYU_UCEC3_lib2_lib2 | Human | Endometrium | EEC | 2.11e-22 | -4.12e-01 | -0.1916 |
| 51655 | RASD1 | GSM6177623_NYU_UCEC3_Vis | Human | Endometrium | EEC | 6.06e-08 | -3.99e-01 | -0.1269 |
| 51655 | RASD1 | LZE4T | Human | Esophagus | ESCC | 1.91e-03 | 8.58e-01 | 0.0811 |
| Page: 1 2 3 4 5 6 |
| Tissue | Expression Dynamics | Abbreviation |
| Cervix | 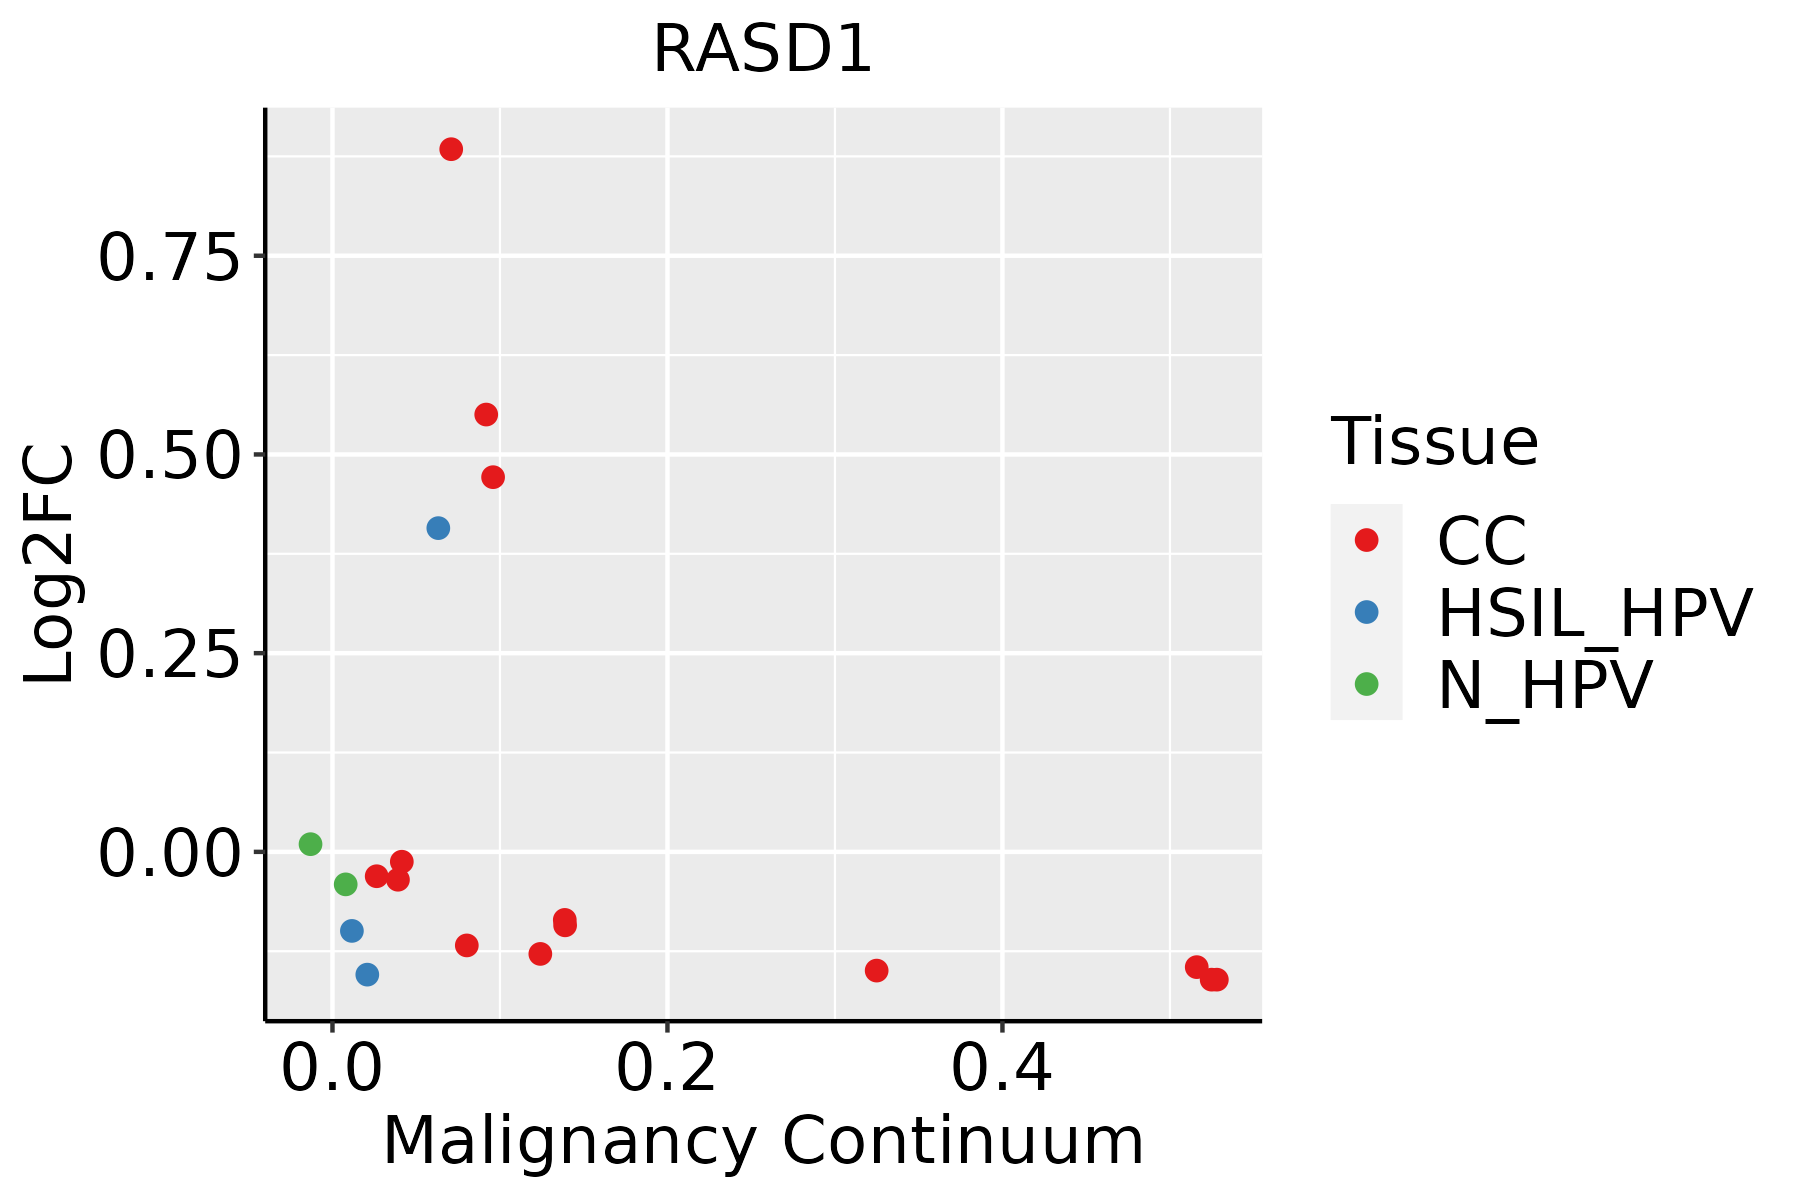 | CC: Cervix cancer |
| HSIL_HPV: HPV-infected high-grade squamous intraepithelial lesions | ||
| N_HPV: HPV-infected normal cervix | ||
| Endometrium |  | AEH: Atypical endometrial hyperplasia |
| EEC: Endometrioid Cancer | ||
| Esophagus |  | ESCC: Esophageal squamous cell carcinoma |
| HGIN: High-grade intraepithelial neoplasias | ||
| LGIN: Low-grade intraepithelial neoplasias | ||
| Liver |  | HCC: Hepatocellular carcinoma |
| NAFLD: Non-alcoholic fatty liver disease | ||
| Lung |  | AAH: Atypical adenomatous hyperplasia |
| AIS: Adenocarcinoma in situ | ||
| IAC: Invasive lung adenocarcinoma | ||
| MIA: Minimally invasive adenocarcinoma | ||
| Oral Cavity | 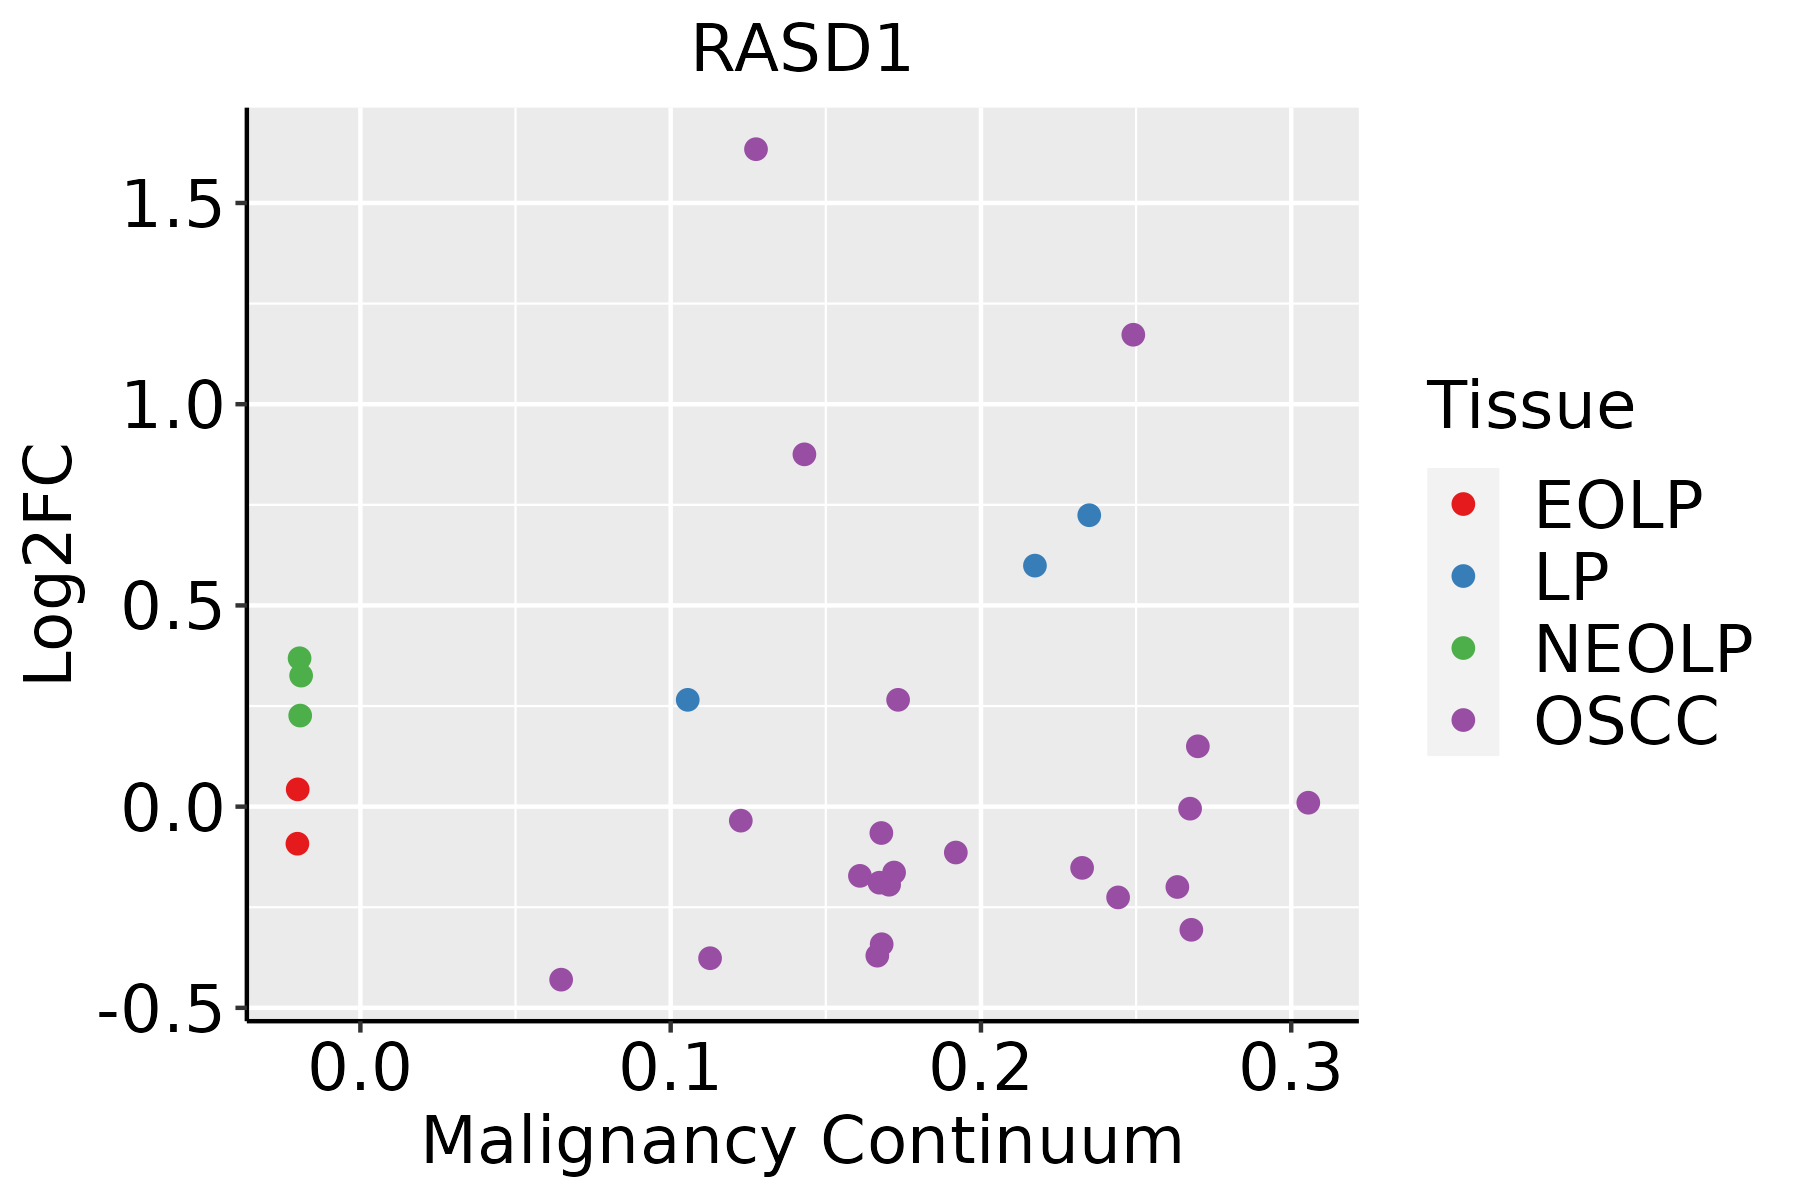 | EOLP: Erosive Oral lichen planus |
| LP: leukoplakia | ||
| NEOLP: Non-erosive oral lichen planus | ||
| OSCC: Oral squamous cell carcinoma | ||
| Prostate | 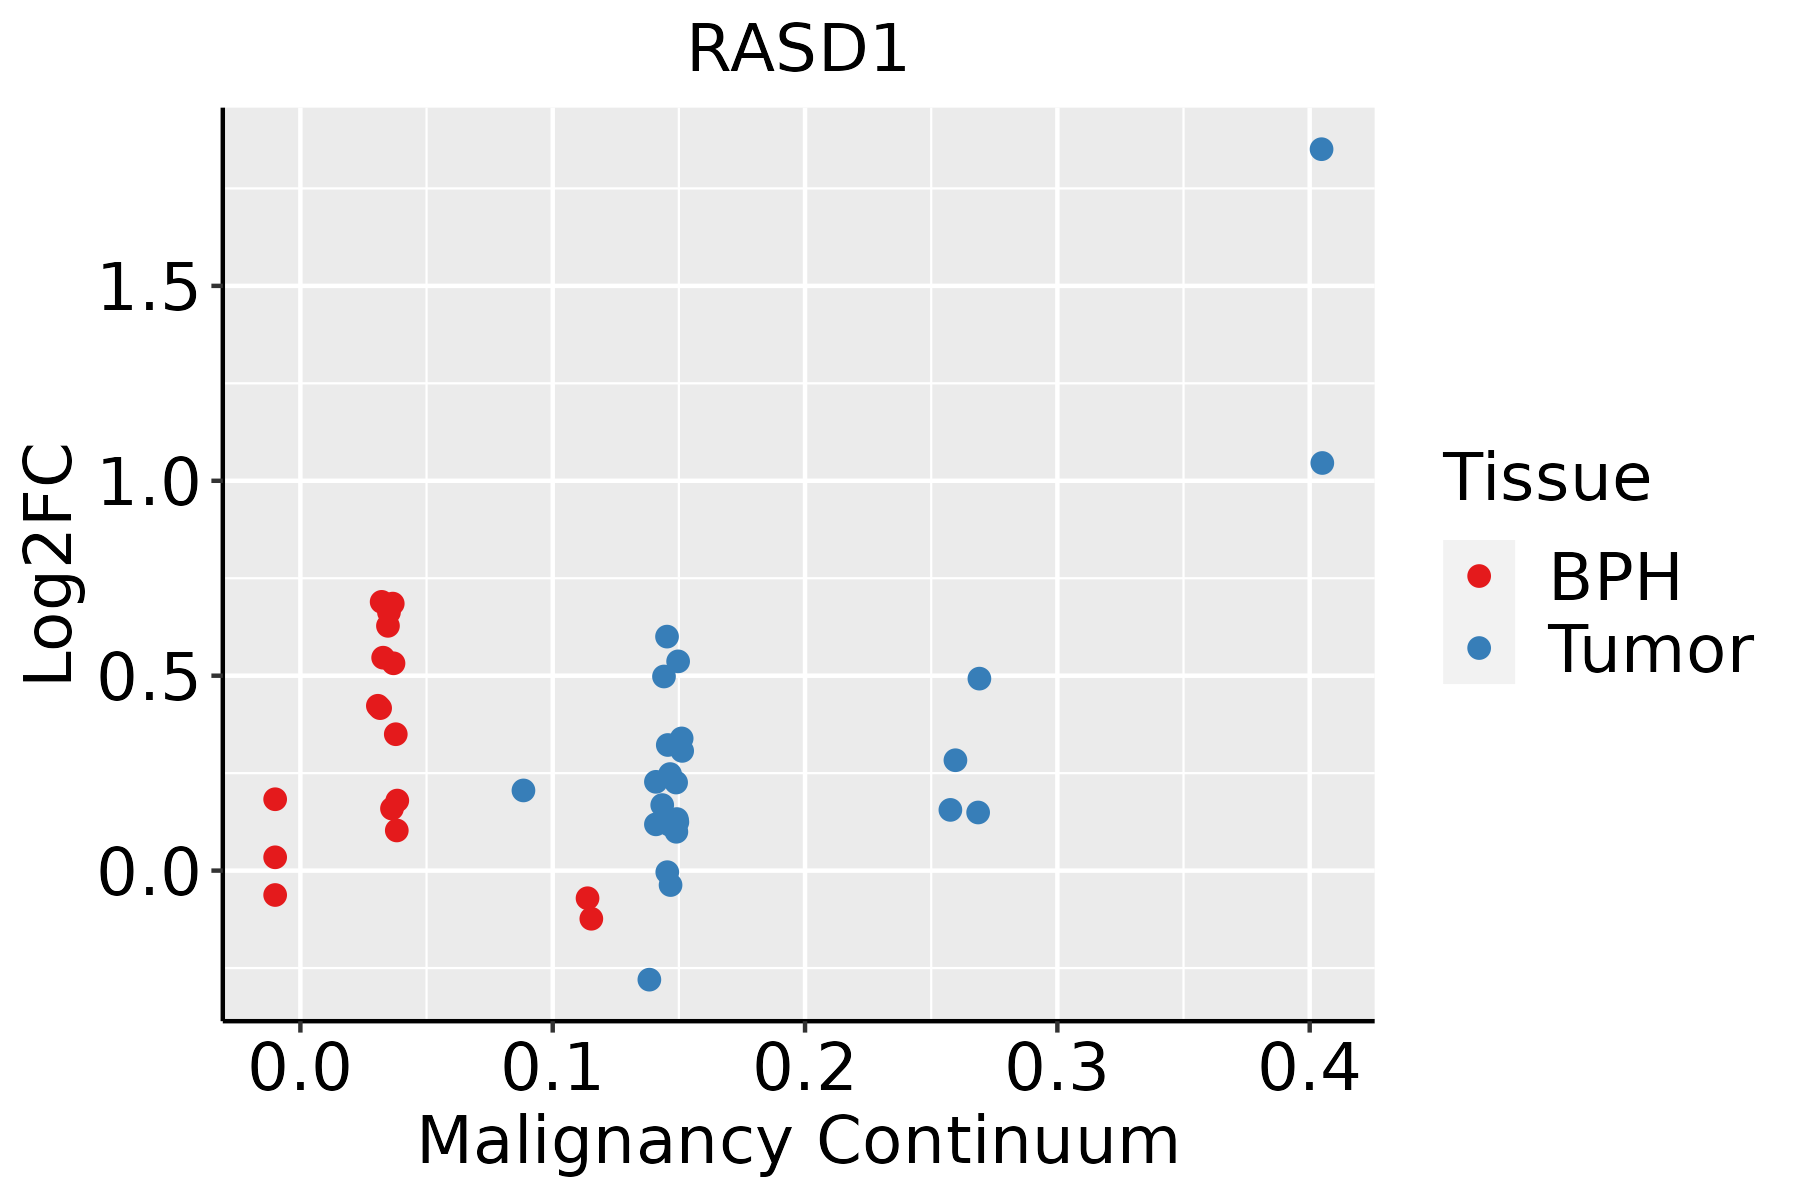 | BPH: Benign Prostatic Hyperplasia |
| Thyroid | 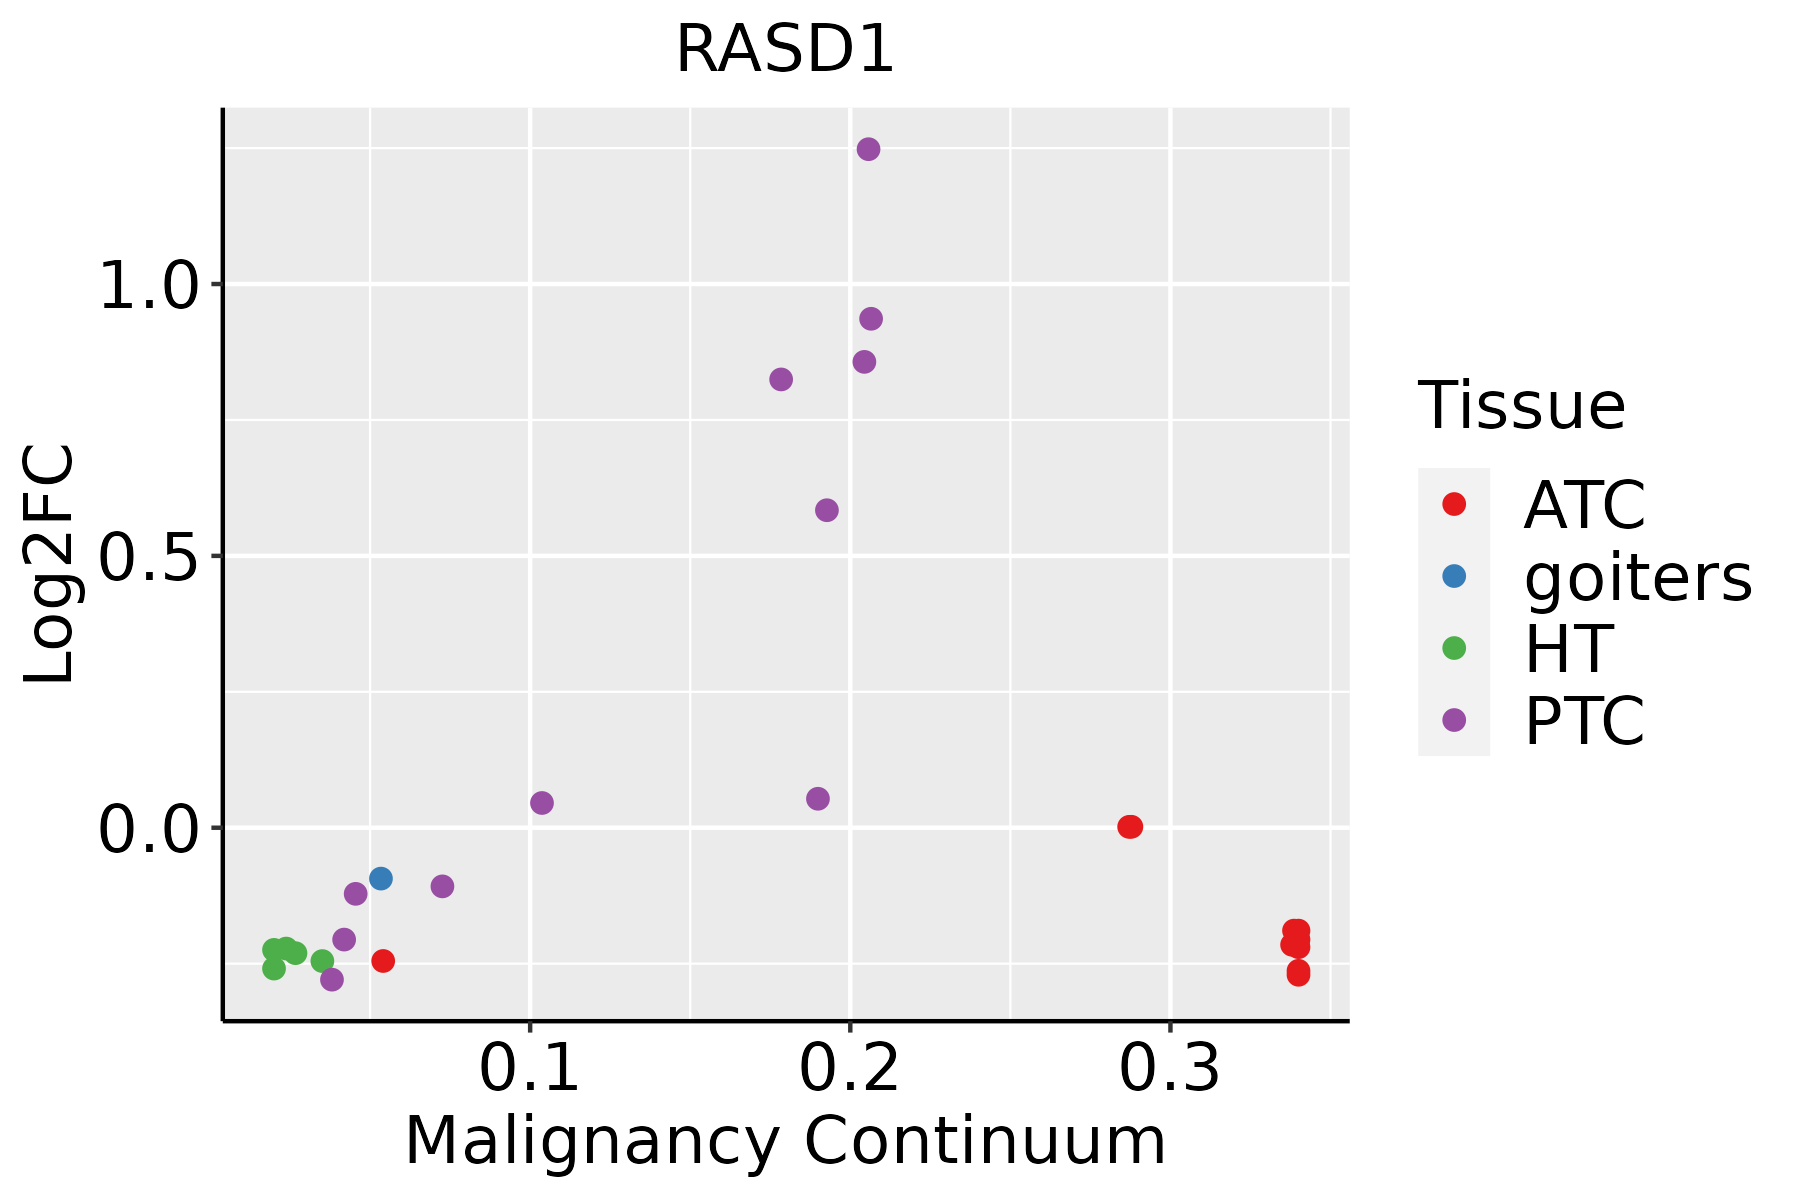 | ATC: Anaplastic thyroid cancer |
| HT: Hashimoto's thyroiditis | ||
| PTC: Papillary thyroid cancer |
| ∗log2FC in expression of this searched gene in stem-like cells from each diseased tissue sample relative to stem-like cells in normal samples in each tissue plotted against the malignancy continuum. Samples are colored based on if they are from different disease stage. |
Top |
Malignant transformation related pathway analysis |
| Find out the enriched GO biological processes and KEGG pathways involved in transition from healthy to precancer to cancer |
| Tissue | Disease Stage | Enriched GO biological Processes |
| Colorectum | AD |  |
| Colorectum | SER |  |
| Colorectum | MSS |  |
| Colorectum | MSI-H |  |
| Colorectum | FAP |  |
| ∗Top 15 enriched GO BP terms are showed in the bar plot of each disease state in each tissue. Each row represents a significant GO biological process which is colored according to the -log10(p.adjust). |
| Page: 1 2 3 4 5 6 7 8 9 |
| GO ID | Tissue | Disease Stage | Description | Gene Ratio | Bg Ratio | pvalue | p.adjust | Count |
| GO:00199321 | Lung | MIAC | second-messenger-mediated signaling | 30/967 | 312/18723 | 8.15e-04 | 1.80e-02 | 30 |
| Page: 1 |
| Pathway ID | Tissue | Disease Stage | Description | Gene Ratio | Bg Ratio | pvalue | p.adjust | qvalue | Count |
| Page: 1 |
Top |
Cell-cell communication analysis |
| Identification of potential cell-cell interactions between two cell types and their ligand-receptor pairs for different disease states |
| Ligand | Receptor | LRpair | Pathway | Tissue | Disease Stage |
| Page: 1 |
Top |
Single-cell gene regulatory network inference analysis |
| Find out the significant the regulons (TFs) and the target genes of each regulon across cell types for different disease states |
| TF | Cell Type | Tissue | Disease Stage | Target Gene | RSS | Regulon Activity |
| ∗The dot plots of a searched regulon are shown for all cell subpopulations in each disease state of each tissue based on the regulon specific score inferred using pySCENIC and by calculating the average expression. |
| Page: 1 |
Top |
Somatic mutation of malignant transformation related genes |
| Annotation of somatic variants for genes involved in malignant transformation |
| Hugo Symbol | Variant Class | Variant Classification | dbSNP RS | HGVSc | HGVSp | HGVSp Short | SWISSPROT | BIOTYPE | SIFT | PolyPhen | Tumor Sample Barcode | Tissue | Histology | Sex | Age | Stage | Therapy Types | Drugs | Outcome |
| RASD1 | SNV | Missense_Mutation | c.475N>A | p.Glu159Lys | p.E159K | Q9Y272 | protein_coding | deleterious(0) | possibly_damaging(0.804) | TCGA-AC-A23H-01 | Breast | breast invasive carcinoma | Female | >=65 | I/II | Unknown | Unknown | PD | |
| RASD1 | SNV | Missense_Mutation | novel | c.654N>A | p.His218Gln | p.H218Q | Q9Y272 | protein_coding | tolerated(0.24) | benign(0.005) | TCGA-BH-A1EU-01 | Breast | breast invasive carcinoma | Female | >=65 | I/II | Unknown | Unknown | SD |
| RASD1 | SNV | Missense_Mutation | c.44C>G | p.Ser15Trp | p.S15W | Q9Y272 | protein_coding | deleterious(0.03) | possibly_damaging(0.648) | TCGA-EK-A2R8-01 | Cervix | cervical & endocervical cancer | Female | <65 | I/II | Unknown | Unknown | SD | |
| RASD1 | insertion | Frame_Shift_Ins | novel | c.804_805insTG | p.Gly269TrpfsTer64 | p.G269Wfs*64 | Q9Y272 | protein_coding | TCGA-DS-A1OC-01 | Cervix | cervical & endocervical cancer | Female | <65 | I/II | Chemotherapy | gemcitabine | SD | ||
| RASD1 | insertion | Frame_Shift_Ins | novel | c.803_804insGGTGCAGGTCTGGGCTCATCTCG | p.Gly269ValfsTer71 | p.G269Vfs*71 | Q9Y272 | protein_coding | TCGA-DS-A1OC-01 | Cervix | cervical & endocervical cancer | Female | <65 | I/II | Chemotherapy | gemcitabine | SD | ||
| RASD1 | SNV | Missense_Mutation | c.66N>T | p.Lys22Asn | p.K22N | Q9Y272 | protein_coding | deleterious(0.01) | possibly_damaging(0.71) | TCGA-AA-3984-01 | Colorectum | colon adenocarcinoma | Female | <65 | I/II | Unknown | Unknown | SD | |
| RASD1 | SNV | Missense_Mutation | c.446N>A | p.Arg149His | p.R149H | Q9Y272 | protein_coding | tolerated(0.21) | benign(0.052) | TCGA-AZ-4315-01 | Colorectum | colon adenocarcinoma | Male | <65 | I/II | Unknown | Unknown | SD | |
| RASD1 | SNV | Missense_Mutation | novel | c.548N>A | p.Ser183Asn | p.S183N | Q9Y272 | protein_coding | tolerated(1) | benign(0.001) | TCGA-EI-6917-01 | Colorectum | rectum adenocarcinoma | Male | <65 | III/IV | Chemotherapy | 5fluorouracil+oxaciplatina+l-folinian | SD |
| RASD1 | SNV | Missense_Mutation | novel | c.193N>C | p.Tyr65His | p.Y65H | Q9Y272 | protein_coding | deleterious(0) | probably_damaging(0.987) | TCGA-EI-6917-01 | Colorectum | rectum adenocarcinoma | Male | <65 | III/IV | Chemotherapy | 5fluorouracil+oxaciplatina+l-folinian | SD |
| RASD1 | SNV | Missense_Mutation | novel | c.515N>T | p.Ala172Val | p.A172V | Q9Y272 | protein_coding | tolerated(0.3) | benign(0.091) | TCGA-AP-A1DK-01 | Endometrium | uterine corpus endometrioid carcinoma | Female | <65 | I/II | Unknown | Unknown | SD |
| Page: 1 2 3 |
Top |
Related drugs of malignant transformation related genes |
| Identification of chemicals and drugs interact with genes involved in malignant transfromation |
| (DGIdb 4.0) |
| Entrez ID | Symbol | Category | Interaction Types | Drug Claim Name | Drug Name | PMIDs |
| Page: 1 |

Copyright 2023-Present -The University of Texas Health Science Center at Houston |