
|
|||||
|
 | |
| |
| |
| |
| |
| |
|
Gene: RASAL2 |
Gene summary for RASAL2 |
| Gene information | Species | Human | Gene symbol | RASAL2 | Gene ID | 9462 |
| Gene name | RAS protein activator like 2 | |
| Gene Alias | NGAP | |
| Cytomap | 1q25.2 | |
| Gene Type | protein-coding | GO ID | GO:0007154 | UniProtAcc | A8K2P3 |
Top |
Malignant transformation analysis |
| Identification of the aberrant gene expression in precancerous and cancerous lesions by comparing the gene expression of stem-like cells in diseased tissues with normal stem cells |
| Entrez ID | Symbol | Replicates | Species | Organ | Tissue | Adj P-value | Log2FC | Malignancy |
| 9462 | RASAL2 | CCI_1 | Human | Cervix | CC | 5.65e-11 | 1.99e+00 | 0.528 |
| 9462 | RASAL2 | CCI_2 | Human | Cervix | CC | 7.83e-15 | 1.18e+00 | 0.5249 |
| 9462 | RASAL2 | CCI_3 | Human | Cervix | CC | 1.77e-13 | 1.07e+00 | 0.516 |
| 9462 | RASAL2 | HTA11_3410_2000001011 | Human | Colorectum | AD | 4.10e-05 | -2.87e-01 | 0.0155 |
| 9462 | RASAL2 | HTA11_1391_2000001011 | Human | Colorectum | AD | 2.24e-02 | 4.65e-01 | -0.059 |
| 9462 | RASAL2 | HTA11_99999965062_69753 | Human | Colorectum | MSI-H | 5.21e-03 | 9.00e-01 | 0.3487 |
| 9462 | RASAL2 | HTA11_99999965104_69814 | Human | Colorectum | MSS | 7.04e-05 | 6.76e-01 | 0.281 |
| 9462 | RASAL2 | HTA11_99999974143_84620 | Human | Colorectum | MSS | 2.32e-09 | -4.47e-01 | 0.3005 |
| 9462 | RASAL2 | A002-C-010 | Human | Colorectum | FAP | 5.17e-03 | 3.11e-01 | 0.242 |
| 9462 | RASAL2 | A015-C-203 | Human | Colorectum | FAP | 2.92e-21 | -4.04e-01 | -0.1294 |
| 9462 | RASAL2 | A015-C-204 | Human | Colorectum | FAP | 4.58e-05 | -3.42e-01 | -0.0228 |
| 9462 | RASAL2 | A014-C-040 | Human | Colorectum | FAP | 1.10e-02 | -3.83e-01 | -0.1184 |
| 9462 | RASAL2 | A002-C-201 | Human | Colorectum | FAP | 7.54e-09 | -5.88e-02 | 0.0324 |
| 9462 | RASAL2 | A002-C-203 | Human | Colorectum | FAP | 4.56e-03 | 2.17e-01 | 0.2786 |
| 9462 | RASAL2 | A001-C-119 | Human | Colorectum | FAP | 4.35e-05 | -3.67e-01 | -0.1557 |
| 9462 | RASAL2 | A001-C-108 | Human | Colorectum | FAP | 2.66e-10 | -2.56e-01 | -0.0272 |
| 9462 | RASAL2 | A002-C-205 | Human | Colorectum | FAP | 2.44e-18 | -3.52e-01 | -0.1236 |
| 9462 | RASAL2 | A001-C-104 | Human | Colorectum | FAP | 3.74e-02 | -1.74e-01 | 0.0184 |
| 9462 | RASAL2 | A015-C-006 | Human | Colorectum | FAP | 3.82e-14 | -5.32e-01 | -0.0994 |
| 9462 | RASAL2 | A015-C-106 | Human | Colorectum | FAP | 1.93e-14 | -4.21e-01 | -0.0511 |
| Page: 1 2 3 4 5 6 7 8 |
| Tissue | Expression Dynamics | Abbreviation |
| Cervix |  | CC: Cervix cancer |
| HSIL_HPV: HPV-infected high-grade squamous intraepithelial lesions | ||
| N_HPV: HPV-infected normal cervix | ||
| Colorectum (GSE201348) |  | FAP: Familial adenomatous polyposis |
| CRC: Colorectal cancer | ||
| Colorectum (HTA11) |  | AD: Adenomas |
| SER: Sessile serrated lesions | ||
| MSI-H: Microsatellite-high colorectal cancer | ||
| MSS: Microsatellite stable colorectal cancer | ||
| Endometrium | 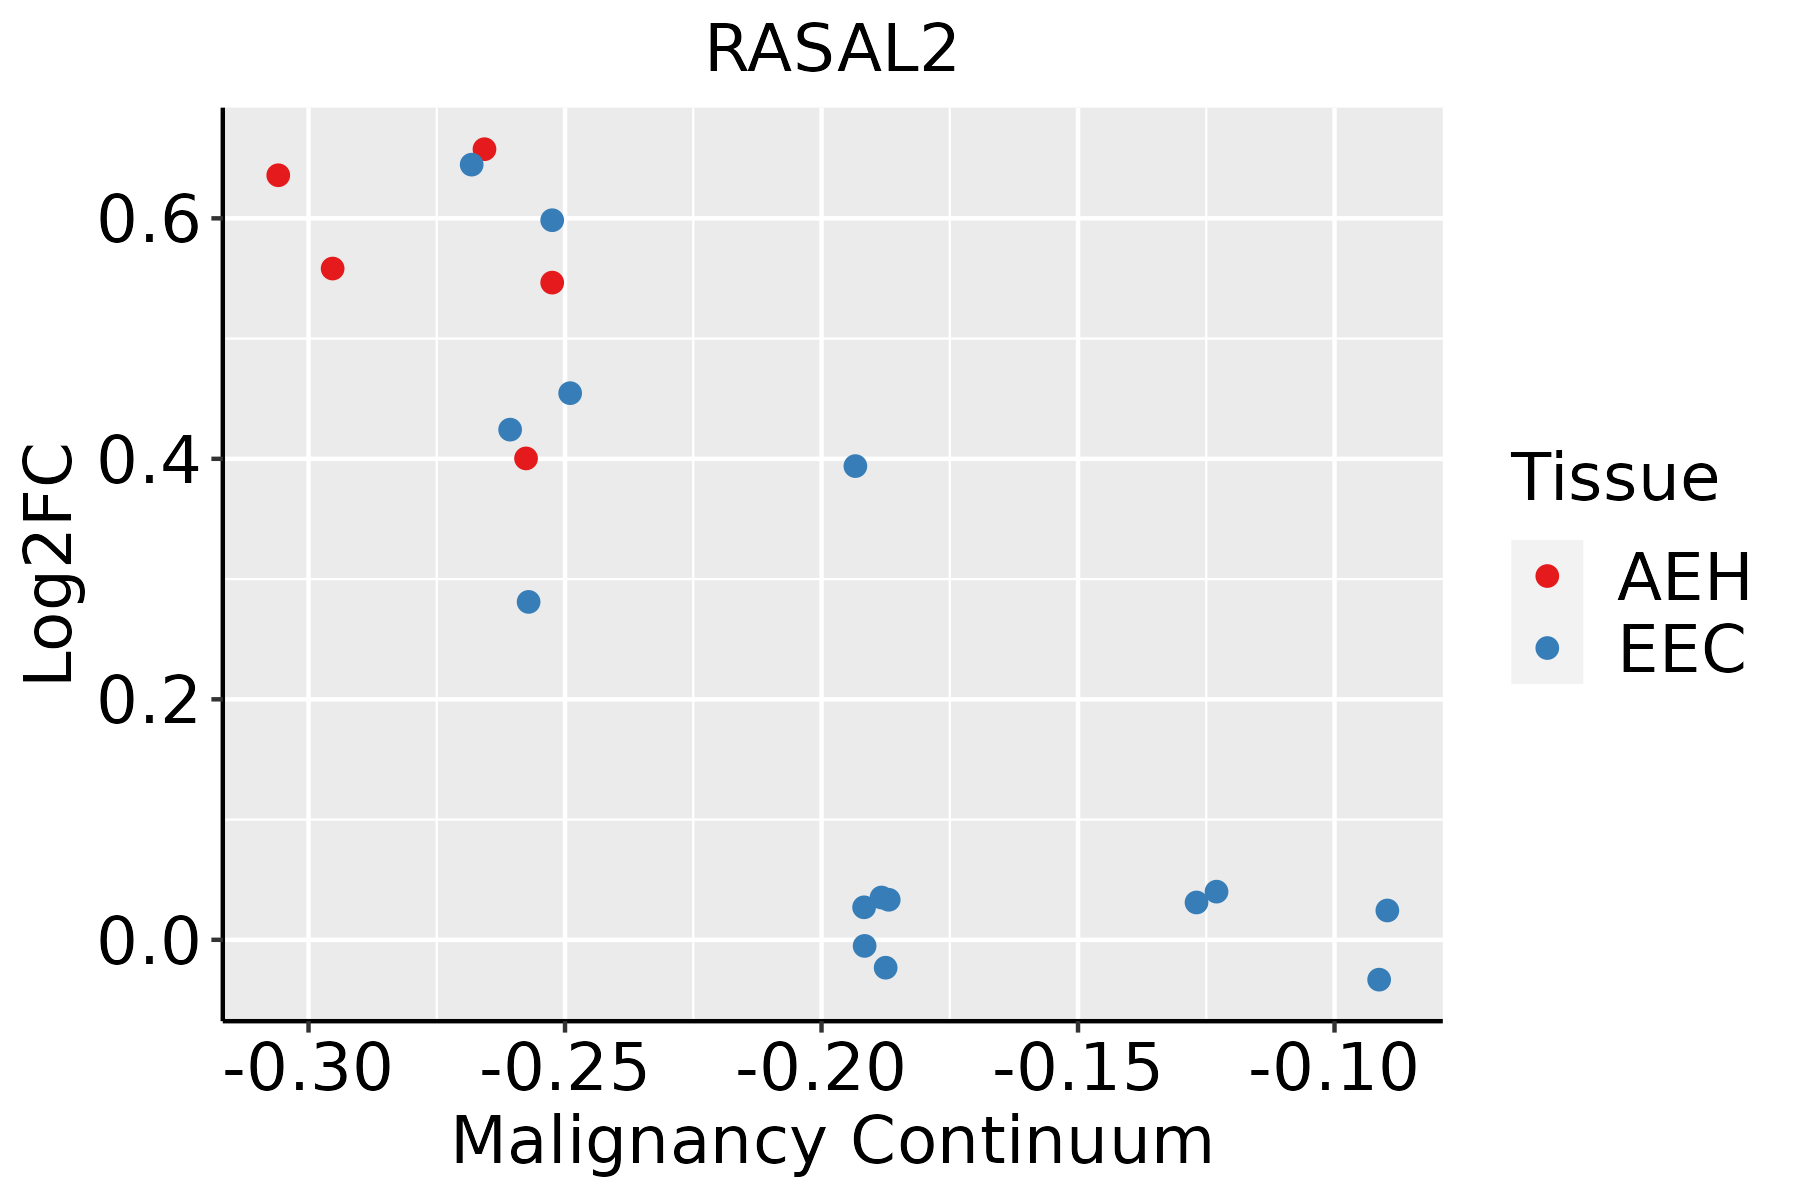 | AEH: Atypical endometrial hyperplasia |
| EEC: Endometrioid Cancer | ||
| Esophagus | 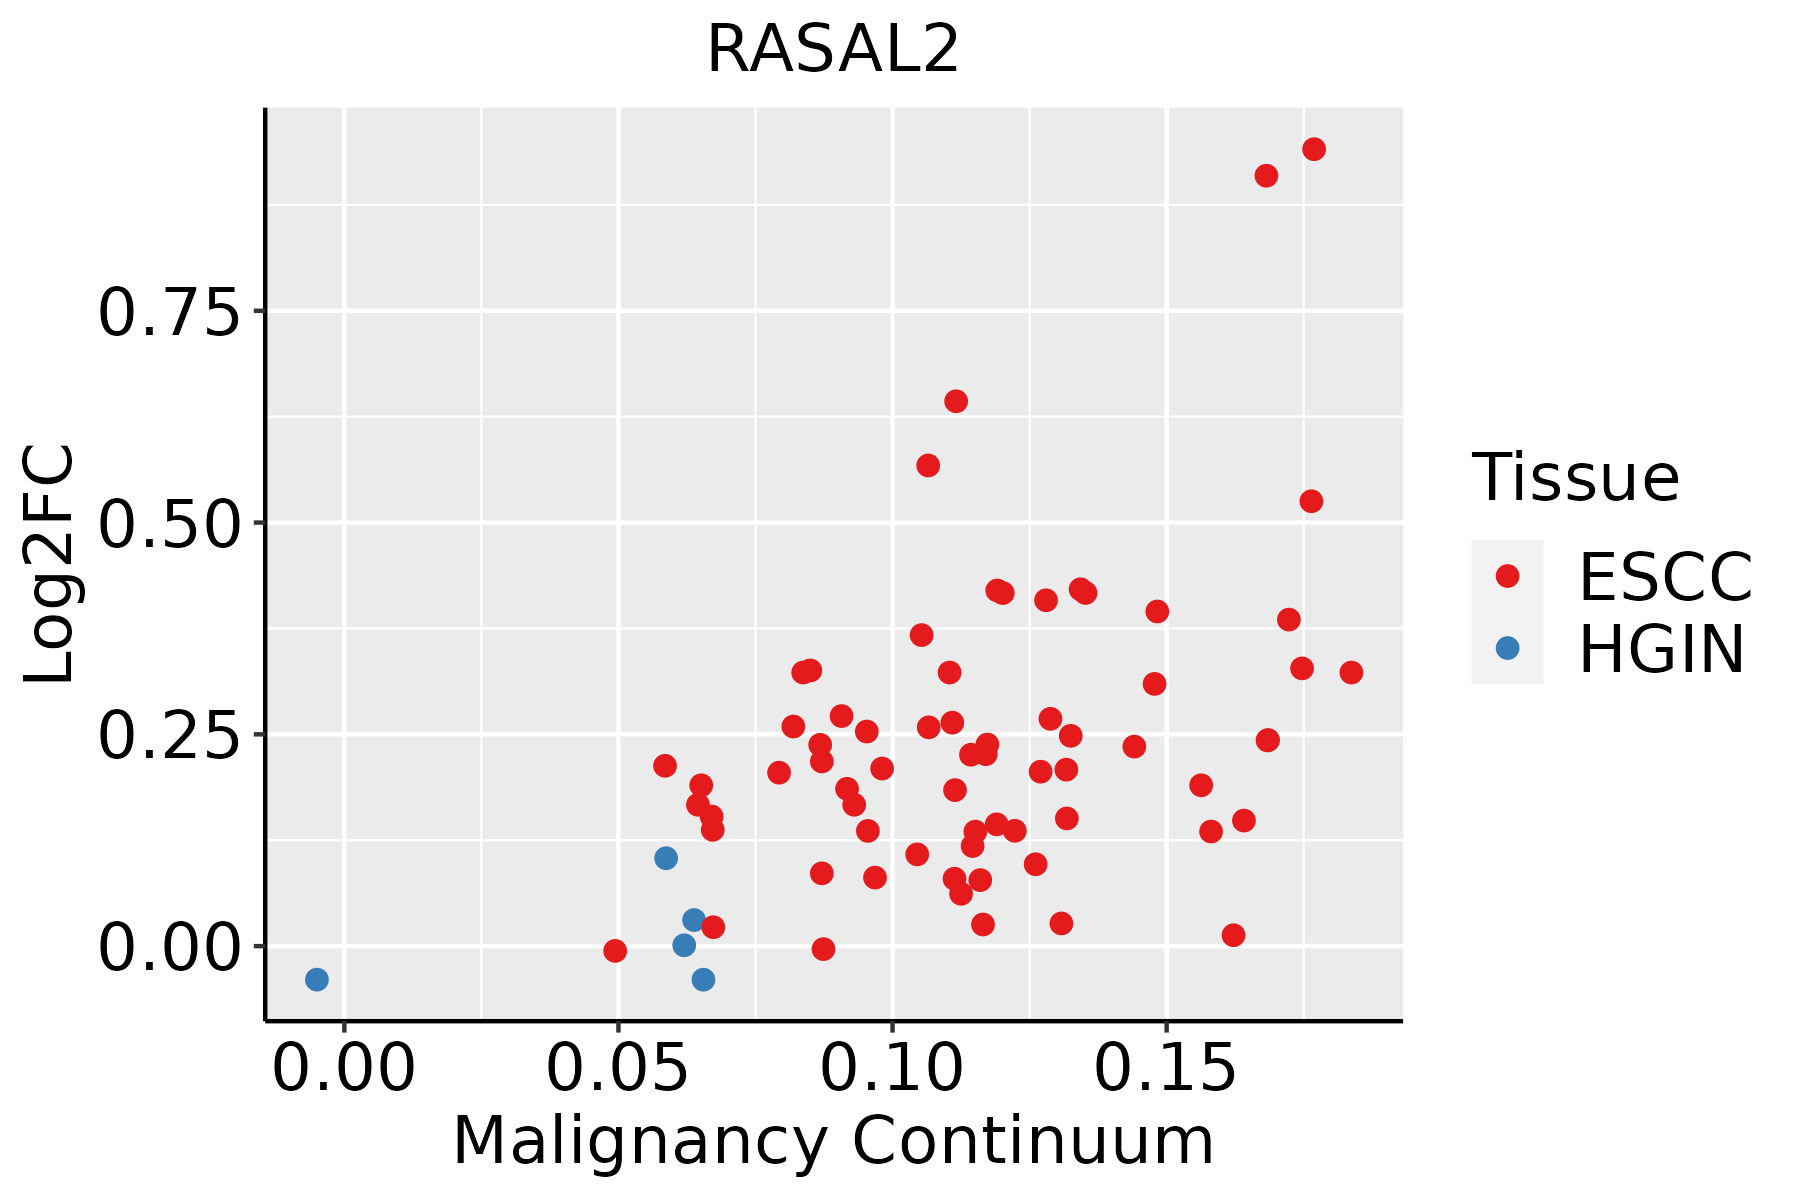 | ESCC: Esophageal squamous cell carcinoma |
| HGIN: High-grade intraepithelial neoplasias | ||
| LGIN: Low-grade intraepithelial neoplasias | ||
| Liver | 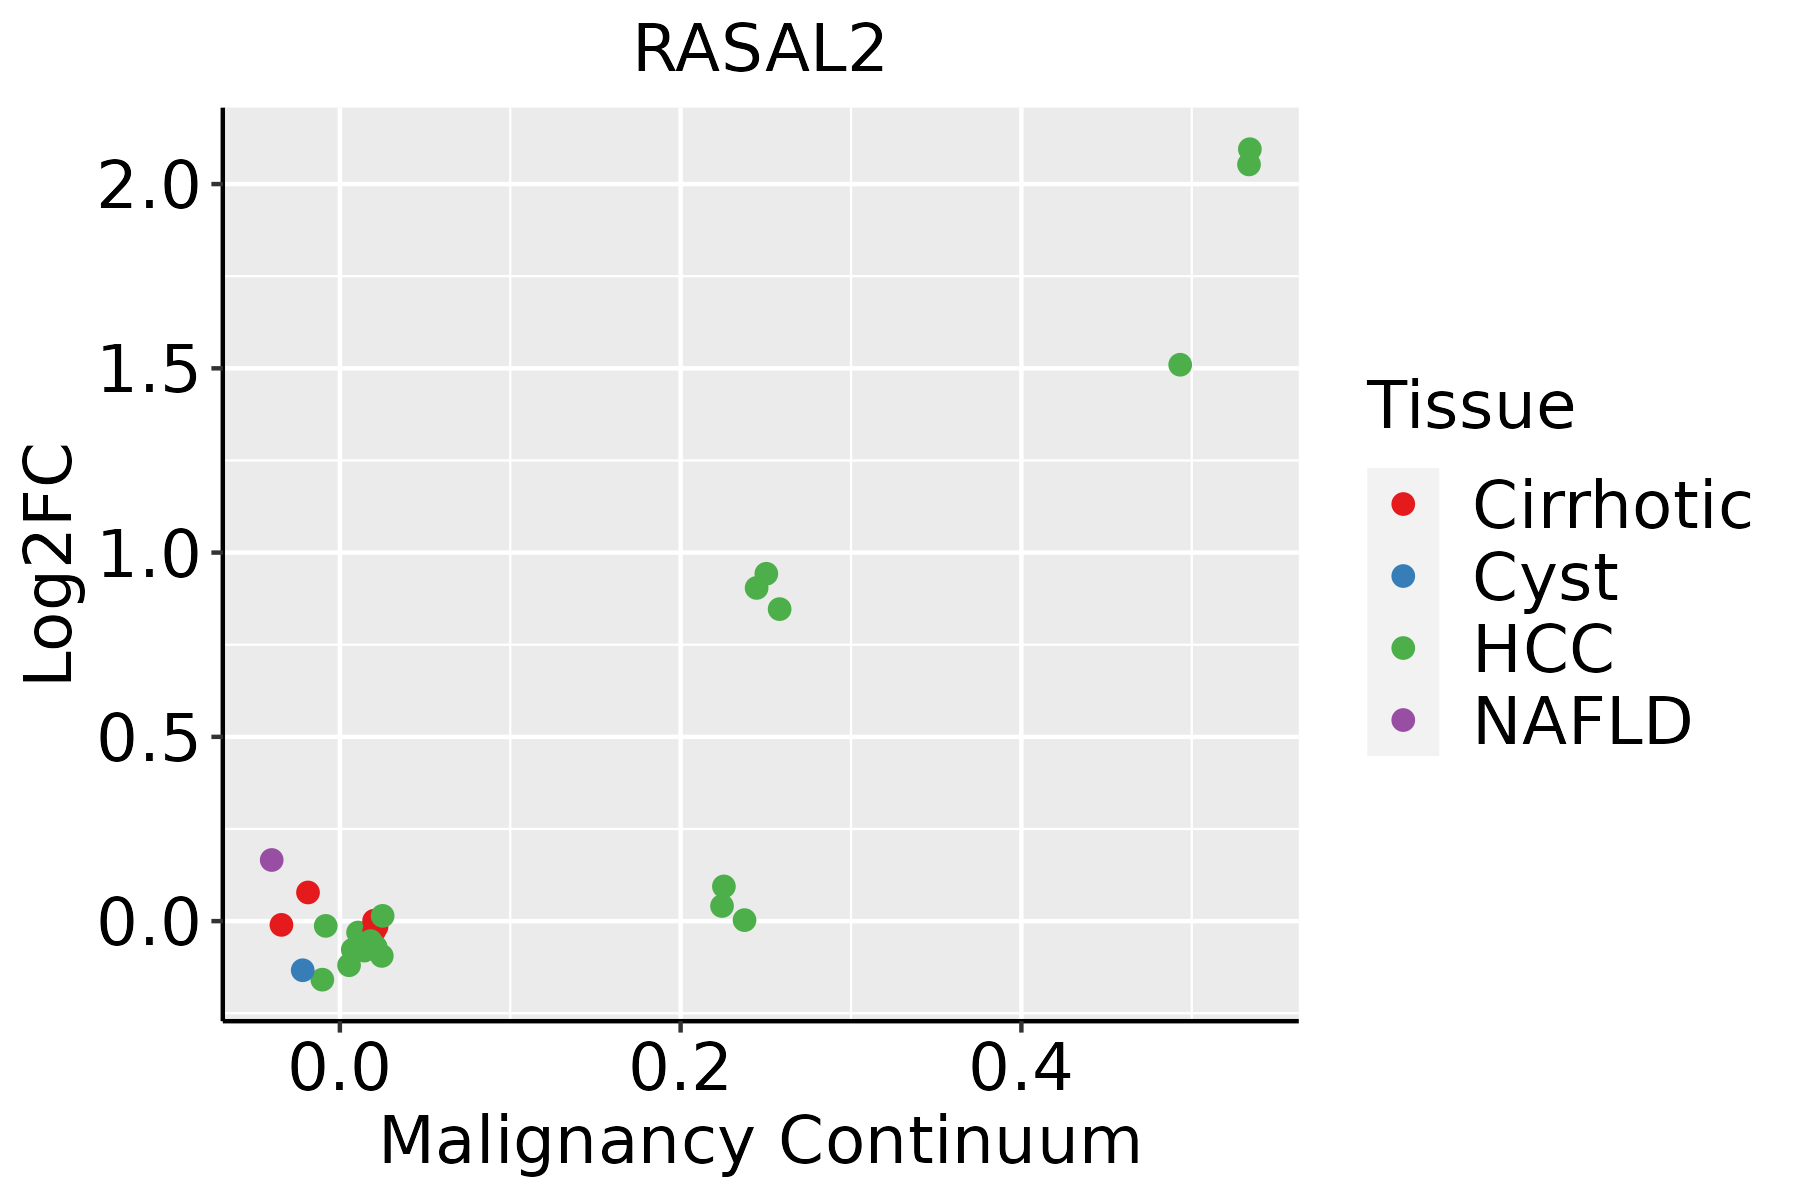 | HCC: Hepatocellular carcinoma |
| NAFLD: Non-alcoholic fatty liver disease | ||
| Lung | 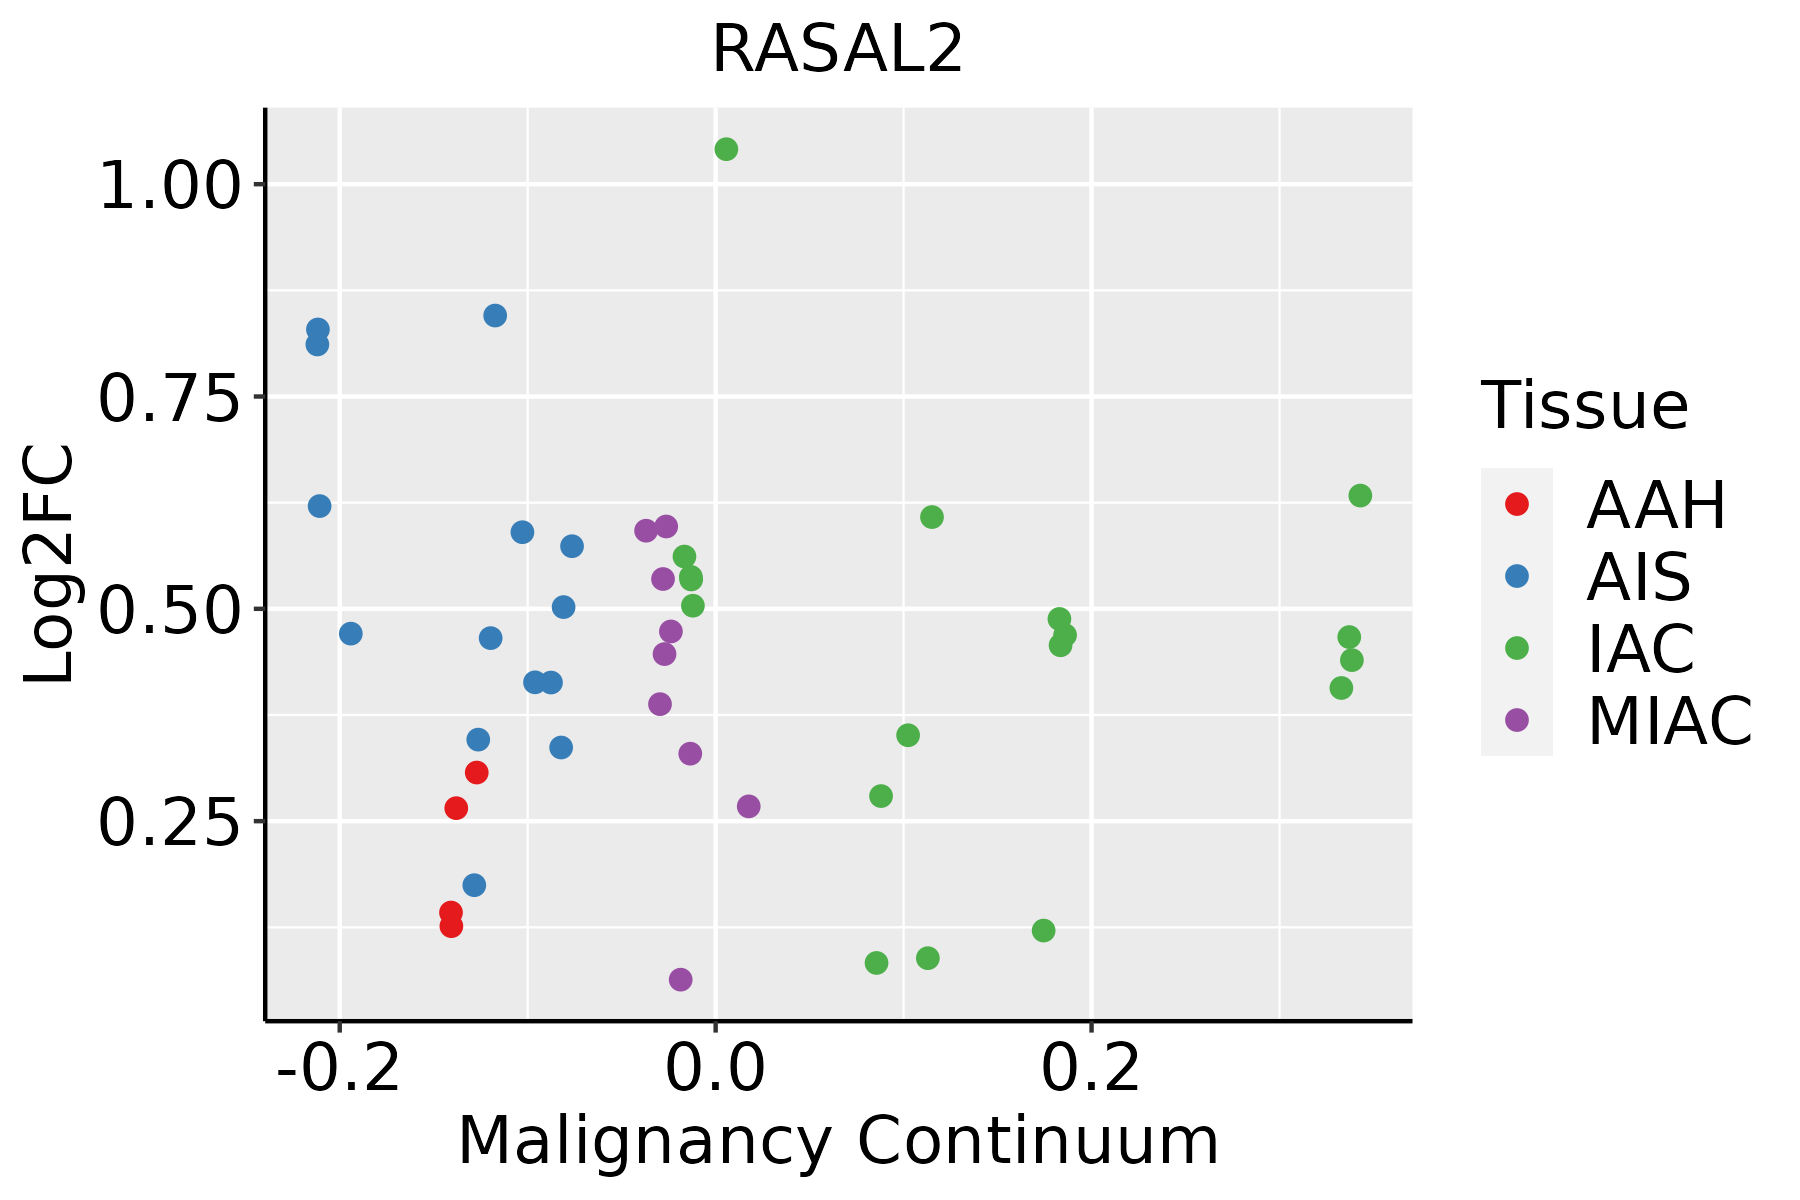 | AAH: Atypical adenomatous hyperplasia |
| AIS: Adenocarcinoma in situ | ||
| IAC: Invasive lung adenocarcinoma | ||
| MIA: Minimally invasive adenocarcinoma | ||
| Prostate | 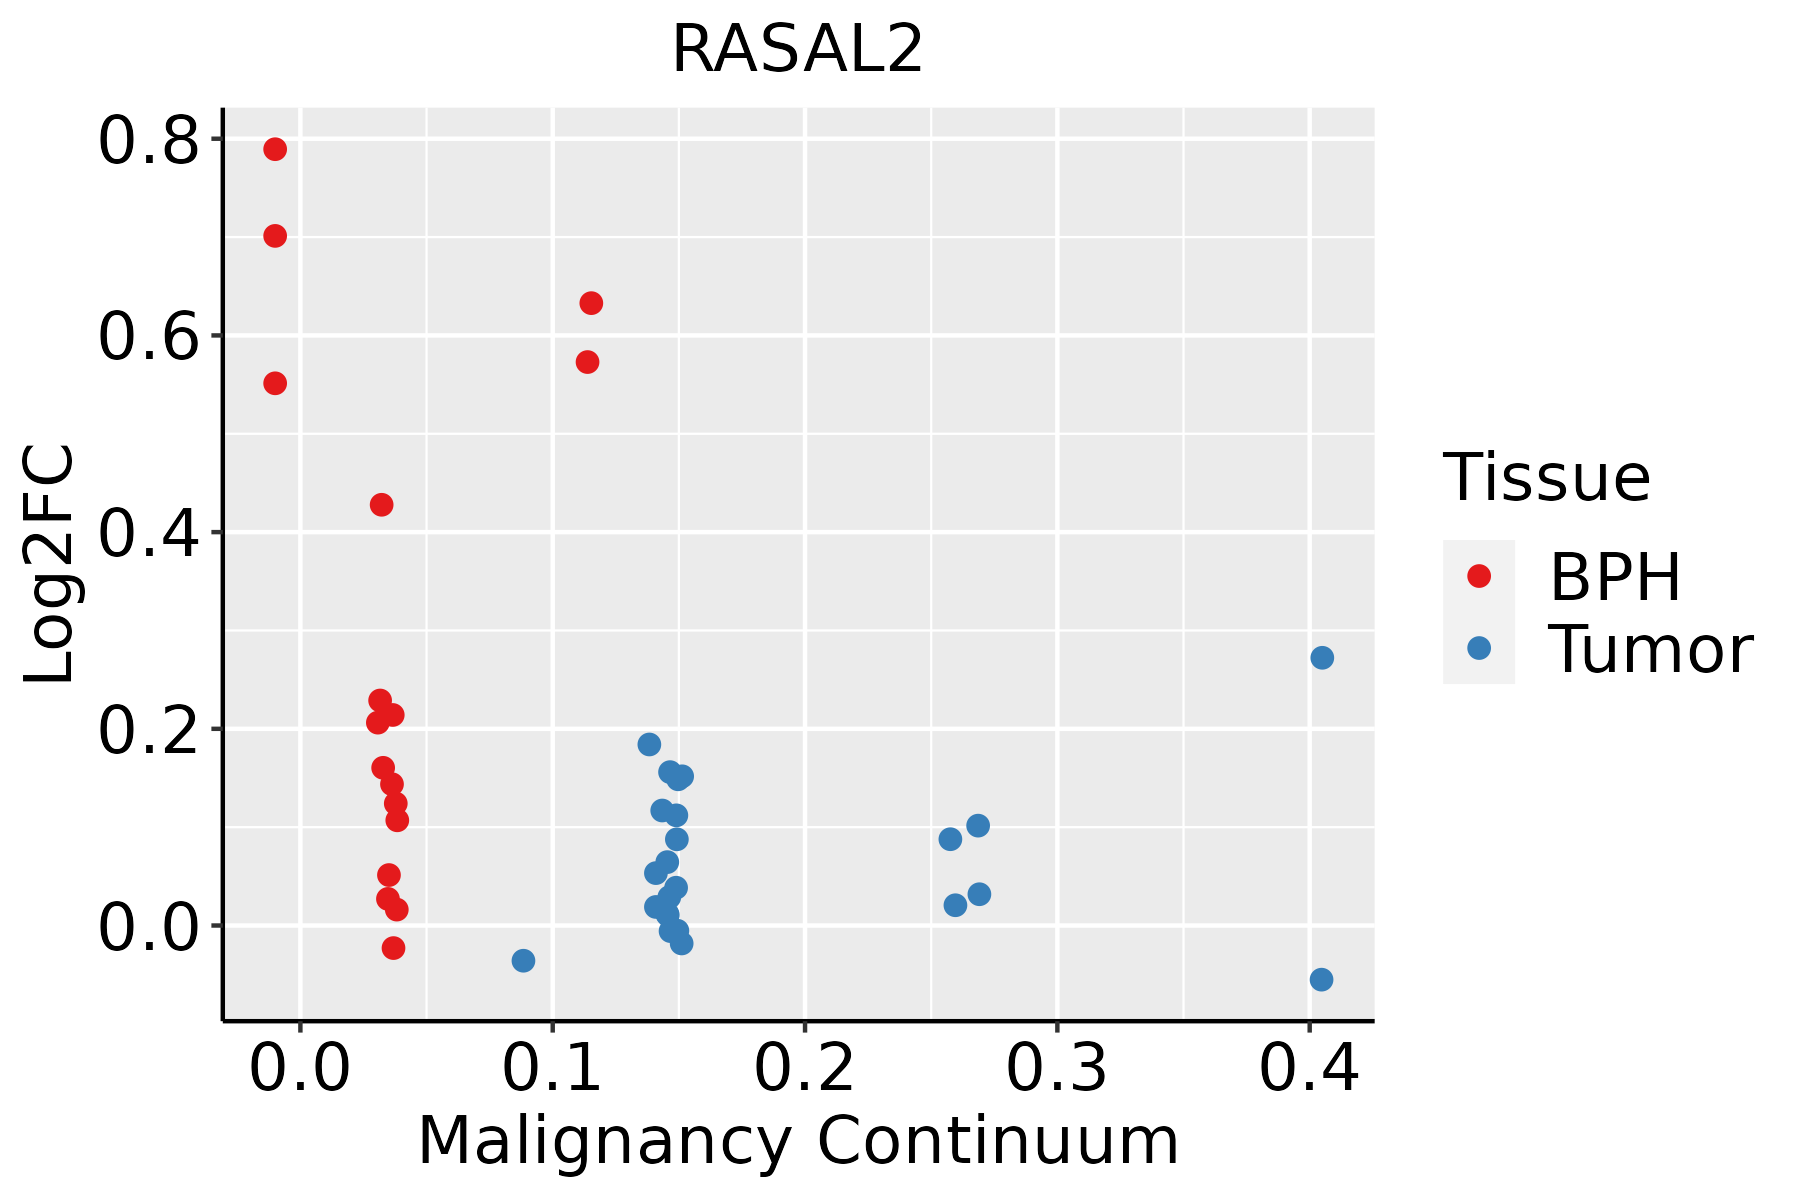 | BPH: Benign Prostatic Hyperplasia |
| Skin |  | AK: Actinic keratosis |
| cSCC: Cutaneous squamous cell carcinoma | ||
| SCCIS:squamous cell carcinoma in situ | ||
| Thyroid | 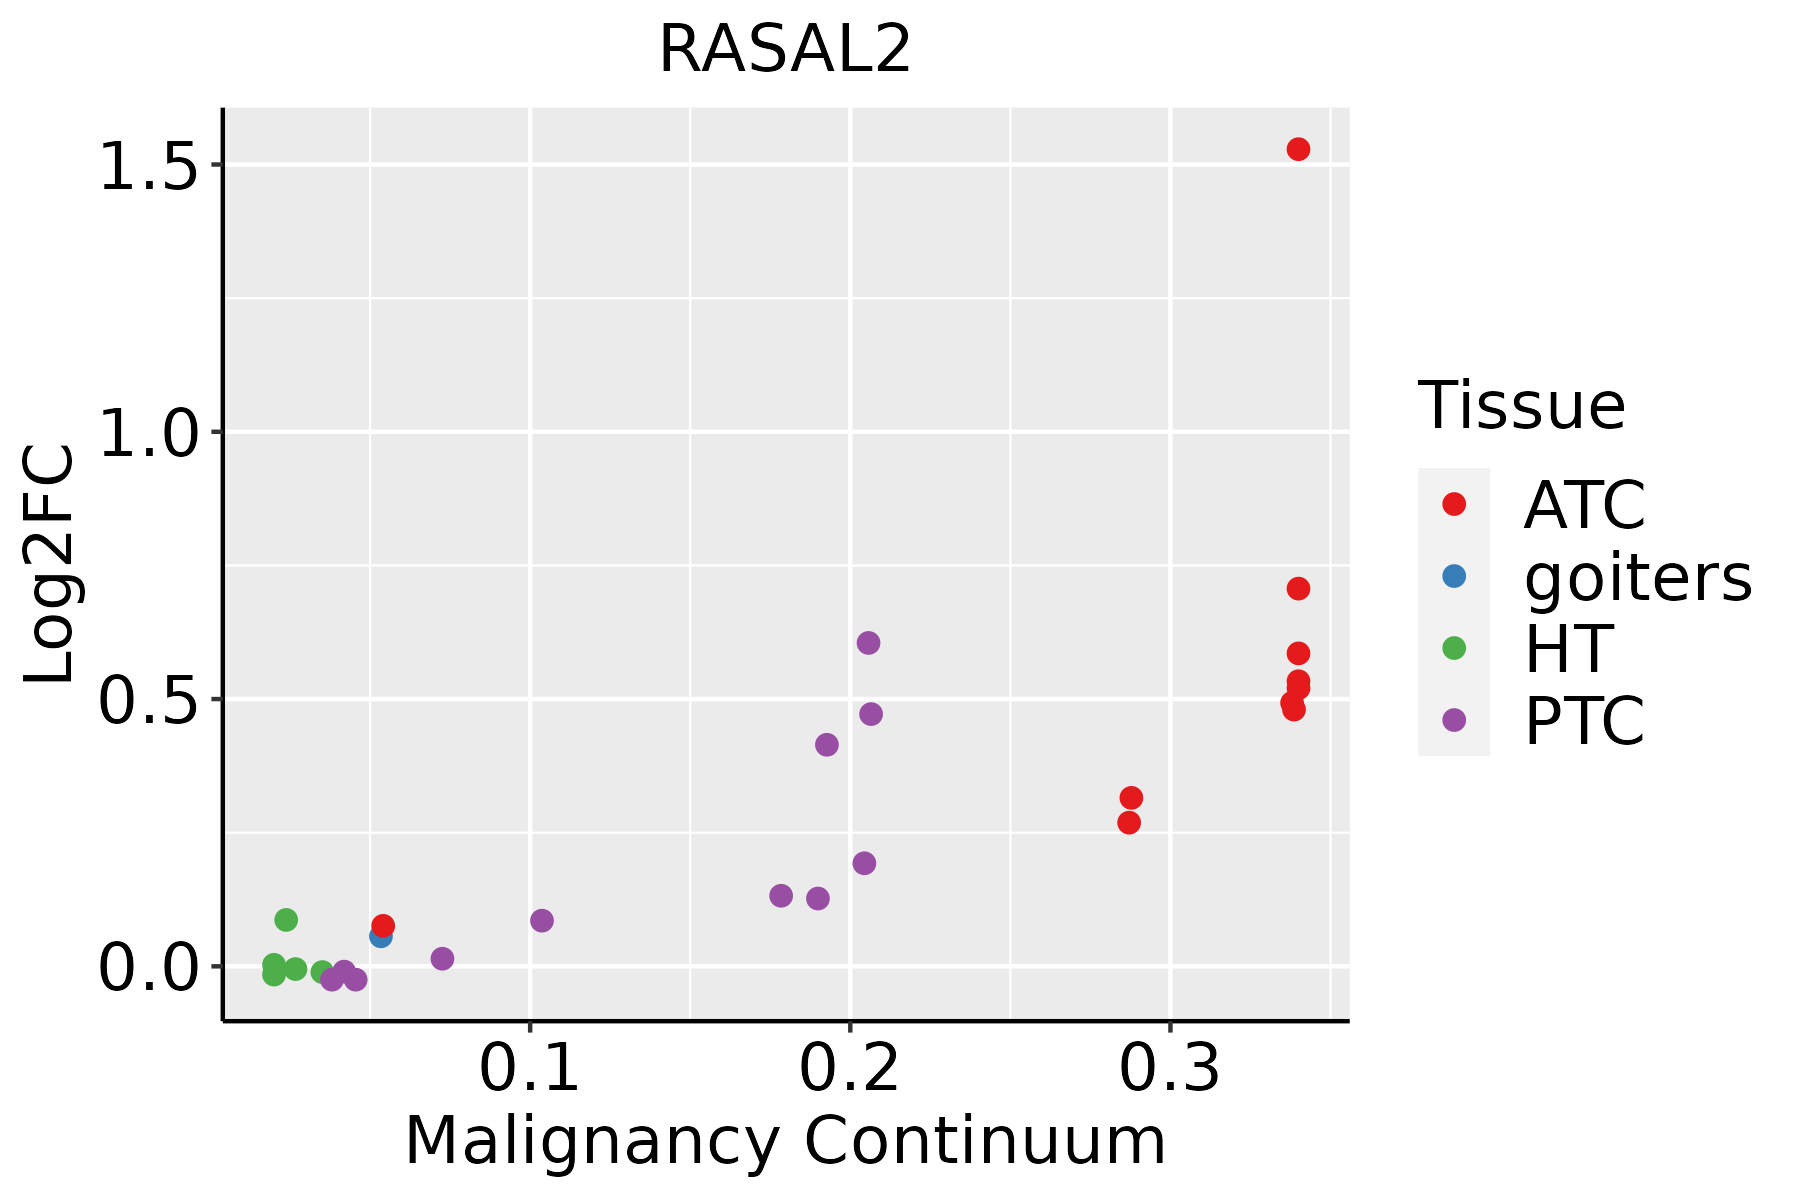 | ATC: Anaplastic thyroid cancer |
| HT: Hashimoto's thyroiditis | ||
| PTC: Papillary thyroid cancer |
| ∗log2FC in expression of this searched gene in stem-like cells from each diseased tissue sample relative to stem-like cells in normal samples in each tissue plotted against the malignancy continuum. Samples are colored based on if they are from different disease stage. |
Top |
Malignant transformation related pathway analysis |
| Find out the enriched GO biological processes and KEGG pathways involved in transition from healthy to precancer to cancer |
| Tissue | Disease Stage | Enriched GO biological Processes |
| Colorectum | AD |  |
| Colorectum | SER |  |
| Colorectum | MSS |  |
| Colorectum | MSI-H |  |
| Colorectum | FAP |  |
| ∗Top 15 enriched GO BP terms are showed in the bar plot of each disease state in each tissue. Each row represents a significant GO biological process which is colored according to the -log10(p.adjust). |
| Page: 1 2 3 4 5 6 7 8 9 |
| GO ID | Tissue | Disease Stage | Description | Gene Ratio | Bg Ratio | pvalue | p.adjust | Count |
| GO:00430877 | Cervix | CC | regulation of GTPase activity | 79/2311 | 348/18723 | 4.21e-08 | 2.60e-06 | 79 |
| GO:0043087 | Colorectum | AD | regulation of GTPase activity | 110/3918 | 348/18723 | 1.64e-06 | 5.03e-05 | 110 |
| GO:00430872 | Colorectum | MSS | regulation of GTPase activity | 101/3467 | 348/18723 | 1.00e-06 | 3.46e-05 | 101 |
| GO:00430873 | Colorectum | FAP | regulation of GTPase activity | 85/2622 | 348/18723 | 1.20e-07 | 7.68e-06 | 85 |
| GO:00430874 | Colorectum | CRC | regulation of GTPase activity | 69/2078 | 348/18723 | 1.11e-06 | 6.69e-05 | 69 |
| GO:00430878 | Endometrium | AEH | regulation of GTPase activity | 66/2100 | 348/18723 | 1.26e-05 | 2.77e-04 | 66 |
| GO:004308712 | Endometrium | EEC | regulation of GTPase activity | 67/2168 | 348/18723 | 1.84e-05 | 3.43e-04 | 67 |
| GO:004308715 | Esophagus | ESCC | regulation of GTPase activity | 183/8552 | 348/18723 | 5.34e-03 | 2.00e-02 | 183 |
| GO:00430876 | Lung | IAC | regulation of GTPase activity | 67/2061 | 348/18723 | 3.43e-06 | 1.44e-04 | 67 |
| GO:004308711 | Lung | AIS | regulation of GTPase activity | 65/1849 | 348/18723 | 3.35e-07 | 2.83e-05 | 65 |
| GO:004308721 | Lung | MIAC | regulation of GTPase activity | 41/967 | 348/18723 | 7.39e-07 | 1.08e-04 | 41 |
| GO:00430879 | Prostate | BPH | regulation of GTPase activity | 88/3107 | 348/18723 | 2.04e-05 | 2.49e-04 | 88 |
| GO:004308713 | Prostate | Tumor | regulation of GTPase activity | 88/3246 | 348/18723 | 1.04e-04 | 1.00e-03 | 88 |
| GO:004308716 | Skin | AK | regulation of GTPase activity | 54/1910 | 348/18723 | 1.17e-03 | 8.98e-03 | 54 |
| GO:004308717 | Skin | SCCIS | regulation of GTPase activity | 39/919 | 348/18723 | 1.38e-06 | 8.71e-05 | 39 |
| GO:004308718 | Thyroid | PTC | regulation of GTPase activity | 148/5968 | 348/18723 | 1.63e-05 | 1.71e-04 | 148 |
| GO:004308719 | Thyroid | ATC | regulation of GTPase activity | 153/6293 | 348/18723 | 3.24e-05 | 2.68e-04 | 153 |
| Page: 1 |
| Pathway ID | Tissue | Disease Stage | Description | Gene Ratio | Bg Ratio | pvalue | p.adjust | qvalue | Count |
| hsa040142 | Cervix | CC | Ras signaling pathway | 51/1267 | 236/8465 | 3.55e-03 | 1.34e-02 | 7.91e-03 | 51 |
| hsa0401411 | Cervix | CC | Ras signaling pathway | 51/1267 | 236/8465 | 3.55e-03 | 1.34e-02 | 7.91e-03 | 51 |
| hsa04014 | Colorectum | CRC | Ras signaling pathway | 49/1091 | 236/8465 | 4.04e-04 | 4.50e-03 | 3.05e-03 | 49 |
| hsa040141 | Colorectum | CRC | Ras signaling pathway | 49/1091 | 236/8465 | 4.04e-04 | 4.50e-03 | 3.05e-03 | 49 |
| Page: 1 |
Top |
Cell-cell communication analysis |
| Identification of potential cell-cell interactions between two cell types and their ligand-receptor pairs for different disease states |
| Ligand | Receptor | LRpair | Pathway | Tissue | Disease Stage |
| Page: 1 |
Top |
Single-cell gene regulatory network inference analysis |
| Find out the significant the regulons (TFs) and the target genes of each regulon across cell types for different disease states |
| TF | Cell Type | Tissue | Disease Stage | Target Gene | RSS | Regulon Activity |
| ∗The dot plots of a searched regulon are shown for all cell subpopulations in each disease state of each tissue based on the regulon specific score inferred using pySCENIC and by calculating the average expression. |
| Page: 1 |
Top |
Somatic mutation of malignant transformation related genes |
| Annotation of somatic variants for genes involved in malignant transformation |
| Hugo Symbol | Variant Class | Variant Classification | dbSNP RS | HGVSc | HGVSp | HGVSp Short | SWISSPROT | BIOTYPE | SIFT | PolyPhen | Tumor Sample Barcode | Tissue | Histology | Sex | Age | Stage | Therapy Types | Drugs | Outcome |
| RASAL2 | SNV | Missense_Mutation | novel | c.3622N>A | p.Asp1208Asn | p.D1208N | Q9UJF2 | protein_coding | deleterious(0) | probably_damaging(0.997) | TCGA-A8-A08X-01 | Breast | breast invasive carcinoma | Female | <65 | III/IV | Chemotherapy | doxorubicin | PD |
| RASAL2 | SNV | Missense_Mutation | novel | c.2836N>A | p.Glu946Lys | p.E946K | Q9UJF2 | protein_coding | deleterious(0.01) | probably_damaging(0.987) | TCGA-AC-A5XS-01 | Breast | breast invasive carcinoma | Female | >=65 | I/II | Hormone Therapy | femara | SD |
| RASAL2 | SNV | Missense_Mutation | novel | c.2411C>A | p.Ser804Tyr | p.S804Y | Q9UJF2 | protein_coding | deleterious(0.01) | probably_damaging(0.994) | TCGA-AN-A046-01 | Breast | breast invasive carcinoma | Female | >=65 | I/II | Unknown | Unknown | SD |
| RASAL2 | SNV | Missense_Mutation | c.2397N>T | p.Leu799Phe | p.L799F | Q9UJF2 | protein_coding | tolerated(1) | benign(0.07) | TCGA-AO-A03L-01 | Breast | breast invasive carcinoma | Female | <65 | III/IV | Chemotherapy | cyclophosphamide | SD | |
| RASAL2 | SNV | Missense_Mutation | rs750108608 | c.1043N>A | p.Arg348His | p.R348H | Q9UJF2 | protein_coding | deleterious(0) | probably_damaging(0.997) | TCGA-AR-A1AW-01 | Breast | breast invasive carcinoma | Female | >=65 | I/II | Chemotherapy | docetaxel | SD |
| RASAL2 | SNV | Missense_Mutation | c.3562N>T | p.Asp1188Tyr | p.D1188Y | Q9UJF2 | protein_coding | deleterious(0) | probably_damaging(1) | TCGA-BH-A0BP-01 | Breast | breast invasive carcinoma | Female | >=65 | I/II | Unknown | Unknown | SD | |
| RASAL2 | SNV | Missense_Mutation | c.330G>T | p.Glu110Asp | p.E110D | Q9UJF2 | protein_coding | deleterious(0.01) | probably_damaging(0.971) | TCGA-BH-A18G-01 | Breast | breast invasive carcinoma | Female | >=65 | I/II | Unknown | Unknown | SD | |
| RASAL2 | SNV | Missense_Mutation | novel | c.3618N>C | p.Lys1206Asn | p.K1206N | Q9UJF2 | protein_coding | deleterious(0.03) | benign(0.031) | TCGA-BH-A2L8-01 | Breast | breast invasive carcinoma | Female | <65 | I/II | Chemotherapy | cytoxan | CR |
| RASAL2 | SNV | Missense_Mutation | rs762969560 | c.680G>A | p.Arg227His | p.R227H | Q9UJF2 | protein_coding | tolerated(0.27) | benign(0.082) | TCGA-D8-A1JC-01 | Breast | breast invasive carcinoma | Female | <65 | III/IV | Chemotherapy | adriamycin | SD |
| RASAL2 | SNV | Missense_Mutation | c.2753N>G | p.Gln918Arg | p.Q918R | Q9UJF2 | protein_coding | tolerated(0.36) | benign(0.003) | TCGA-D8-A1XK-01 | Breast | breast invasive carcinoma | Female | <65 | I/II | Chemotherapy | doxorubicine+cyclophosphamide | SD |
| Page: 1 2 3 4 5 6 7 8 9 10 11 12 13 14 15 16 |
Top |
Related drugs of malignant transformation related genes |
| Identification of chemicals and drugs interact with genes involved in malignant transfromation |
| (DGIdb 4.0) |
| Entrez ID | Symbol | Category | Interaction Types | Drug Claim Name | Drug Name | PMIDs |
| Page: 1 |

Copyright 2023-Present -The University of Texas Health Science Center at Houston |