
|
|||||
|
 | |
| |
| |
| |
| |
| |
|
Gene: RASA2 |
Gene summary for RASA2 |
| Gene information | Species | Human | Gene symbol | RASA2 | Gene ID | 5922 |
| Gene name | RAS p21 protein activator 2 | |
| Gene Alias | GAP1M | |
| Cytomap | 3q23 | |
| Gene Type | protein-coding | GO ID | GO:0007154 | UniProtAcc | Q15283 |
Top |
Malignant transformation analysis |
| Identification of the aberrant gene expression in precancerous and cancerous lesions by comparing the gene expression of stem-like cells in diseased tissues with normal stem cells |
| Entrez ID | Symbol | Replicates | Species | Organ | Tissue | Adj P-value | Log2FC | Malignancy |
| 5922 | RASA2 | CCI_1 | Human | Cervix | CC | 1.77e-03 | 1.11e+00 | 0.528 |
| 5922 | RASA2 | CCI_2 | Human | Cervix | CC | 2.63e-14 | 1.37e+00 | 0.5249 |
| 5922 | RASA2 | CCI_3 | Human | Cervix | CC | 2.85e-02 | 5.37e-01 | 0.516 |
| 5922 | RASA2 | HTA11_3410_2000001011 | Human | Colorectum | AD | 1.06e-14 | -5.36e-01 | 0.0155 |
| 5922 | RASA2 | HTA11_2487_2000001011 | Human | Colorectum | SER | 1.61e-02 | -3.64e-01 | -0.1808 |
| 5922 | RASA2 | HTA11_2951_2000001011 | Human | Colorectum | AD | 4.71e-03 | -7.38e-01 | 0.0216 |
| 5922 | RASA2 | HTA11_3361_2000001011 | Human | Colorectum | AD | 8.32e-03 | -4.71e-01 | -0.1207 |
| 5922 | RASA2 | HTA11_696_2000001011 | Human | Colorectum | AD | 9.61e-08 | -3.55e-01 | -0.1464 |
| 5922 | RASA2 | HTA11_866_2000001011 | Human | Colorectum | AD | 1.26e-03 | -2.62e-01 | -0.1001 |
| 5922 | RASA2 | HTA11_5212_2000001011 | Human | Colorectum | AD | 3.37e-02 | -5.89e-01 | -0.2061 |
| 5922 | RASA2 | HTA11_866_3004761011 | Human | Colorectum | AD | 1.70e-10 | -5.30e-01 | 0.096 |
| 5922 | RASA2 | HTA11_8622_2000001021 | Human | Colorectum | SER | 3.74e-02 | -5.04e-01 | 0.0528 |
| 5922 | RASA2 | HTA11_7696_3000711011 | Human | Colorectum | AD | 7.59e-11 | -4.04e-01 | 0.0674 |
| 5922 | RASA2 | HTA11_6818_2000001021 | Human | Colorectum | AD | 3.90e-03 | -3.61e-01 | 0.0588 |
| 5922 | RASA2 | HTA11_99999974143_84620 | Human | Colorectum | MSS | 3.95e-22 | -5.84e-01 | 0.3005 |
| 5922 | RASA2 | F007 | Human | Colorectum | FAP | 1.15e-04 | -2.82e-01 | 0.1176 |
| 5922 | RASA2 | A015-C-203 | Human | Colorectum | FAP | 1.10e-26 | -2.73e-01 | -0.1294 |
| 5922 | RASA2 | A015-C-204 | Human | Colorectum | FAP | 1.17e-05 | -2.72e-01 | -0.0228 |
| 5922 | RASA2 | A014-C-040 | Human | Colorectum | FAP | 9.79e-06 | -4.73e-01 | -0.1184 |
| 5922 | RASA2 | A002-C-201 | Human | Colorectum | FAP | 1.61e-16 | -3.69e-01 | 0.0324 |
| Page: 1 2 3 4 5 6 7 8 |
| Tissue | Expression Dynamics | Abbreviation |
| Cervix |  | CC: Cervix cancer |
| HSIL_HPV: HPV-infected high-grade squamous intraepithelial lesions | ||
| N_HPV: HPV-infected normal cervix | ||
| Colorectum (GSE201348) |  | FAP: Familial adenomatous polyposis |
| CRC: Colorectal cancer | ||
| Colorectum (HTA11) |  | AD: Adenomas |
| SER: Sessile serrated lesions | ||
| MSI-H: Microsatellite-high colorectal cancer | ||
| MSS: Microsatellite stable colorectal cancer | ||
| Endometrium | 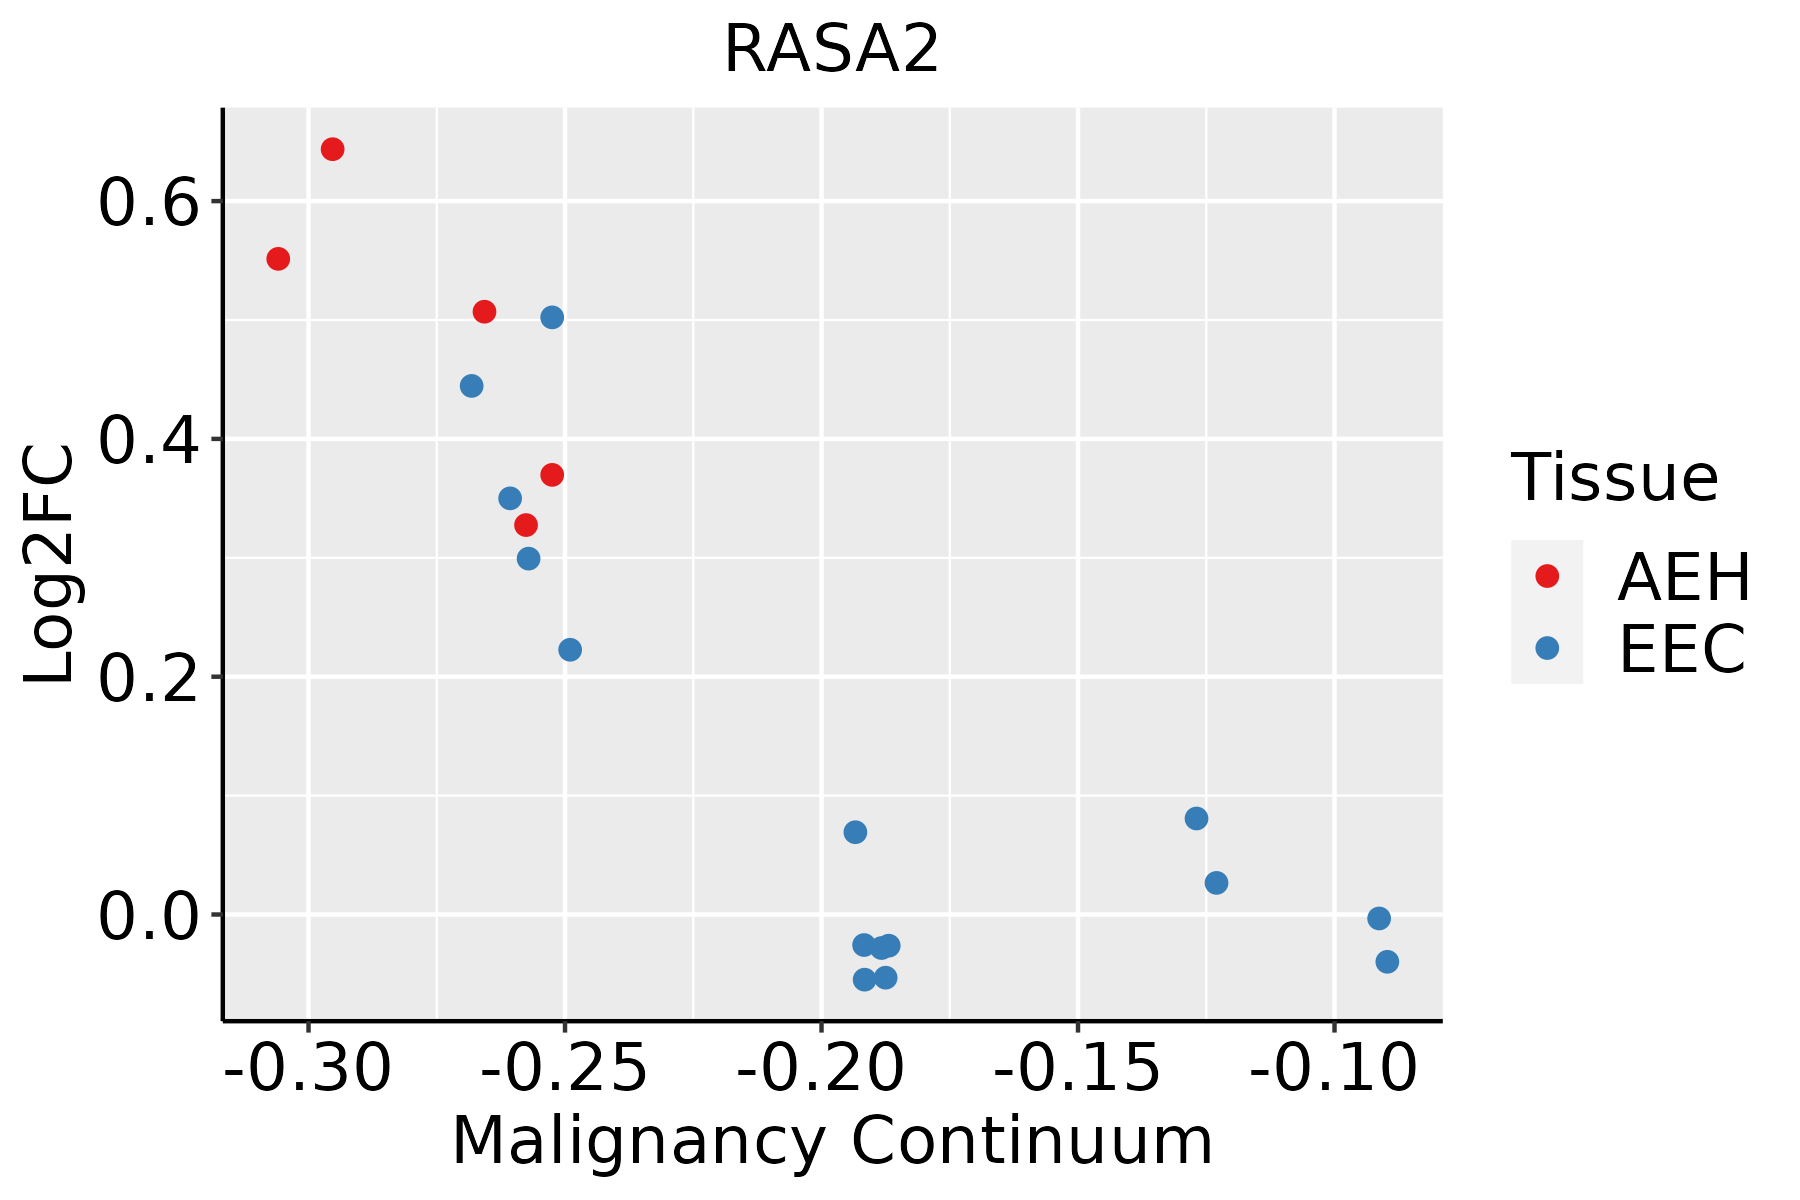 | AEH: Atypical endometrial hyperplasia |
| EEC: Endometrioid Cancer | ||
| Esophagus | 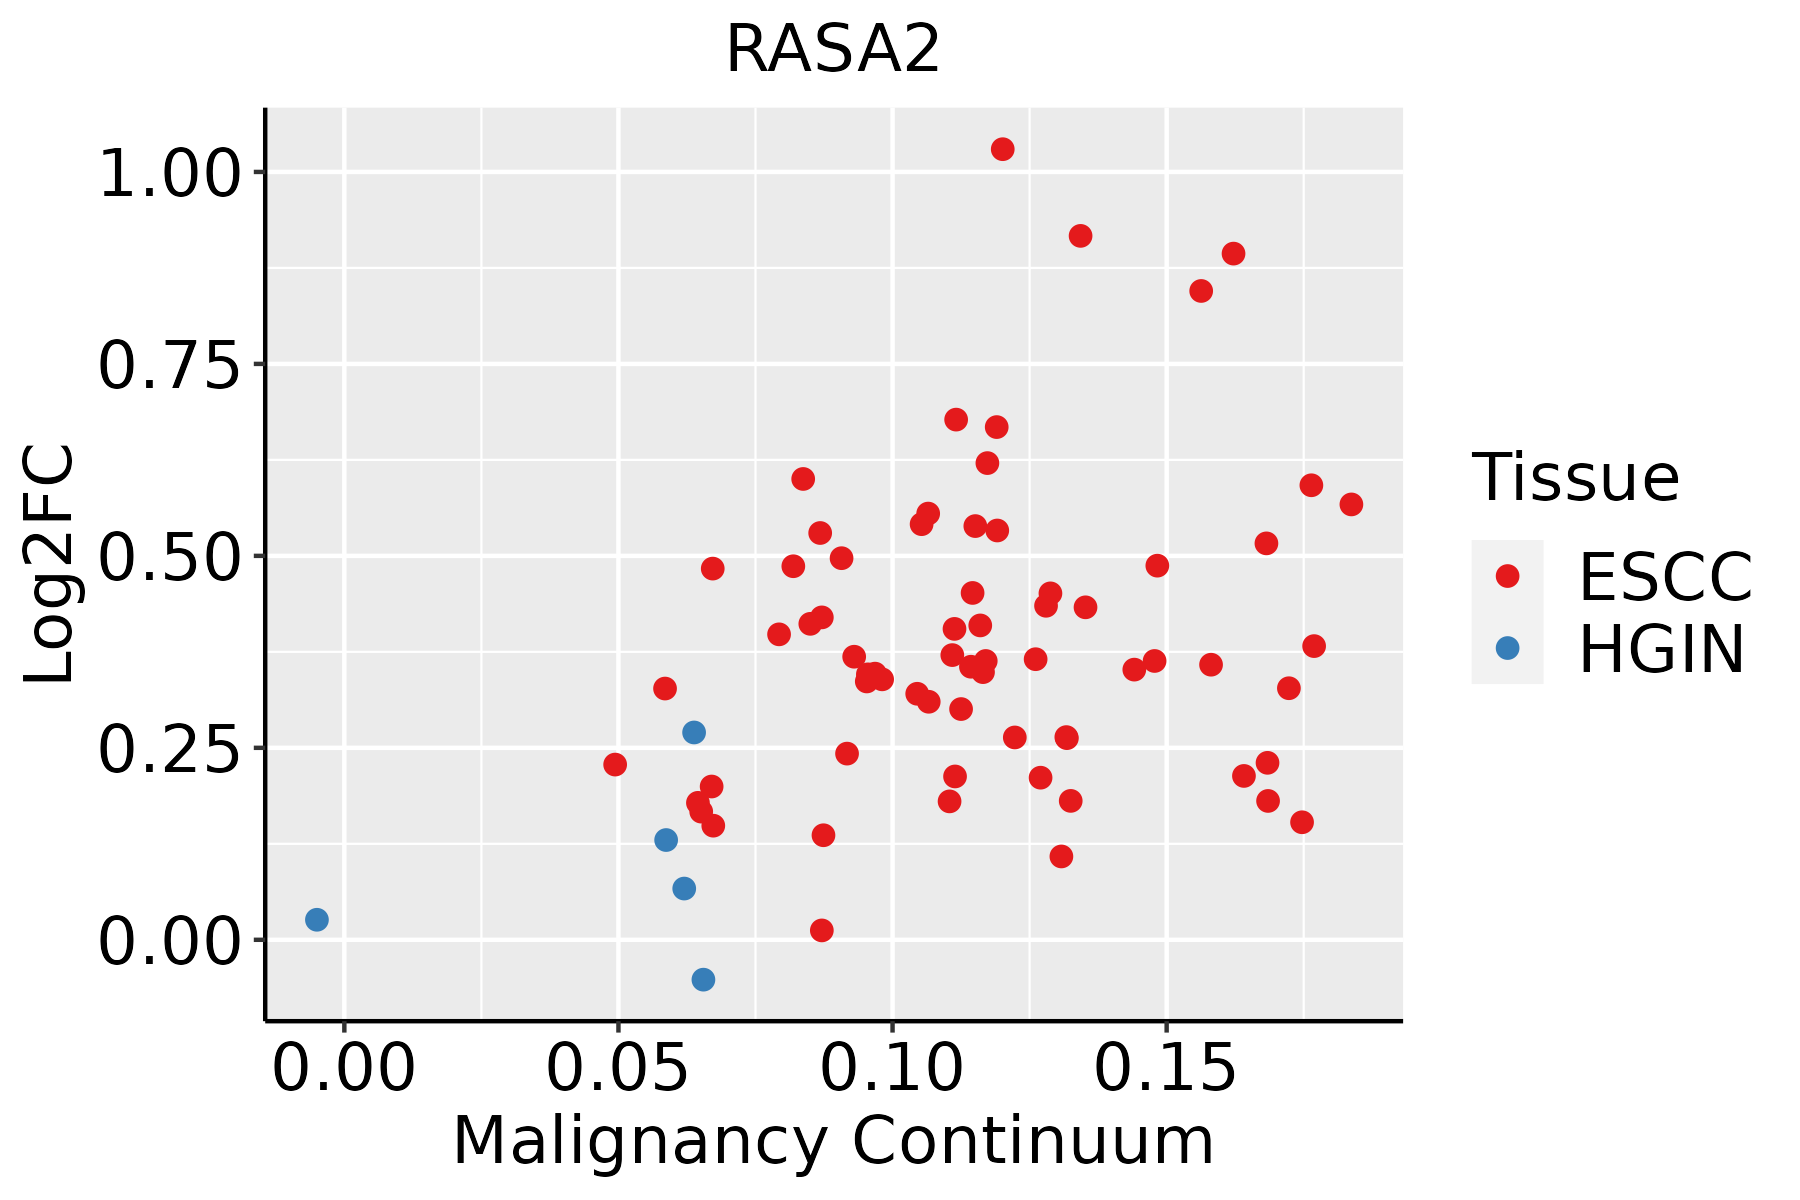 | ESCC: Esophageal squamous cell carcinoma |
| HGIN: High-grade intraepithelial neoplasias | ||
| LGIN: Low-grade intraepithelial neoplasias | ||
| Lung | 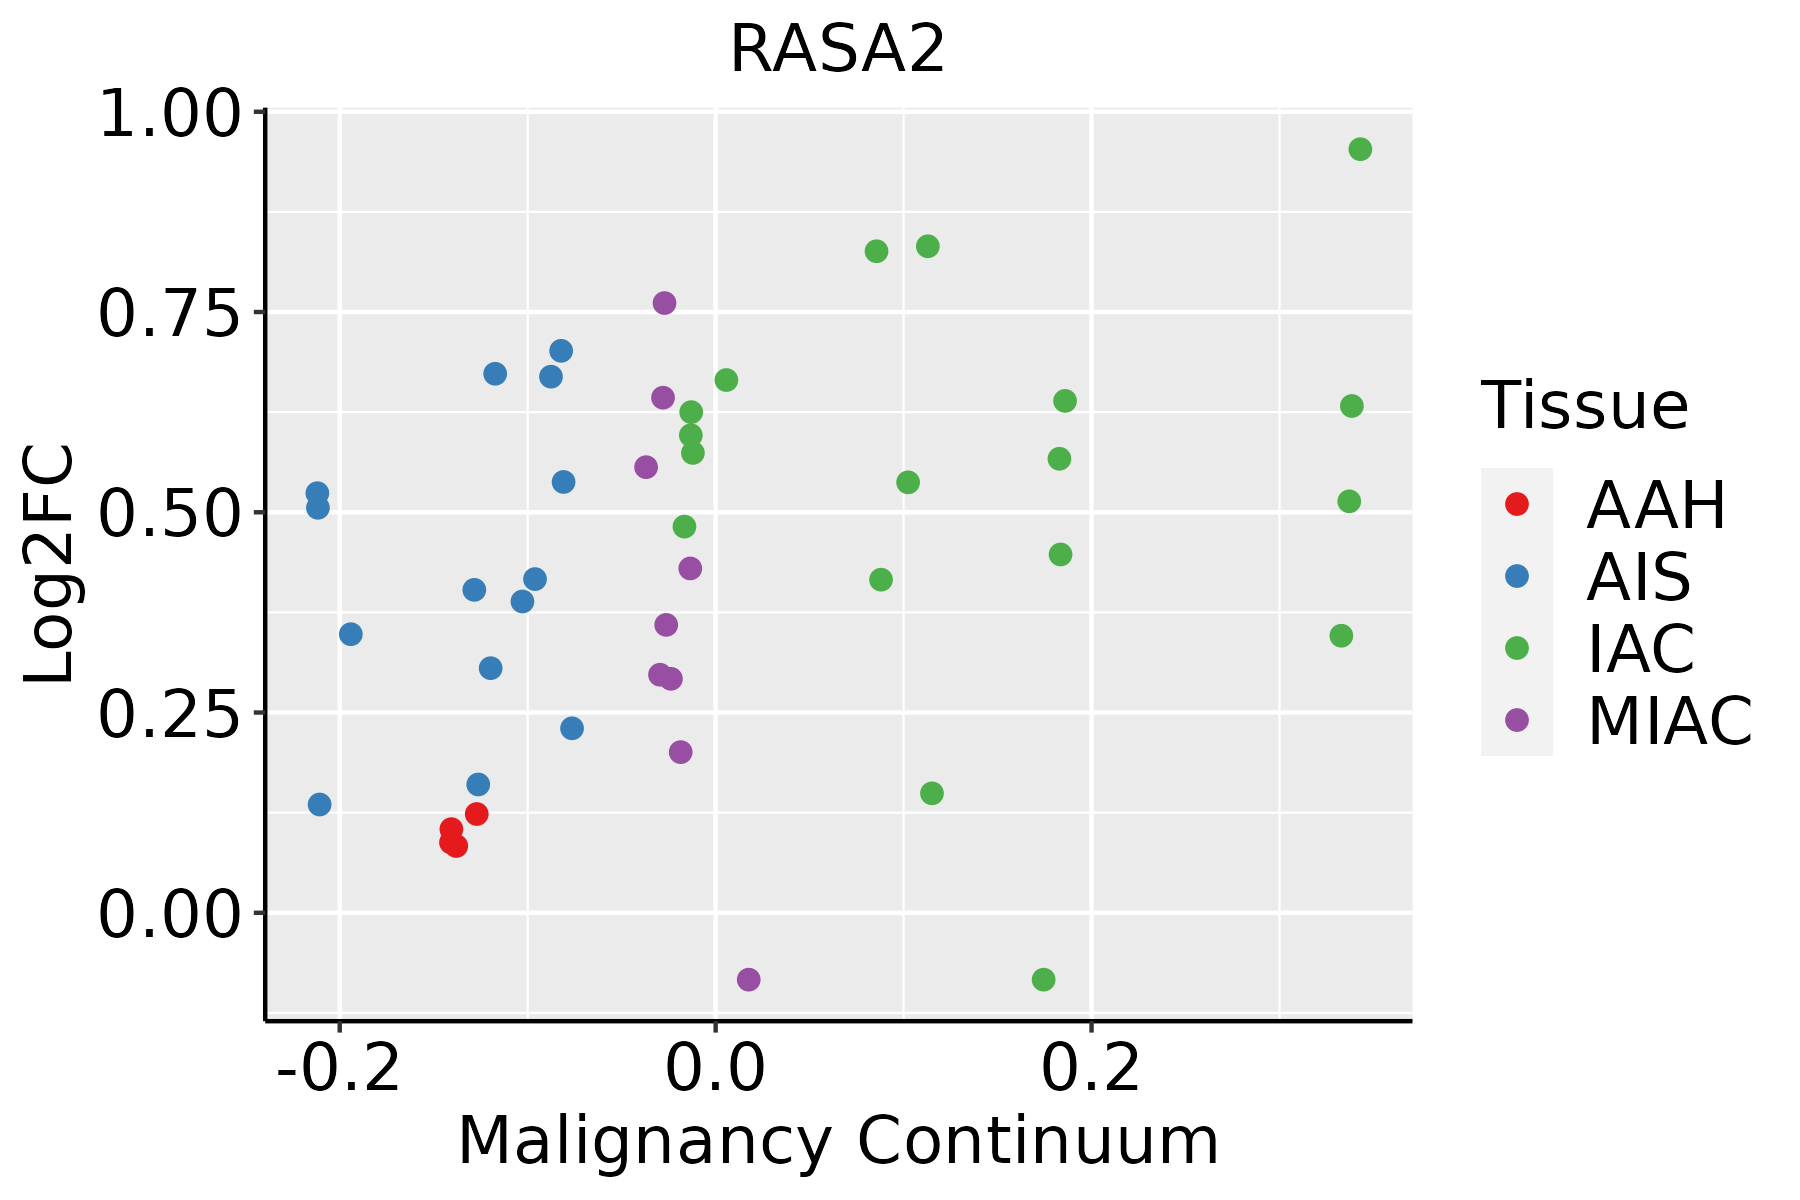 | AAH: Atypical adenomatous hyperplasia |
| AIS: Adenocarcinoma in situ | ||
| IAC: Invasive lung adenocarcinoma | ||
| MIA: Minimally invasive adenocarcinoma | ||
| Prostate | 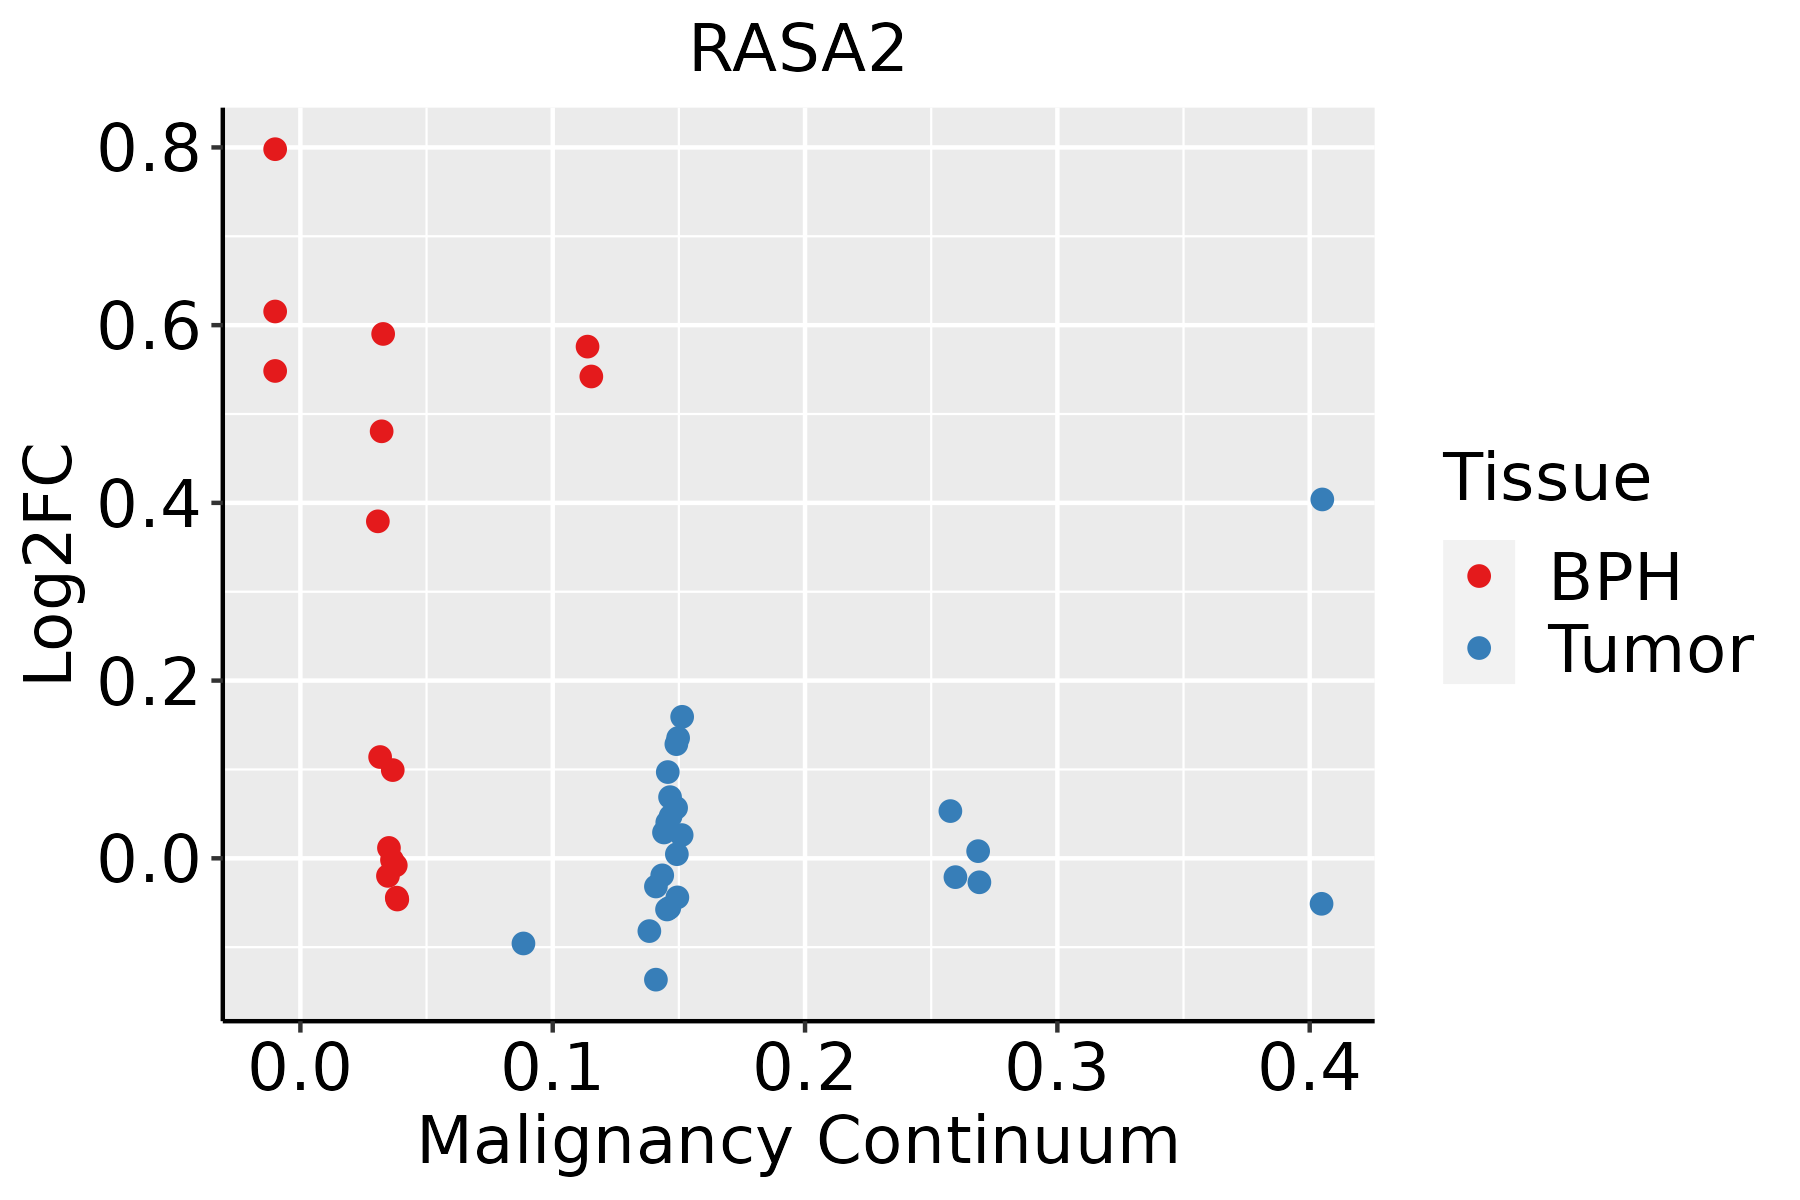 | BPH: Benign Prostatic Hyperplasia |
| Thyroid |  | ATC: Anaplastic thyroid cancer |
| HT: Hashimoto's thyroiditis | ||
| PTC: Papillary thyroid cancer |
| ∗log2FC in expression of this searched gene in stem-like cells from each diseased tissue sample relative to stem-like cells in normal samples in each tissue plotted against the malignancy continuum. Samples are colored based on if they are from different disease stage. |
Top |
Malignant transformation related pathway analysis |
| Find out the enriched GO biological processes and KEGG pathways involved in transition from healthy to precancer to cancer |
| Tissue | Disease Stage | Enriched GO biological Processes |
| Colorectum | AD |  |
| Colorectum | SER |  |
| Colorectum | MSS |  |
| Colorectum | MSI-H |  |
| Colorectum | FAP |  |
| ∗Top 15 enriched GO BP terms are showed in the bar plot of each disease state in each tissue. Each row represents a significant GO biological process which is colored according to the -log10(p.adjust). |
| Page: 1 2 3 4 5 6 7 8 9 |
| GO ID | Tissue | Disease Stage | Description | Gene Ratio | Bg Ratio | pvalue | p.adjust | Count |
| GO:00510566 | Cervix | CC | regulation of small GTPase mediated signal transduction | 75/2311 | 302/18723 | 1.54e-09 | 1.74e-07 | 75 |
| GO:00072656 | Cervix | CC | Ras protein signal transduction | 79/2311 | 337/18723 | 9.49e-09 | 7.77e-07 | 79 |
| GO:00430877 | Cervix | CC | regulation of GTPase activity | 79/2311 | 348/18723 | 4.21e-08 | 2.60e-06 | 79 |
| GO:00465785 | Cervix | CC | regulation of Ras protein signal transduction | 44/2311 | 189/18723 | 2.05e-05 | 3.73e-04 | 44 |
| GO:00510585 | Cervix | CC | negative regulation of small GTPase mediated signal transduction | 15/2311 | 56/18723 | 2.60e-03 | 1.80e-02 | 15 |
| GO:00465804 | Cervix | CC | negative regulation of Ras protein signal transduction | 13/2311 | 49/18723 | 5.34e-03 | 3.10e-02 | 13 |
| GO:0043087 | Colorectum | AD | regulation of GTPase activity | 110/3918 | 348/18723 | 1.64e-06 | 5.03e-05 | 110 |
| GO:0007265 | Colorectum | AD | Ras protein signal transduction | 104/3918 | 337/18723 | 1.01e-05 | 2.35e-04 | 104 |
| GO:0051056 | Colorectum | AD | regulation of small GTPase mediated signal transduction | 94/3918 | 302/18723 | 1.81e-05 | 3.76e-04 | 94 |
| GO:0046578 | Colorectum | AD | regulation of Ras protein signal transduction | 56/3918 | 189/18723 | 2.85e-03 | 2.14e-02 | 56 |
| GO:0051058 | Colorectum | AD | negative regulation of small GTPase mediated signal transduction | 21/3918 | 56/18723 | 3.26e-03 | 2.39e-02 | 21 |
| GO:00430871 | Colorectum | SER | regulation of GTPase activity | 77/2897 | 348/18723 | 5.90e-04 | 8.07e-03 | 77 |
| GO:00430872 | Colorectum | MSS | regulation of GTPase activity | 101/3467 | 348/18723 | 1.00e-06 | 3.46e-05 | 101 |
| GO:00072651 | Colorectum | MSS | Ras protein signal transduction | 91/3467 | 337/18723 | 7.20e-05 | 1.21e-03 | 91 |
| GO:00510561 | Colorectum | MSS | regulation of small GTPase mediated signal transduction | 82/3467 | 302/18723 | 1.31e-04 | 1.99e-03 | 82 |
| GO:00510562 | Colorectum | FAP | regulation of small GTPase mediated signal transduction | 78/2622 | 302/18723 | 3.25e-08 | 2.85e-06 | 78 |
| GO:00430873 | Colorectum | FAP | regulation of GTPase activity | 85/2622 | 348/18723 | 1.20e-07 | 7.68e-06 | 85 |
| GO:00072652 | Colorectum | FAP | Ras protein signal transduction | 80/2622 | 337/18723 | 9.61e-07 | 4.33e-05 | 80 |
| GO:00465781 | Colorectum | FAP | regulation of Ras protein signal transduction | 47/2622 | 189/18723 | 4.67e-05 | 9.60e-04 | 47 |
| GO:00510581 | Colorectum | FAP | negative regulation of small GTPase mediated signal transduction | 16/2622 | 56/18723 | 3.40e-03 | 2.47e-02 | 16 |
| Page: 1 2 3 4 |
| Pathway ID | Tissue | Disease Stage | Description | Gene Ratio | Bg Ratio | pvalue | p.adjust | qvalue | Count |
| hsa040142 | Cervix | CC | Ras signaling pathway | 51/1267 | 236/8465 | 3.55e-03 | 1.34e-02 | 7.91e-03 | 51 |
| hsa040109 | Cervix | CC | MAPK signaling pathway | 62/1267 | 302/8465 | 4.89e-03 | 1.67e-02 | 9.86e-03 | 62 |
| hsa0401411 | Cervix | CC | Ras signaling pathway | 51/1267 | 236/8465 | 3.55e-03 | 1.34e-02 | 7.91e-03 | 51 |
| hsa0401012 | Cervix | CC | MAPK signaling pathway | 62/1267 | 302/8465 | 4.89e-03 | 1.67e-02 | 9.86e-03 | 62 |
| hsa04010 | Colorectum | FAP | MAPK signaling pathway | 68/1404 | 302/8465 | 4.00e-03 | 1.67e-02 | 1.02e-02 | 68 |
| hsa040101 | Colorectum | FAP | MAPK signaling pathway | 68/1404 | 302/8465 | 4.00e-03 | 1.67e-02 | 1.02e-02 | 68 |
| hsa04014 | Colorectum | CRC | Ras signaling pathway | 49/1091 | 236/8465 | 4.04e-04 | 4.50e-03 | 3.05e-03 | 49 |
| hsa040102 | Colorectum | CRC | MAPK signaling pathway | 56/1091 | 302/8465 | 2.76e-03 | 1.77e-02 | 1.20e-02 | 56 |
| hsa040141 | Colorectum | CRC | Ras signaling pathway | 49/1091 | 236/8465 | 4.04e-04 | 4.50e-03 | 3.05e-03 | 49 |
| hsa040103 | Colorectum | CRC | MAPK signaling pathway | 56/1091 | 302/8465 | 2.76e-03 | 1.77e-02 | 1.20e-02 | 56 |
| hsa0520325 | Esophagus | ESCC | Viral carcinogenesis | 137/4205 | 204/8465 | 2.47e-07 | 1.88e-06 | 9.62e-07 | 137 |
| hsa0520335 | Esophagus | ESCC | Viral carcinogenesis | 137/4205 | 204/8465 | 2.47e-07 | 1.88e-06 | 9.62e-07 | 137 |
| hsa040108 | Lung | IAC | MAPK signaling pathway | 62/1053 | 302/8465 | 3.54e-05 | 6.38e-04 | 4.24e-04 | 62 |
| hsa052034 | Lung | IAC | Viral carcinogenesis | 43/1053 | 204/8465 | 3.02e-04 | 3.07e-03 | 2.04e-03 | 43 |
| hsa0401011 | Lung | IAC | MAPK signaling pathway | 62/1053 | 302/8465 | 3.54e-05 | 6.38e-04 | 4.24e-04 | 62 |
| hsa0520311 | Lung | IAC | Viral carcinogenesis | 43/1053 | 204/8465 | 3.02e-04 | 3.07e-03 | 2.04e-03 | 43 |
| hsa0401021 | Lung | AIS | MAPK signaling pathway | 57/961 | 302/8465 | 6.41e-05 | 9.43e-04 | 6.03e-04 | 57 |
| hsa0520321 | Lung | AIS | Viral carcinogenesis | 37/961 | 204/8465 | 2.49e-03 | 1.49e-02 | 9.55e-03 | 37 |
| hsa0401031 | Lung | AIS | MAPK signaling pathway | 57/961 | 302/8465 | 6.41e-05 | 9.43e-04 | 6.03e-04 | 57 |
| hsa0520331 | Lung | AIS | Viral carcinogenesis | 37/961 | 204/8465 | 2.49e-03 | 1.49e-02 | 9.55e-03 | 37 |
| Page: 1 2 |
Top |
Cell-cell communication analysis |
| Identification of potential cell-cell interactions between two cell types and their ligand-receptor pairs for different disease states |
| Ligand | Receptor | LRpair | Pathway | Tissue | Disease Stage |
| Page: 1 |
Top |
Single-cell gene regulatory network inference analysis |
| Find out the significant the regulons (TFs) and the target genes of each regulon across cell types for different disease states |
| TF | Cell Type | Tissue | Disease Stage | Target Gene | RSS | Regulon Activity |
| ∗The dot plots of a searched regulon are shown for all cell subpopulations in each disease state of each tissue based on the regulon specific score inferred using pySCENIC and by calculating the average expression. |
| Page: 1 |
Top |
Somatic mutation of malignant transformation related genes |
| Annotation of somatic variants for genes involved in malignant transformation |
| Hugo Symbol | Variant Class | Variant Classification | dbSNP RS | HGVSc | HGVSp | HGVSp Short | SWISSPROT | BIOTYPE | SIFT | PolyPhen | Tumor Sample Barcode | Tissue | Histology | Sex | Age | Stage | Therapy Types | Drugs | Outcome |
| RASA2 | SNV | Missense_Mutation | novel | c.1475N>T | p.Arg492Ile | p.R492I | Q15283 | protein_coding | deleterious(0.03) | possibly_damaging(0.857) | TCGA-AN-A046-01 | Breast | breast invasive carcinoma | Female | >=65 | I/II | Unknown | Unknown | SD |
| RASA2 | SNV | Missense_Mutation | novel | c.1936A>G | p.Lys646Glu | p.K646E | Q15283 | protein_coding | tolerated(0.2) | benign(0.139) | TCGA-2W-A8YY-01 | Cervix | cervical & endocervical cancer | Female | <65 | I/II | Chemotherapy | cisplatin | CR |
| RASA2 | SNV | Missense_Mutation | rs776746640 | c.2095N>A | p.Val699Ile | p.V699I | Q15283 | protein_coding | tolerated(1) | benign(0.003) | TCGA-C5-A8XH-01 | Cervix | cervical & endocervical cancer | Female | <65 | I/II | Unknown | Unknown | SD |
| RASA2 | SNV | Missense_Mutation | c.765N>G | p.Ile255Met | p.I255M | Q15283 | protein_coding | deleterious(0) | possibly_damaging(0.699) | TCGA-DS-A0VN-01 | Cervix | cervical & endocervical cancer | Female | <65 | I/II | Chemotherapy | cisplatin | SD | |
| RASA2 | SNV | Missense_Mutation | c.1227G>A | p.Met409Ile | p.M409I | Q15283 | protein_coding | tolerated(0.34) | benign(0.309) | TCGA-EA-A50E-01 | Cervix | cervical & endocervical cancer | Female | <65 | I/II | Unknown | Unknown | PD | |
| RASA2 | SNV | Missense_Mutation | c.1222G>A | p.Glu408Lys | p.E408K | Q15283 | protein_coding | deleterious(0) | probably_damaging(0.976) | TCGA-Q1-A73O-01 | Cervix | cervical & endocervical cancer | Female | <65 | I/II | Chemotherapy | cisplatin | CR | |
| RASA2 | SNV | Missense_Mutation | c.2279N>T | p.Arg760Ile | p.R760I | Q15283 | protein_coding | deleterious(0) | probably_damaging(0.999) | TCGA-AA-3510-01 | Colorectum | colon adenocarcinoma | Male | >=65 | I/II | Unknown | Unknown | SD | |
| RASA2 | SNV | Missense_Mutation | novel | c.1036N>A | p.Ala346Thr | p.A346T | Q15283 | protein_coding | tolerated(0.07) | benign(0.14) | TCGA-AA-3947-01 | Colorectum | colon adenocarcinoma | Female | <65 | I/II | Unknown | Unknown | SD |
| RASA2 | SNV | Missense_Mutation | rs775043780 | c.1872G>T | p.Lys624Asn | p.K624N | Q15283 | protein_coding | deleterious(0) | possibly_damaging(0.861) | TCGA-AA-A010-01 | Colorectum | colon adenocarcinoma | Female | <65 | I/II | Chemotherapy | folinic | CR |
| RASA2 | SNV | Missense_Mutation | c.1908N>T | p.Arg636Ser | p.R636S | Q15283 | protein_coding | tolerated(0.11) | benign(0.217) | TCGA-AD-6889-01 | Colorectum | colon adenocarcinoma | Male | >=65 | I/II | Chemotherapy | xeloda | PD |
| Page: 1 2 3 4 5 6 7 8 |
Top |
Related drugs of malignant transformation related genes |
| Identification of chemicals and drugs interact with genes involved in malignant transfromation |
| (DGIdb 4.0) |
| Entrez ID | Symbol | Category | Interaction Types | Drug Claim Name | Drug Name | PMIDs |
| Page: 1 |

Copyright 2023-Present -The University of Texas Health Science Center at Houston |