
|
|||||
|
 | |
| |
| |
| |
| |
| |
|
Gene: RASA1 |
Gene summary for RASA1 |
| Gene information | Species | Human | Gene symbol | RASA1 | Gene ID | 5921 |
| Gene name | RAS p21 protein activator 1 | |
| Gene Alias | CM-AVM | |
| Cytomap | 5q14.3 | |
| Gene Type | protein-coding | GO ID | GO:0000278 | UniProtAcc | P20936 |
Top |
Malignant transformation analysis |
| Identification of the aberrant gene expression in precancerous and cancerous lesions by comparing the gene expression of stem-like cells in diseased tissues with normal stem cells |
| Entrez ID | Symbol | Replicates | Species | Organ | Tissue | Adj P-value | Log2FC | Malignancy |
| 5921 | RASA1 | CCI_2 | Human | Cervix | CC | 4.66e-14 | 1.14e+00 | 0.5249 |
| 5921 | RASA1 | CCI_3 | Human | Cervix | CC | 1.01e-08 | 6.15e-01 | 0.516 |
| 5921 | RASA1 | HTA11_3410_2000001011 | Human | Colorectum | AD | 3.14e-11 | -5.70e-01 | 0.0155 |
| 5921 | RASA1 | HTA11_866_2000001011 | Human | Colorectum | AD | 2.17e-02 | -2.81e-01 | -0.1001 |
| 5921 | RASA1 | HTA11_866_3004761011 | Human | Colorectum | AD | 1.89e-06 | -4.88e-01 | 0.096 |
| 5921 | RASA1 | HTA11_7696_3000711011 | Human | Colorectum | AD | 9.52e-06 | -3.88e-01 | 0.0674 |
| 5921 | RASA1 | HTA11_99999974143_84620 | Human | Colorectum | MSS | 2.88e-16 | -5.47e-01 | 0.3005 |
| 5921 | RASA1 | A015-C-203 | Human | Colorectum | FAP | 1.07e-27 | -4.09e-01 | -0.1294 |
| 5921 | RASA1 | A015-C-204 | Human | Colorectum | FAP | 1.99e-03 | -2.77e-01 | -0.0228 |
| 5921 | RASA1 | A014-C-040 | Human | Colorectum | FAP | 8.63e-03 | -3.28e-01 | -0.1184 |
| 5921 | RASA1 | A002-C-201 | Human | Colorectum | FAP | 4.15e-10 | -3.25e-01 | 0.0324 |
| 5921 | RASA1 | A002-C-203 | Human | Colorectum | FAP | 4.17e-02 | -1.43e-01 | 0.2786 |
| 5921 | RASA1 | A001-C-119 | Human | Colorectum | FAP | 5.27e-08 | -5.00e-01 | -0.1557 |
| 5921 | RASA1 | A001-C-108 | Human | Colorectum | FAP | 2.66e-19 | -3.48e-01 | -0.0272 |
| 5921 | RASA1 | A002-C-205 | Human | Colorectum | FAP | 1.22e-18 | -4.20e-01 | -0.1236 |
| 5921 | RASA1 | A001-C-104 | Human | Colorectum | FAP | 3.02e-04 | -2.22e-01 | 0.0184 |
| 5921 | RASA1 | A015-C-005 | Human | Colorectum | FAP | 1.54e-03 | -2.46e-01 | -0.0336 |
| 5921 | RASA1 | A015-C-006 | Human | Colorectum | FAP | 1.21e-14 | -5.53e-01 | -0.0994 |
| 5921 | RASA1 | A015-C-106 | Human | Colorectum | FAP | 1.12e-09 | -2.45e-01 | -0.0511 |
| 5921 | RASA1 | A002-C-114 | Human | Colorectum | FAP | 1.68e-17 | -4.28e-01 | -0.1561 |
| Page: 1 2 3 |
| Tissue | Expression Dynamics | Abbreviation |
| Cervix |  | CC: Cervix cancer |
| HSIL_HPV: HPV-infected high-grade squamous intraepithelial lesions | ||
| N_HPV: HPV-infected normal cervix | ||
| Colorectum (GSE201348) | 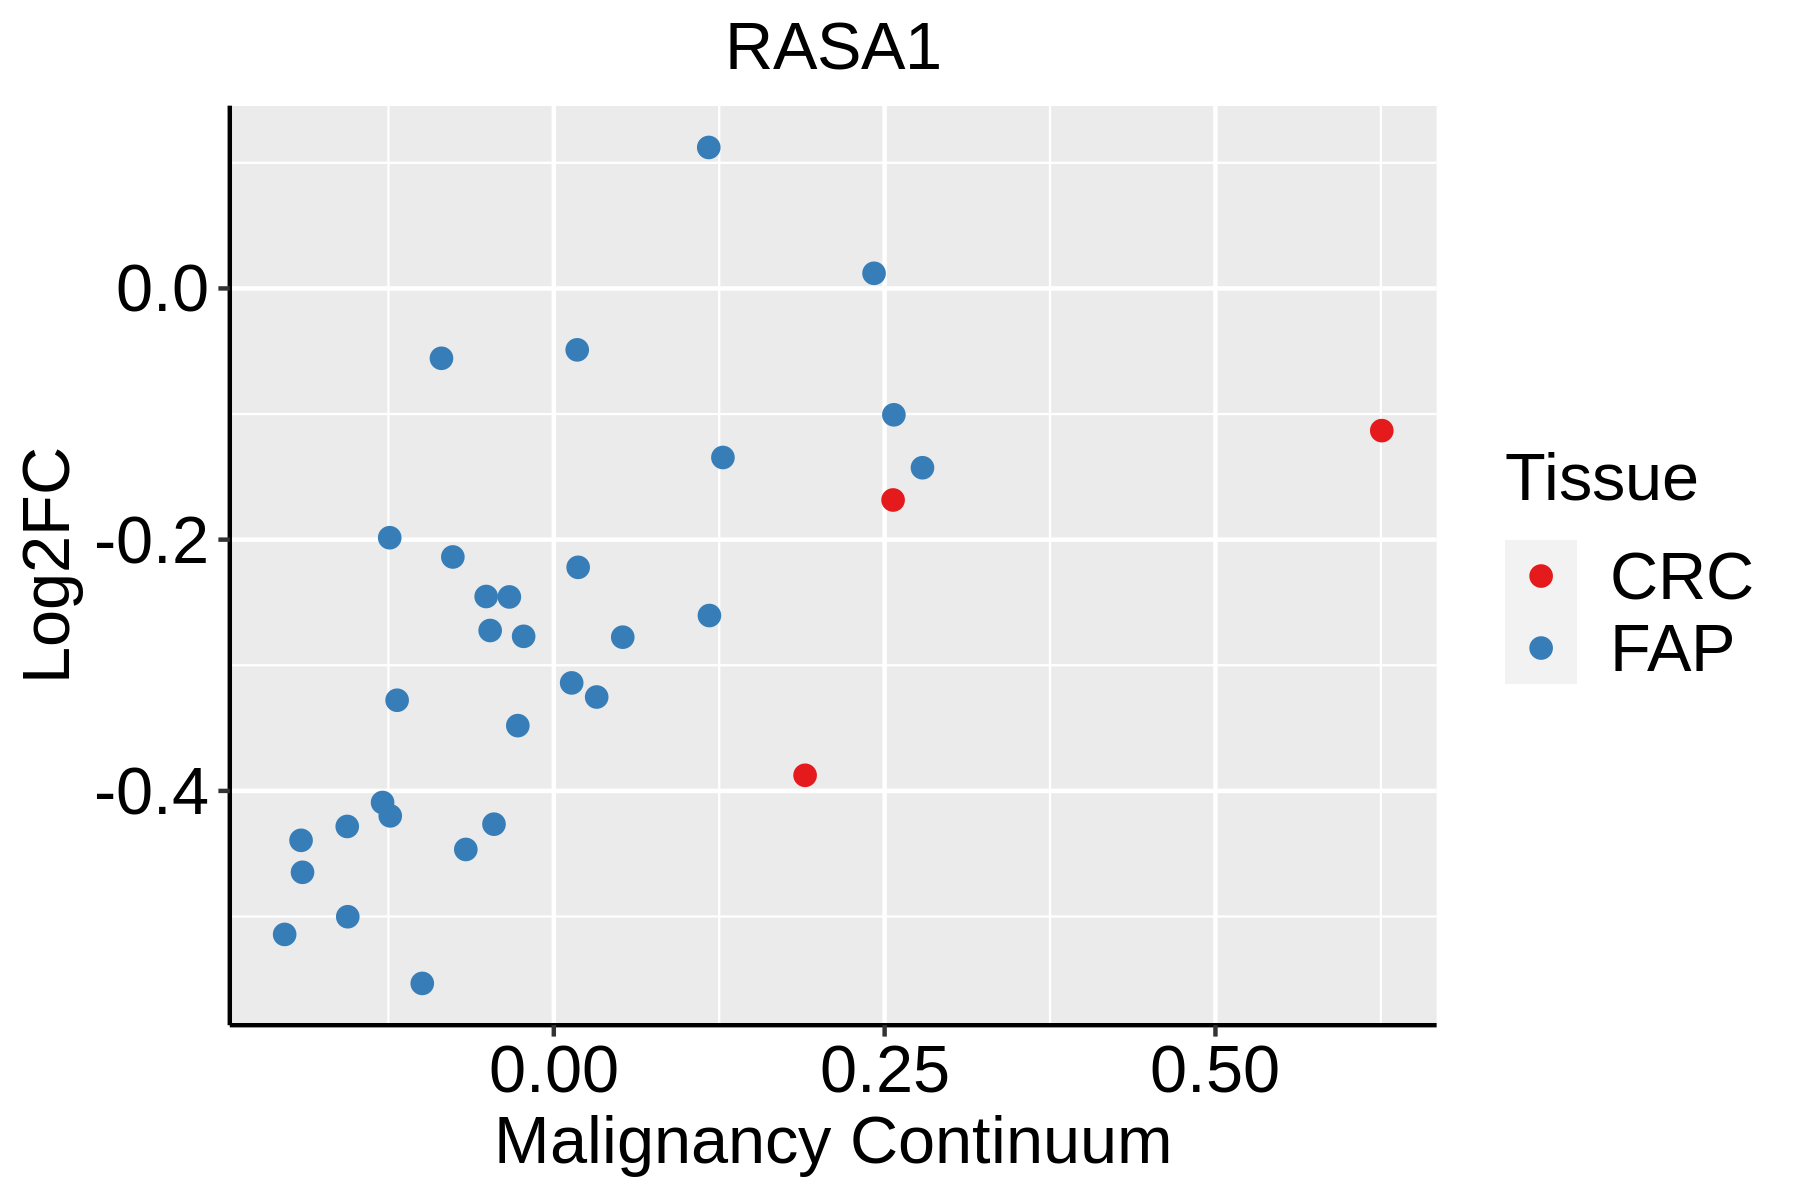 | FAP: Familial adenomatous polyposis |
| CRC: Colorectal cancer | ||
| Colorectum (HTA11) |  | AD: Adenomas |
| SER: Sessile serrated lesions | ||
| MSI-H: Microsatellite-high colorectal cancer | ||
| MSS: Microsatellite stable colorectal cancer | ||
| Skin | 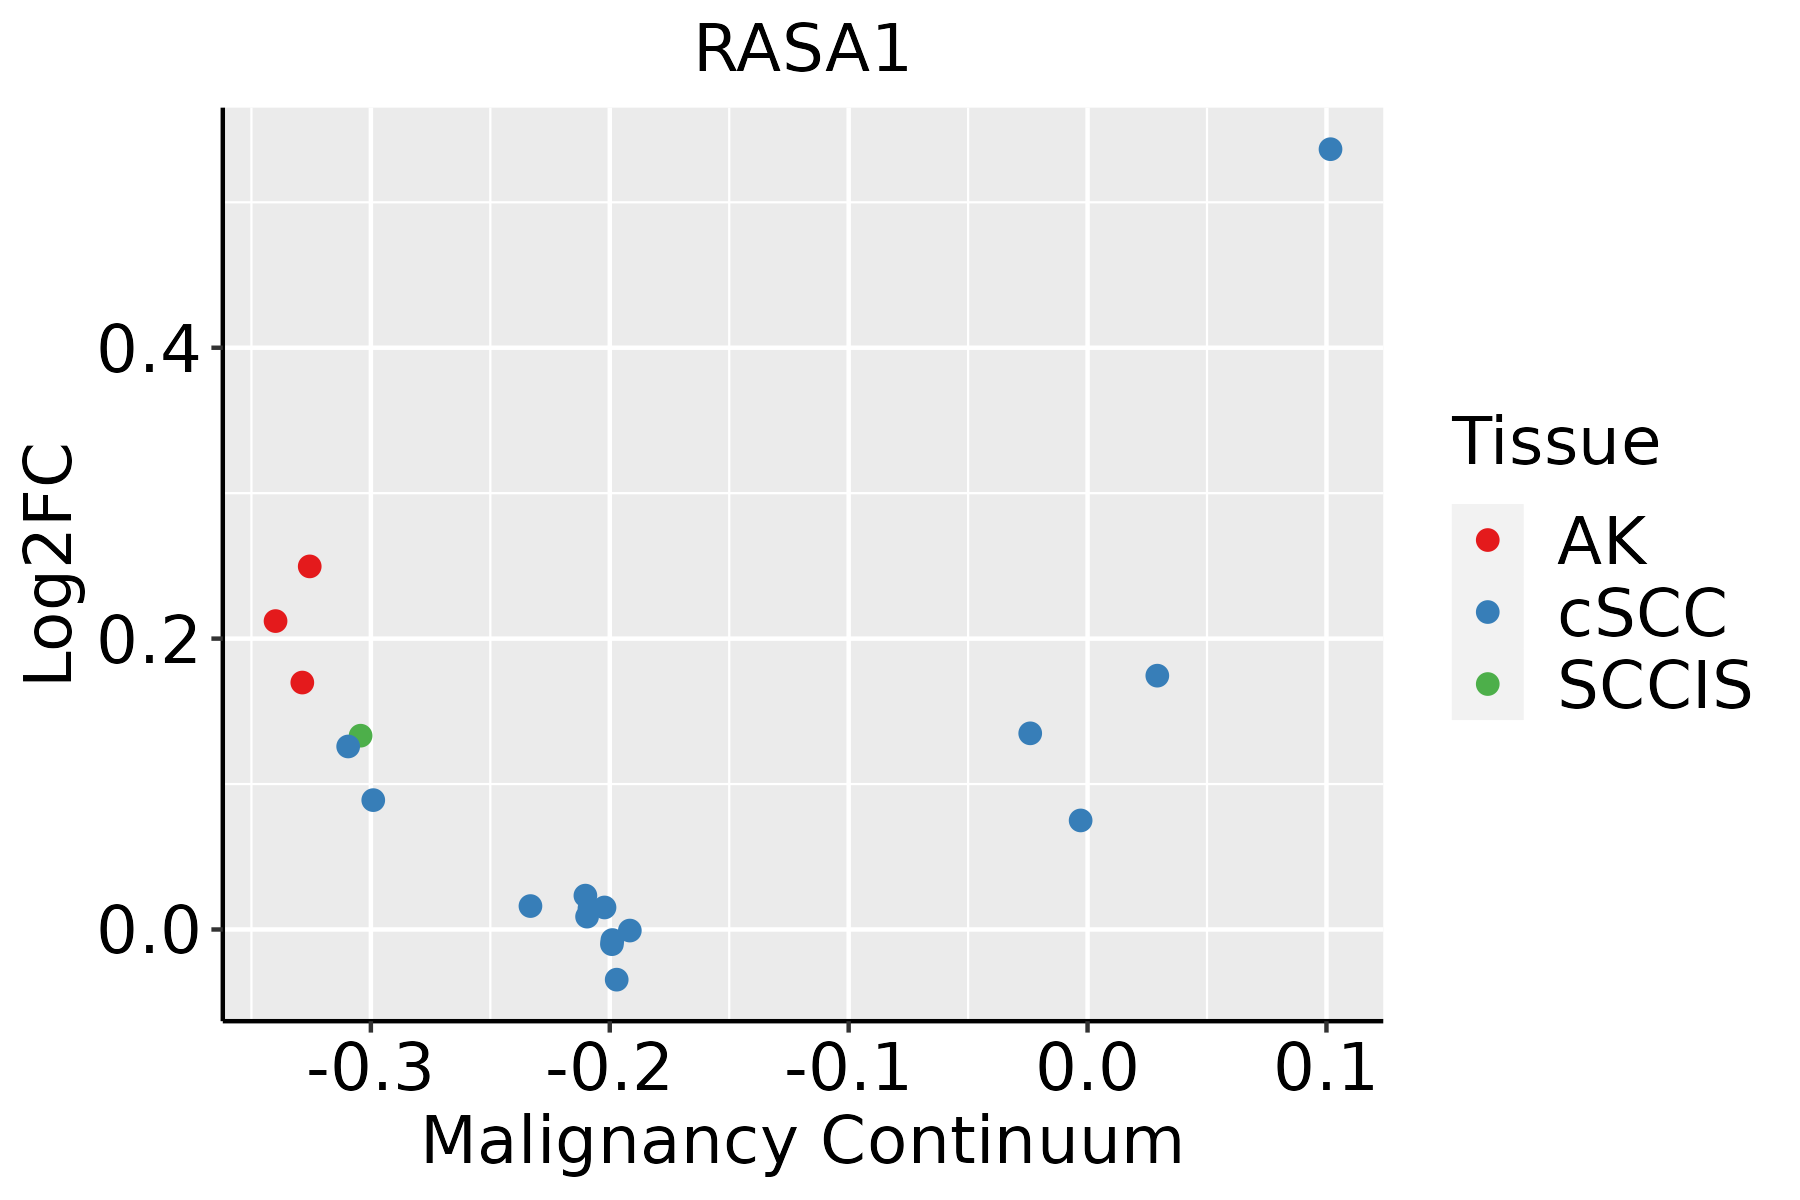 | AK: Actinic keratosis |
| cSCC: Cutaneous squamous cell carcinoma | ||
| SCCIS:squamous cell carcinoma in situ | ||
| Thyroid | 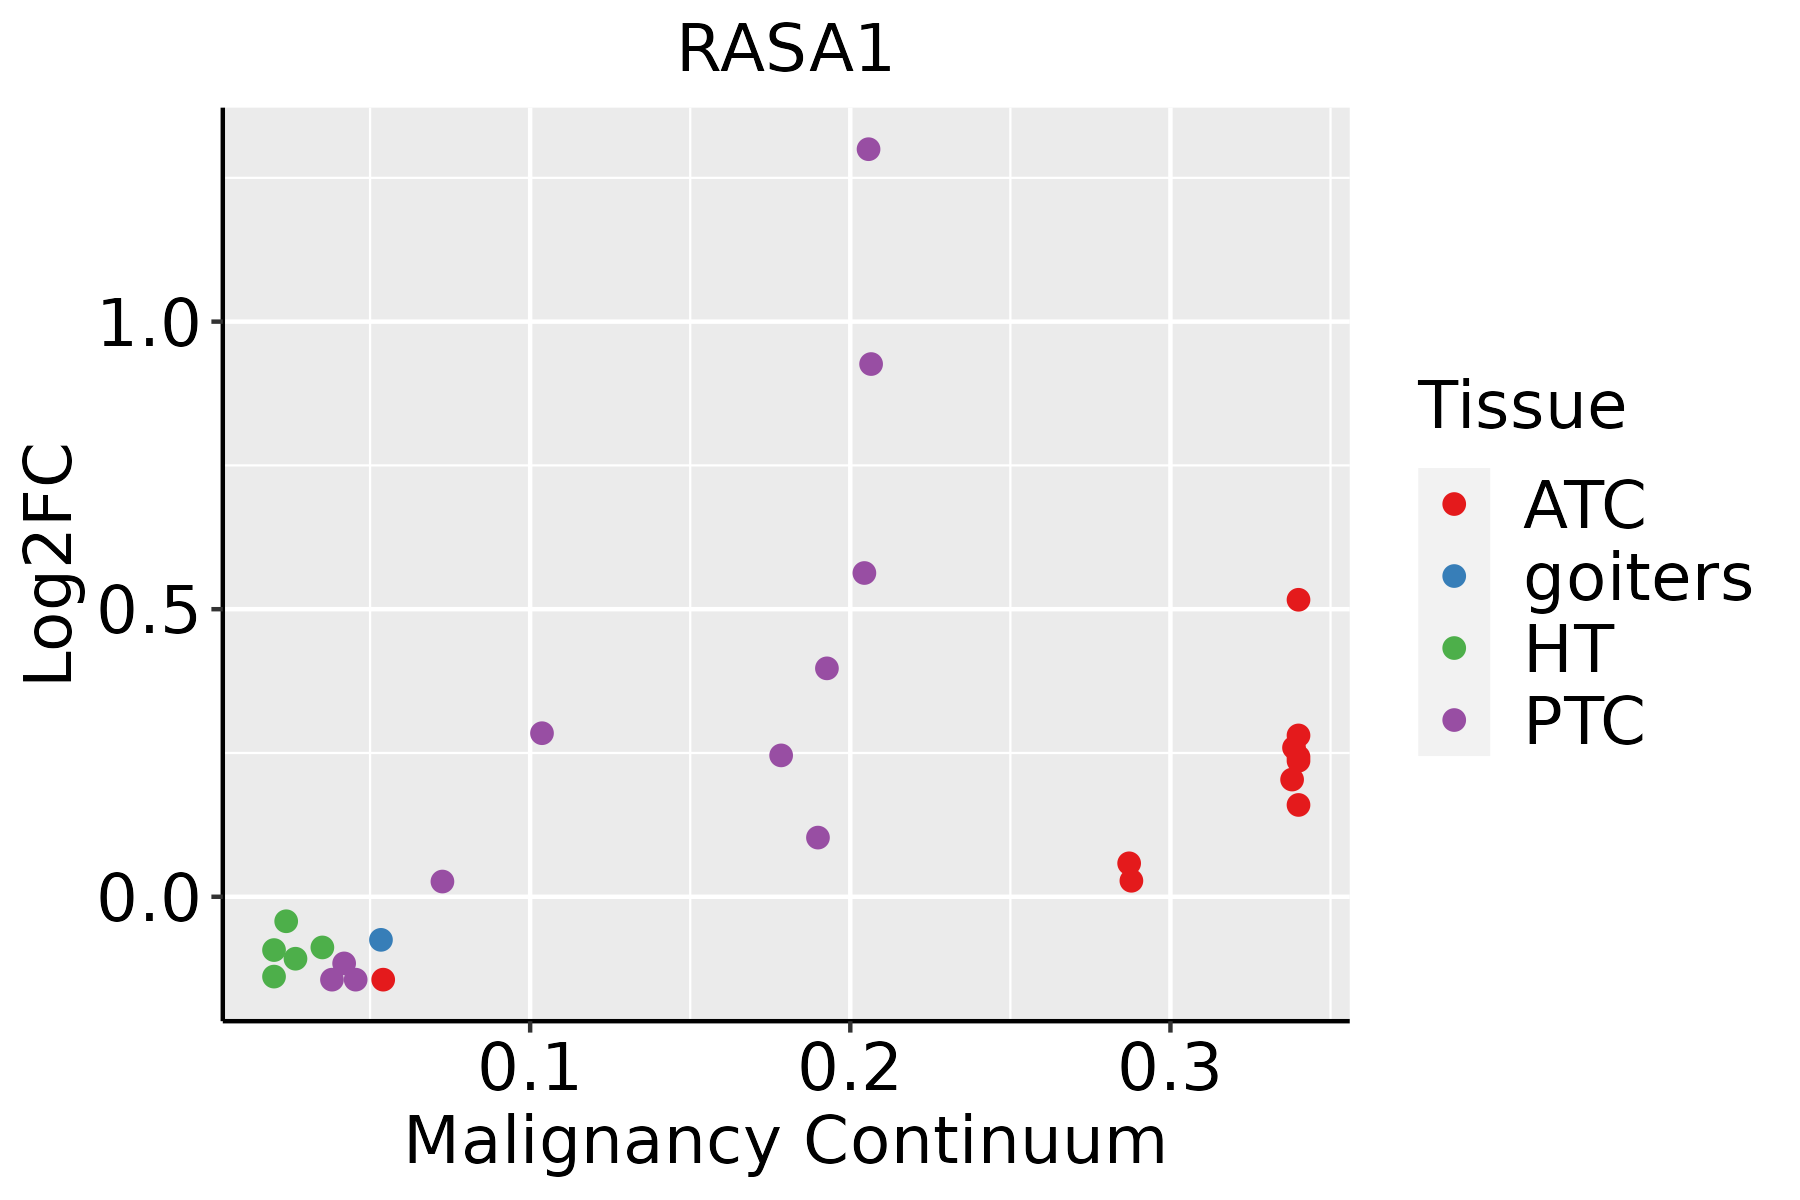 | ATC: Anaplastic thyroid cancer |
| HT: Hashimoto's thyroiditis | ||
| PTC: Papillary thyroid cancer |
| ∗log2FC in expression of this searched gene in stem-like cells from each diseased tissue sample relative to stem-like cells in normal samples in each tissue plotted against the malignancy continuum. Samples are colored based on if they are from different disease stage. |
Top |
Malignant transformation related pathway analysis |
| Find out the enriched GO biological processes and KEGG pathways involved in transition from healthy to precancer to cancer |
| Tissue | Disease Stage | Enriched GO biological Processes |
| Colorectum | AD |  |
| Colorectum | SER |  |
| Colorectum | MSS |  |
| Colorectum | MSI-H |  |
| Colorectum | FAP |  |
| ∗Top 15 enriched GO BP terms are showed in the bar plot of each disease state in each tissue. Each row represents a significant GO biological process which is colored according to the -log10(p.adjust). |
| Page: 1 2 3 4 5 6 7 8 9 |
| GO ID | Tissue | Disease Stage | Description | Gene Ratio | Bg Ratio | pvalue | p.adjust | Count |
| GO:001081010 | Cervix | CC | regulation of cell-substrate adhesion | 69/2311 | 221/18723 | 8.57e-14 | 5.69e-11 | 69 |
| GO:00315898 | Cervix | CC | cell-substrate adhesion | 96/2311 | 363/18723 | 1.48e-13 | 8.85e-11 | 96 |
| GO:000701510 | Cervix | CC | actin filament organization | 109/2311 | 442/18723 | 4.92e-13 | 2.45e-10 | 109 |
| GO:002260410 | Cervix | CC | regulation of cell morphogenesis | 84/2311 | 309/18723 | 1.00e-12 | 4.29e-10 | 84 |
| GO:003297010 | Cervix | CC | regulation of actin filament-based process | 96/2311 | 397/18723 | 4.00e-11 | 8.54e-09 | 96 |
| GO:190290310 | Cervix | CC | regulation of supramolecular fiber organization | 92/2311 | 383/18723 | 1.49e-10 | 2.48e-08 | 92 |
| GO:003295610 | Cervix | CC | regulation of actin cytoskeleton organization | 86/2311 | 358/18723 | 5.90e-10 | 7.51e-08 | 86 |
| GO:00510566 | Cervix | CC | regulation of small GTPase mediated signal transduction | 75/2311 | 302/18723 | 1.54e-09 | 1.74e-07 | 75 |
| GO:004325410 | Cervix | CC | regulation of protein-containing complex assembly | 96/2311 | 428/18723 | 2.91e-09 | 3.05e-07 | 96 |
| GO:00072656 | Cervix | CC | Ras protein signal transduction | 79/2311 | 337/18723 | 9.49e-09 | 7.77e-07 | 79 |
| GO:00019528 | Cervix | CC | regulation of cell-matrix adhesion | 40/2311 | 128/18723 | 1.32e-08 | 1.04e-06 | 40 |
| GO:00071608 | Cervix | CC | cell-matrix adhesion | 60/2311 | 233/18723 | 1.58e-08 | 1.23e-06 | 60 |
| GO:00071626 | Cervix | CC | negative regulation of cell adhesion | 72/2311 | 303/18723 | 2.36e-08 | 1.70e-06 | 72 |
| GO:011005310 | Cervix | CC | regulation of actin filament organization | 67/2311 | 278/18723 | 4.01e-08 | 2.54e-06 | 67 |
| GO:00430877 | Cervix | CC | regulation of GTPase activity | 79/2311 | 348/18723 | 4.21e-08 | 2.60e-06 | 79 |
| GO:005125810 | Cervix | CC | protein polymerization | 70/2311 | 297/18723 | 5.20e-08 | 3.11e-06 | 70 |
| GO:003227110 | Cervix | CC | regulation of protein polymerization | 57/2311 | 233/18723 | 2.37e-07 | 1.03e-05 | 57 |
| GO:00081549 | Cervix | CC | actin polymerization or depolymerization | 51/2311 | 218/18723 | 4.05e-06 | 1.05e-04 | 51 |
| GO:00300419 | Cervix | CC | actin filament polymerization | 45/2311 | 191/18723 | 1.20e-05 | 2.54e-04 | 45 |
| GO:00325359 | Cervix | CC | regulation of cellular component size | 76/2311 | 383/18723 | 1.66e-05 | 3.21e-04 | 76 |
| Page: 1 2 3 4 5 6 7 8 9 10 11 12 13 14 15 |
| Pathway ID | Tissue | Disease Stage | Description | Gene Ratio | Bg Ratio | pvalue | p.adjust | qvalue | Count |
| hsa043609 | Cervix | CC | Axon guidance | 47/1267 | 182/8465 | 8.13e-05 | 5.38e-04 | 3.18e-04 | 47 |
| hsa040142 | Cervix | CC | Ras signaling pathway | 51/1267 | 236/8465 | 3.55e-03 | 1.34e-02 | 7.91e-03 | 51 |
| hsa040109 | Cervix | CC | MAPK signaling pathway | 62/1267 | 302/8465 | 4.89e-03 | 1.67e-02 | 9.86e-03 | 62 |
| hsa0436012 | Cervix | CC | Axon guidance | 47/1267 | 182/8465 | 8.13e-05 | 5.38e-04 | 3.18e-04 | 47 |
| hsa0401411 | Cervix | CC | Ras signaling pathway | 51/1267 | 236/8465 | 3.55e-03 | 1.34e-02 | 7.91e-03 | 51 |
| hsa0401012 | Cervix | CC | MAPK signaling pathway | 62/1267 | 302/8465 | 4.89e-03 | 1.67e-02 | 9.86e-03 | 62 |
| hsa04360 | Colorectum | AD | Axon guidance | 61/2092 | 182/8465 | 4.36e-03 | 2.17e-02 | 1.38e-02 | 61 |
| hsa043601 | Colorectum | AD | Axon guidance | 61/2092 | 182/8465 | 4.36e-03 | 2.17e-02 | 1.38e-02 | 61 |
| hsa043602 | Colorectum | MSS | Axon guidance | 54/1875 | 182/8465 | 1.03e-02 | 3.69e-02 | 2.26e-02 | 54 |
| hsa043603 | Colorectum | MSS | Axon guidance | 54/1875 | 182/8465 | 1.03e-02 | 3.69e-02 | 2.26e-02 | 54 |
| hsa043604 | Colorectum | FAP | Axon guidance | 47/1404 | 182/8465 | 9.09e-04 | 5.20e-03 | 3.16e-03 | 47 |
| hsa04010 | Colorectum | FAP | MAPK signaling pathway | 68/1404 | 302/8465 | 4.00e-03 | 1.67e-02 | 1.02e-02 | 68 |
| hsa043605 | Colorectum | FAP | Axon guidance | 47/1404 | 182/8465 | 9.09e-04 | 5.20e-03 | 3.16e-03 | 47 |
| hsa040101 | Colorectum | FAP | MAPK signaling pathway | 68/1404 | 302/8465 | 4.00e-03 | 1.67e-02 | 1.02e-02 | 68 |
| hsa043606 | Colorectum | CRC | Axon guidance | 43/1091 | 182/8465 | 4.38e-05 | 8.70e-04 | 5.90e-04 | 43 |
| hsa04014 | Colorectum | CRC | Ras signaling pathway | 49/1091 | 236/8465 | 4.04e-04 | 4.50e-03 | 3.05e-03 | 49 |
| hsa040102 | Colorectum | CRC | MAPK signaling pathway | 56/1091 | 302/8465 | 2.76e-03 | 1.77e-02 | 1.20e-02 | 56 |
| hsa043607 | Colorectum | CRC | Axon guidance | 43/1091 | 182/8465 | 4.38e-05 | 8.70e-04 | 5.90e-04 | 43 |
| hsa040141 | Colorectum | CRC | Ras signaling pathway | 49/1091 | 236/8465 | 4.04e-04 | 4.50e-03 | 3.05e-03 | 49 |
| hsa040103 | Colorectum | CRC | MAPK signaling pathway | 56/1091 | 302/8465 | 2.76e-03 | 1.77e-02 | 1.20e-02 | 56 |
| Page: 1 |
Top |
Cell-cell communication analysis |
| Identification of potential cell-cell interactions between two cell types and their ligand-receptor pairs for different disease states |
| Ligand | Receptor | LRpair | Pathway | Tissue | Disease Stage |
| Page: 1 |
Top |
Single-cell gene regulatory network inference analysis |
| Find out the significant the regulons (TFs) and the target genes of each regulon across cell types for different disease states |
| TF | Cell Type | Tissue | Disease Stage | Target Gene | RSS | Regulon Activity |
| ∗The dot plots of a searched regulon are shown for all cell subpopulations in each disease state of each tissue based on the regulon specific score inferred using pySCENIC and by calculating the average expression. |
| Page: 1 |
Top |
Somatic mutation of malignant transformation related genes |
| Annotation of somatic variants for genes involved in malignant transformation |
| Hugo Symbol | Variant Class | Variant Classification | dbSNP RS | HGVSc | HGVSp | HGVSp Short | SWISSPROT | BIOTYPE | SIFT | PolyPhen | Tumor Sample Barcode | Tissue | Histology | Sex | Age | Stage | Therapy Types | Drugs | Outcome |
| RASA1 | SNV | Missense_Mutation | c.365N>T | p.Ser122Leu | p.S122L | P20936 | protein_coding | tolerated_low_confidence(0.2) | benign(0) | TCGA-A2-A0CT-01 | Breast | breast invasive carcinoma | Female | >=65 | I/II | Chemotherapy | cytoxan | SD | |
| RASA1 | SNV | Missense_Mutation | novel | c.956N>T | p.Trp319Leu | p.W319L | P20936 | protein_coding | deleterious(0) | probably_damaging(0.935) | TCGA-A7-A0DB-01 | Breast | breast invasive carcinoma | Female | <65 | I/II | Hormone Therapy | arimidex | SD |
| RASA1 | SNV | Missense_Mutation | c.733N>G | p.Arg245Gly | p.R245G | P20936 | protein_coding | deleterious(0.01) | possibly_damaging(0.893) | TCGA-A8-A07W-01 | Breast | breast invasive carcinoma | Female | >=65 | III/IV | Hormone Therapy | exemestane | SD | |
| RASA1 | SNV | Missense_Mutation | c.974N>G | p.Thr325Arg | p.T325R | P20936 | protein_coding | deleterious(0.02) | benign(0.347) | TCGA-C8-A12P-01 | Breast | breast invasive carcinoma | Female | <65 | I/II | Unknown | Unknown | SD | |
| RASA1 | insertion | In_Frame_Ins | novel | c.1969_1970insGTACTGGAAACC | p.Thr657delinsSerThrGlyAsnPro | p.T657delinsSTGNP | P20936 | protein_coding | TCGA-AR-A0U2-01 | Breast | breast invasive carcinoma | Female | <65 | III/IV | Hormone Therapy | tamoxiphen | PD | ||
| RASA1 | SNV | Missense_Mutation | c.581G>A | p.Arg194His | p.R194H | P20936 | protein_coding | deleterious(0) | probably_damaging(1) | TCGA-2W-A8YY-01 | Cervix | cervical & endocervical cancer | Female | <65 | I/II | Chemotherapy | cisplatin | CR | |
| RASA1 | SNV | Missense_Mutation | novel | c.2246G>A | p.Arg749Gln | p.R749Q | P20936 | protein_coding | deleterious(0.01) | probably_damaging(0.962) | TCGA-2W-A8YY-01 | Cervix | cervical & endocervical cancer | Female | <65 | I/II | Chemotherapy | cisplatin | CR |
| RASA1 | SNV | Missense_Mutation | novel | c.275C>G | p.Ala92Gly | p.A92G | P20936 | protein_coding | tolerated_low_confidence(0.44) | benign(0.003) | TCGA-DS-A1OB-01 | Cervix | cervical & endocervical cancer | Female | <65 | I/II | Chemotherapy | carboplatin | PD |
| RASA1 | SNV | Missense_Mutation | c.346N>T | p.Leu116Phe | p.L116F | P20936 | protein_coding | tolerated_low_confidence(0.31) | benign(0) | TCGA-DS-A1OC-01 | Cervix | cervical & endocervical cancer | Female | <65 | I/II | Chemotherapy | gemcitabine | SD | |
| RASA1 | SNV | Missense_Mutation | c.1345N>T | p.Val449Leu | p.V449L | P20936 | protein_coding | tolerated(0.22) | benign(0.003) | TCGA-FU-A3HZ-01 | Cervix | cervical & endocervical cancer | Female | <65 | I/II | Chemotherapy | cisplatin | CR |
| Page: 1 2 3 4 5 6 7 8 9 10 11 12 13 14 15 |
Top |
Related drugs of malignant transformation related genes |
| Identification of chemicals and drugs interact with genes involved in malignant transfromation |
| (DGIdb 4.0) |
| Entrez ID | Symbol | Category | Interaction Types | Drug Claim Name | Drug Name | PMIDs |
| 5921 | RASA1 | CLINICALLY ACTIONABLE | TRAMETINIB | TRAMETINIB | 29127119 |
| Page: 1 |

Copyright 2023-Present -The University of Texas Health Science Center at Houston |