
|
|||||
|
 | |
| |
| |
| |
| |
| |
|
Gene: RARS2 |
Gene summary for RARS2 |
| Gene information | Species | Human | Gene symbol | RARS2 | Gene ID | 57038 |
| Gene name | arginyl-tRNA synthetase 2, mitochondrial | |
| Gene Alias | ArgRS | |
| Cytomap | 6q15 | |
| Gene Type | protein-coding | GO ID | GO:0006082 | UniProtAcc | H0UI22 |
Top |
Malignant transformation analysis |
| Identification of the aberrant gene expression in precancerous and cancerous lesions by comparing the gene expression of stem-like cells in diseased tissues with normal stem cells |
| Entrez ID | Symbol | Replicates | Species | Organ | Tissue | Adj P-value | Log2FC | Malignancy |
| 57038 | RARS2 | LZE4T | Human | Esophagus | ESCC | 4.92e-07 | 1.40e-01 | 0.0811 |
| 57038 | RARS2 | LZE24T | Human | Esophagus | ESCC | 3.30e-07 | 1.71e-01 | 0.0596 |
| 57038 | RARS2 | P1T-E | Human | Esophagus | ESCC | 3.25e-05 | 1.76e-01 | 0.0875 |
| 57038 | RARS2 | P2T-E | Human | Esophagus | ESCC | 5.49e-09 | 1.77e-01 | 0.1177 |
| 57038 | RARS2 | P4T-E | Human | Esophagus | ESCC | 3.31e-15 | 3.25e-01 | 0.1323 |
| 57038 | RARS2 | P5T-E | Human | Esophagus | ESCC | 1.02e-09 | 1.54e-01 | 0.1327 |
| 57038 | RARS2 | P8T-E | Human | Esophagus | ESCC | 2.74e-24 | 1.76e-01 | 0.0889 |
| 57038 | RARS2 | P9T-E | Human | Esophagus | ESCC | 5.04e-03 | 1.07e-01 | 0.1131 |
| 57038 | RARS2 | P10T-E | Human | Esophagus | ESCC | 3.33e-15 | 2.57e-01 | 0.116 |
| 57038 | RARS2 | P11T-E | Human | Esophagus | ESCC | 1.53e-10 | 3.26e-01 | 0.1426 |
| 57038 | RARS2 | P12T-E | Human | Esophagus | ESCC | 7.00e-13 | 2.15e-01 | 0.1122 |
| 57038 | RARS2 | P15T-E | Human | Esophagus | ESCC | 1.06e-12 | 1.56e-01 | 0.1149 |
| 57038 | RARS2 | P16T-E | Human | Esophagus | ESCC | 4.48e-14 | 2.50e-01 | 0.1153 |
| 57038 | RARS2 | P20T-E | Human | Esophagus | ESCC | 7.84e-06 | 1.19e-01 | 0.1124 |
| 57038 | RARS2 | P21T-E | Human | Esophagus | ESCC | 3.71e-20 | 4.13e-01 | 0.1617 |
| 57038 | RARS2 | P22T-E | Human | Esophagus | ESCC | 1.29e-10 | 3.88e-02 | 0.1236 |
| 57038 | RARS2 | P23T-E | Human | Esophagus | ESCC | 2.24e-17 | 2.74e-01 | 0.108 |
| 57038 | RARS2 | P24T-E | Human | Esophagus | ESCC | 3.04e-17 | 2.56e-01 | 0.1287 |
| 57038 | RARS2 | P26T-E | Human | Esophagus | ESCC | 4.73e-13 | 1.51e-01 | 0.1276 |
| 57038 | RARS2 | P27T-E | Human | Esophagus | ESCC | 4.65e-11 | 1.79e-01 | 0.1055 |
| Page: 1 2 3 4 5 6 |
| Tissue | Expression Dynamics | Abbreviation |
| Esophagus | 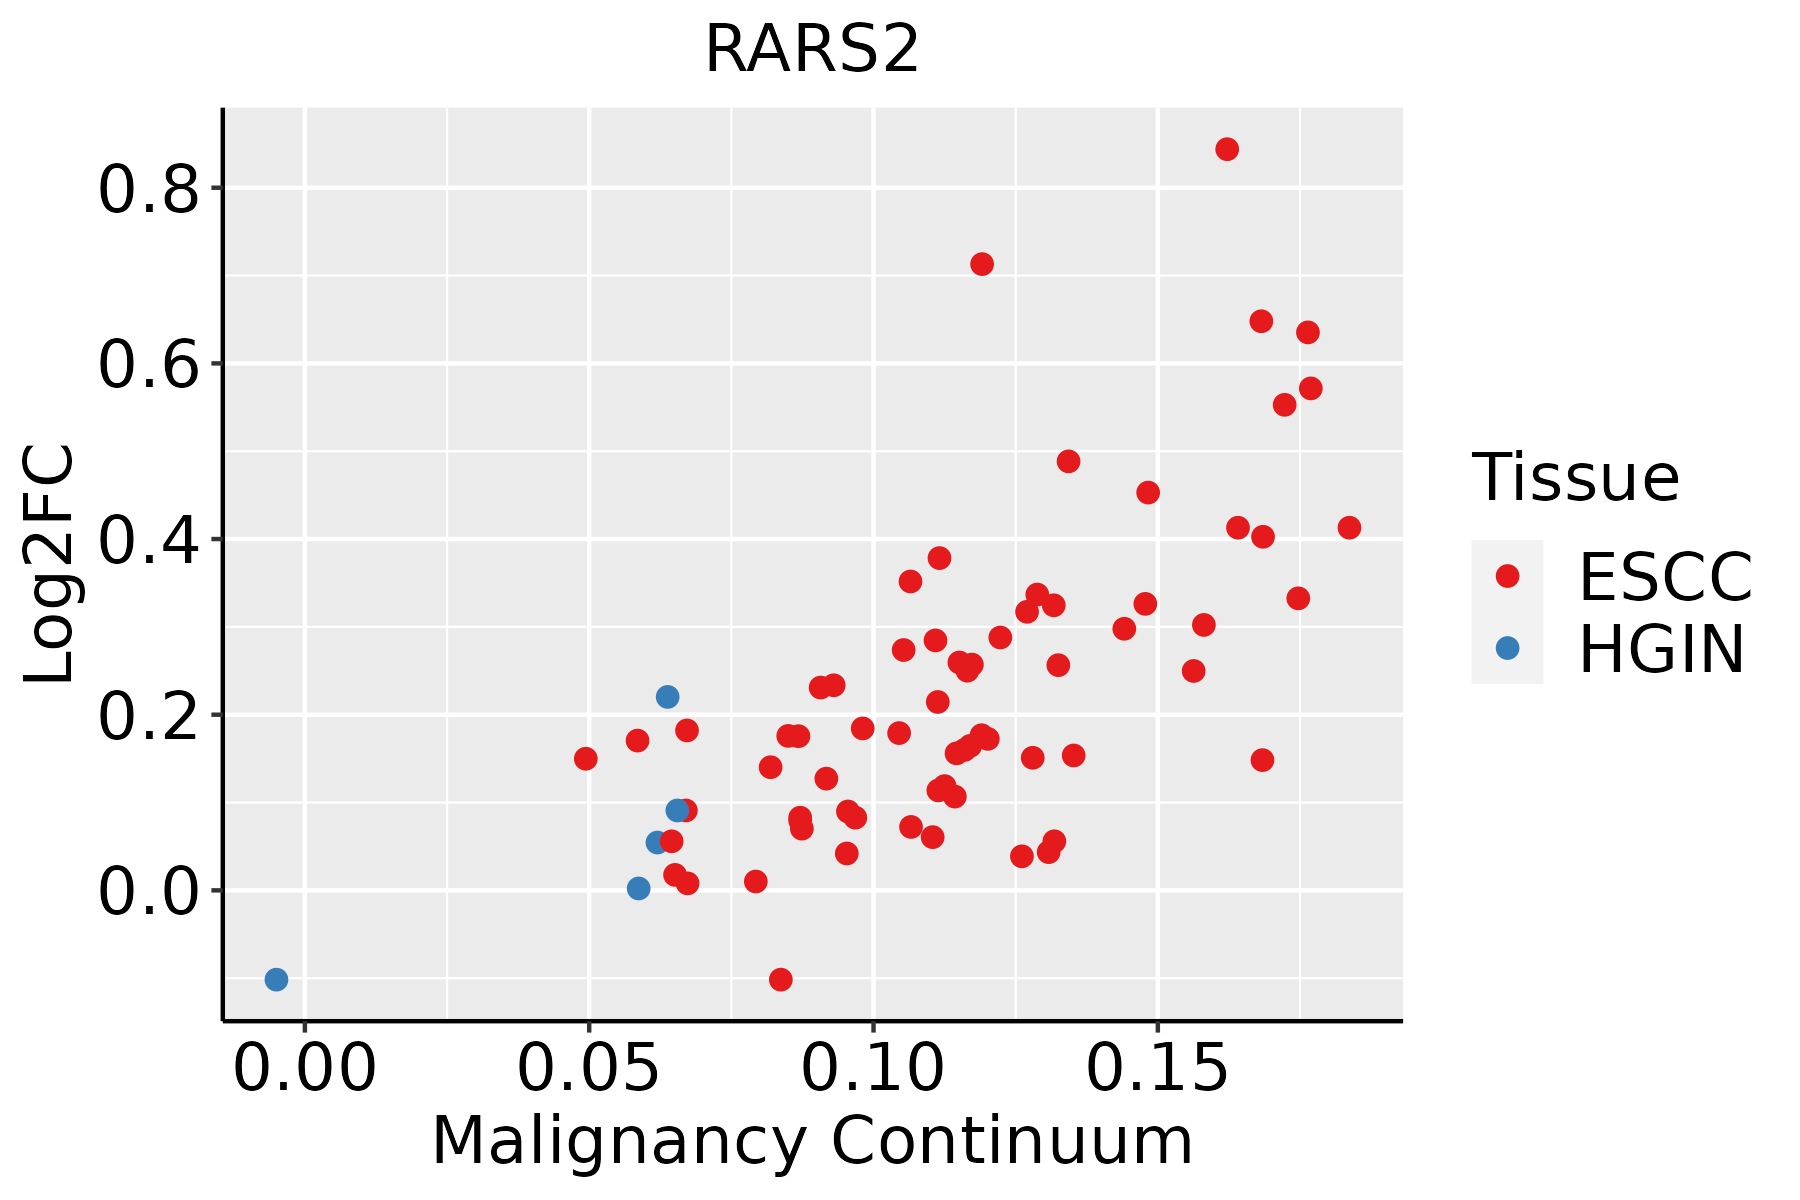 | ESCC: Esophageal squamous cell carcinoma |
| HGIN: High-grade intraepithelial neoplasias | ||
| LGIN: Low-grade intraepithelial neoplasias | ||
| Liver | 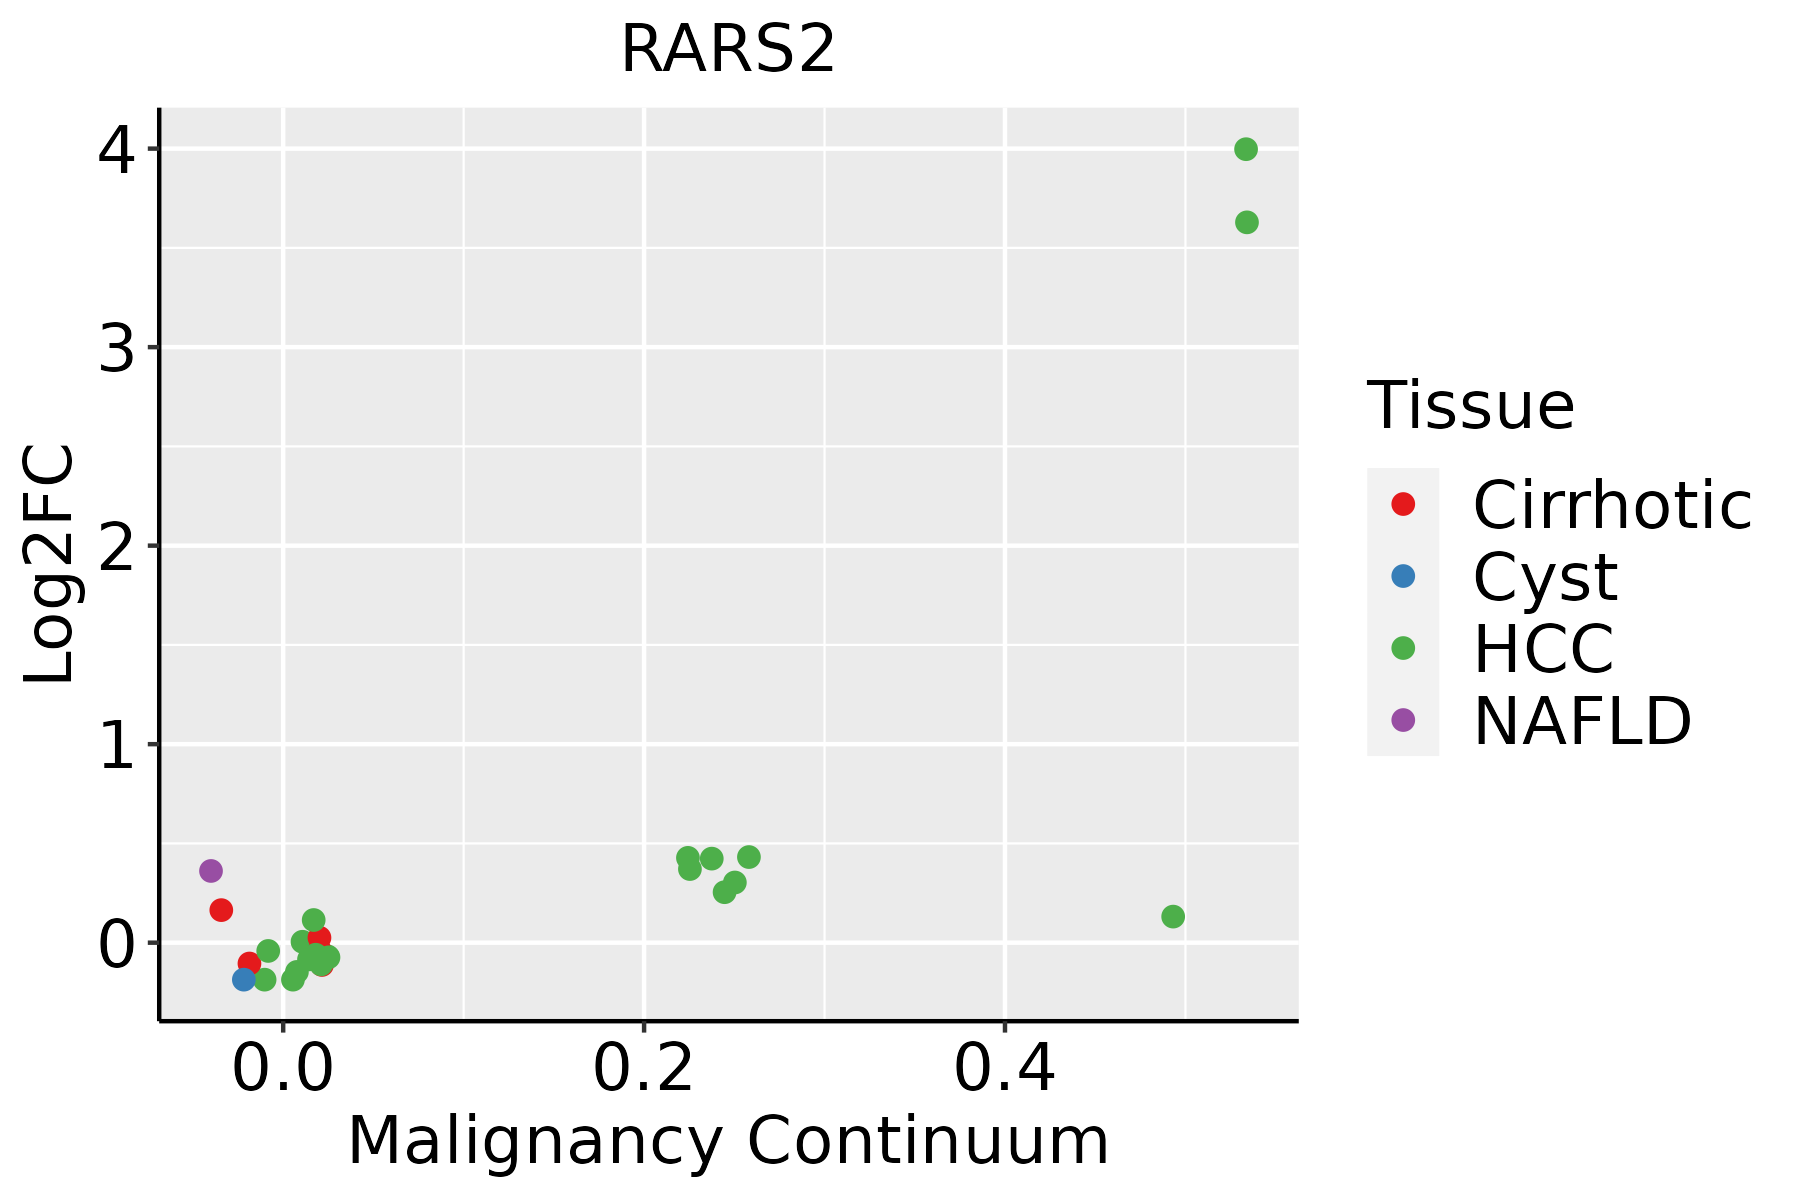 | HCC: Hepatocellular carcinoma |
| NAFLD: Non-alcoholic fatty liver disease | ||
| Oral Cavity |  | EOLP: Erosive Oral lichen planus |
| LP: leukoplakia | ||
| NEOLP: Non-erosive oral lichen planus | ||
| OSCC: Oral squamous cell carcinoma | ||
| Skin | 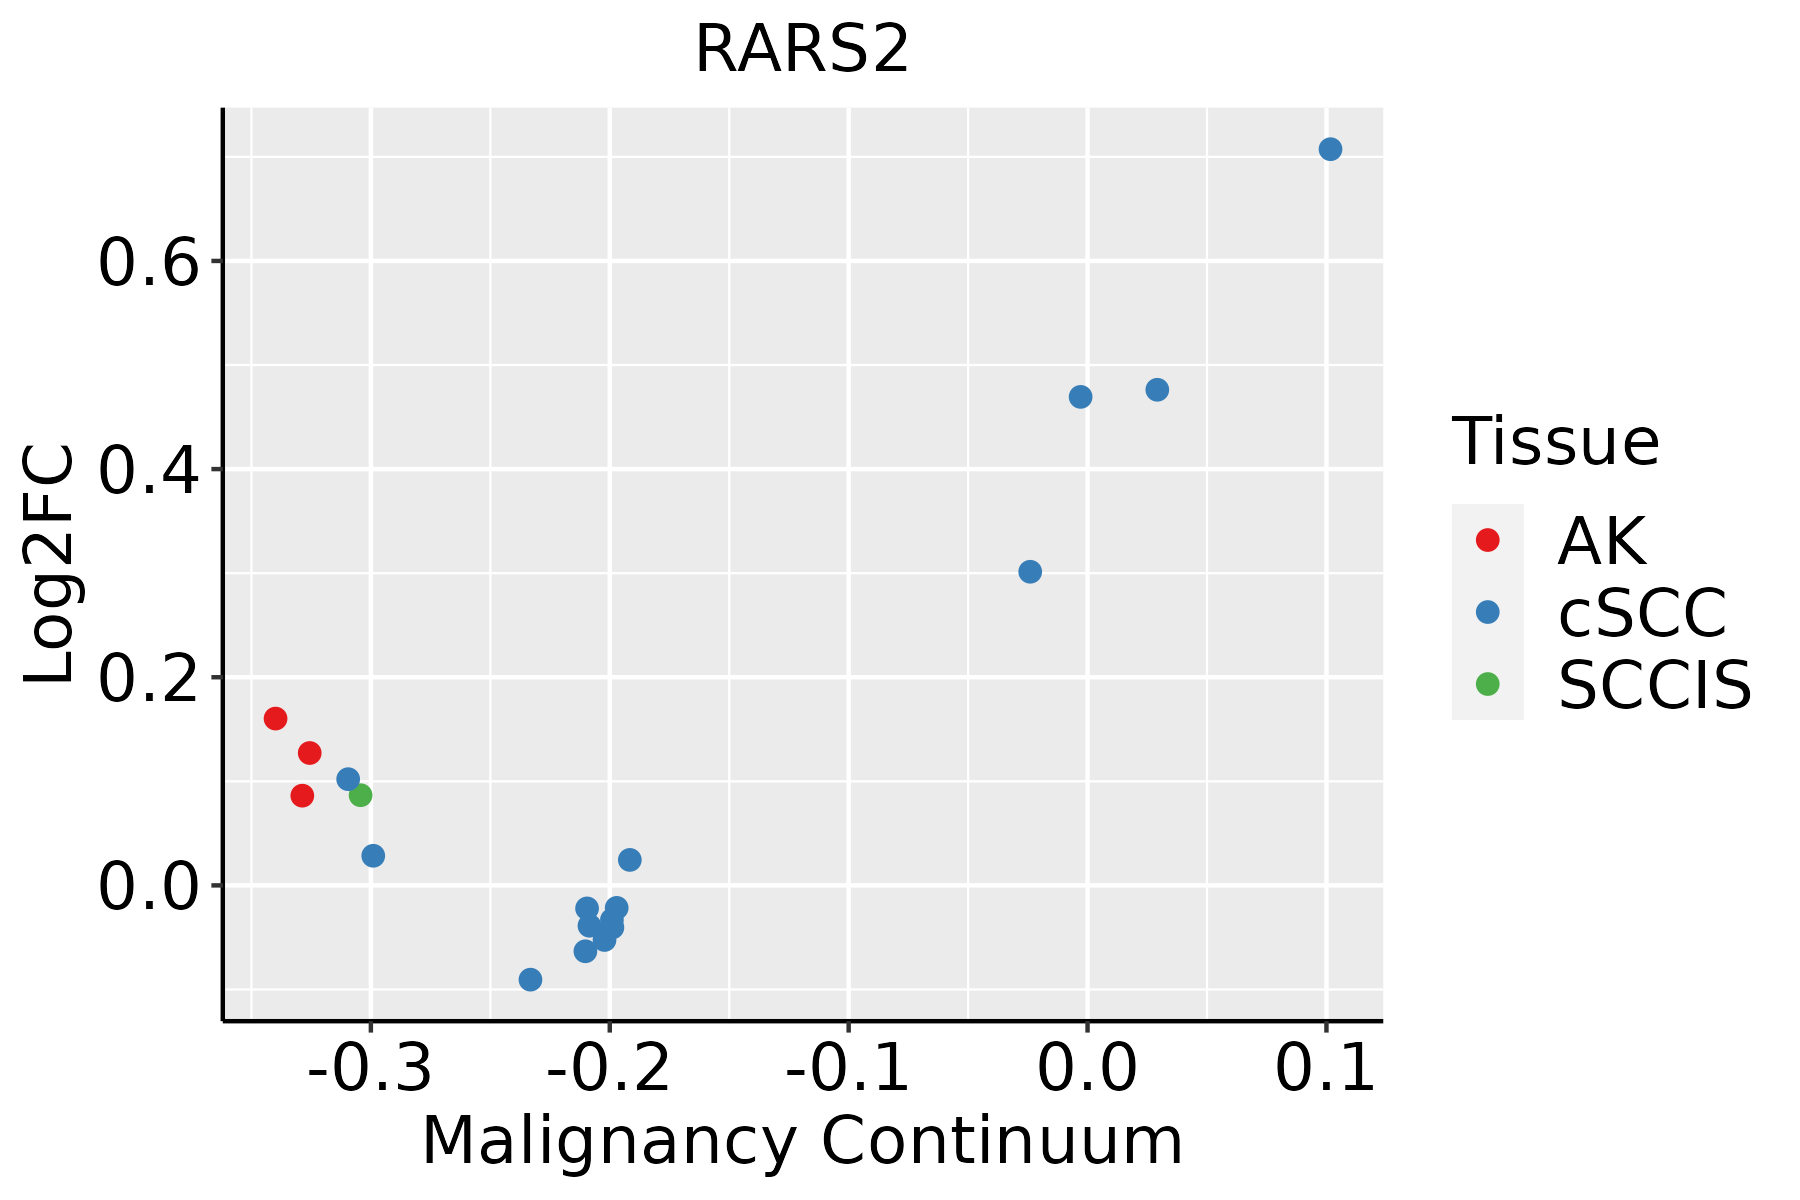 | AK: Actinic keratosis |
| cSCC: Cutaneous squamous cell carcinoma | ||
| SCCIS:squamous cell carcinoma in situ | ||
| Thyroid | 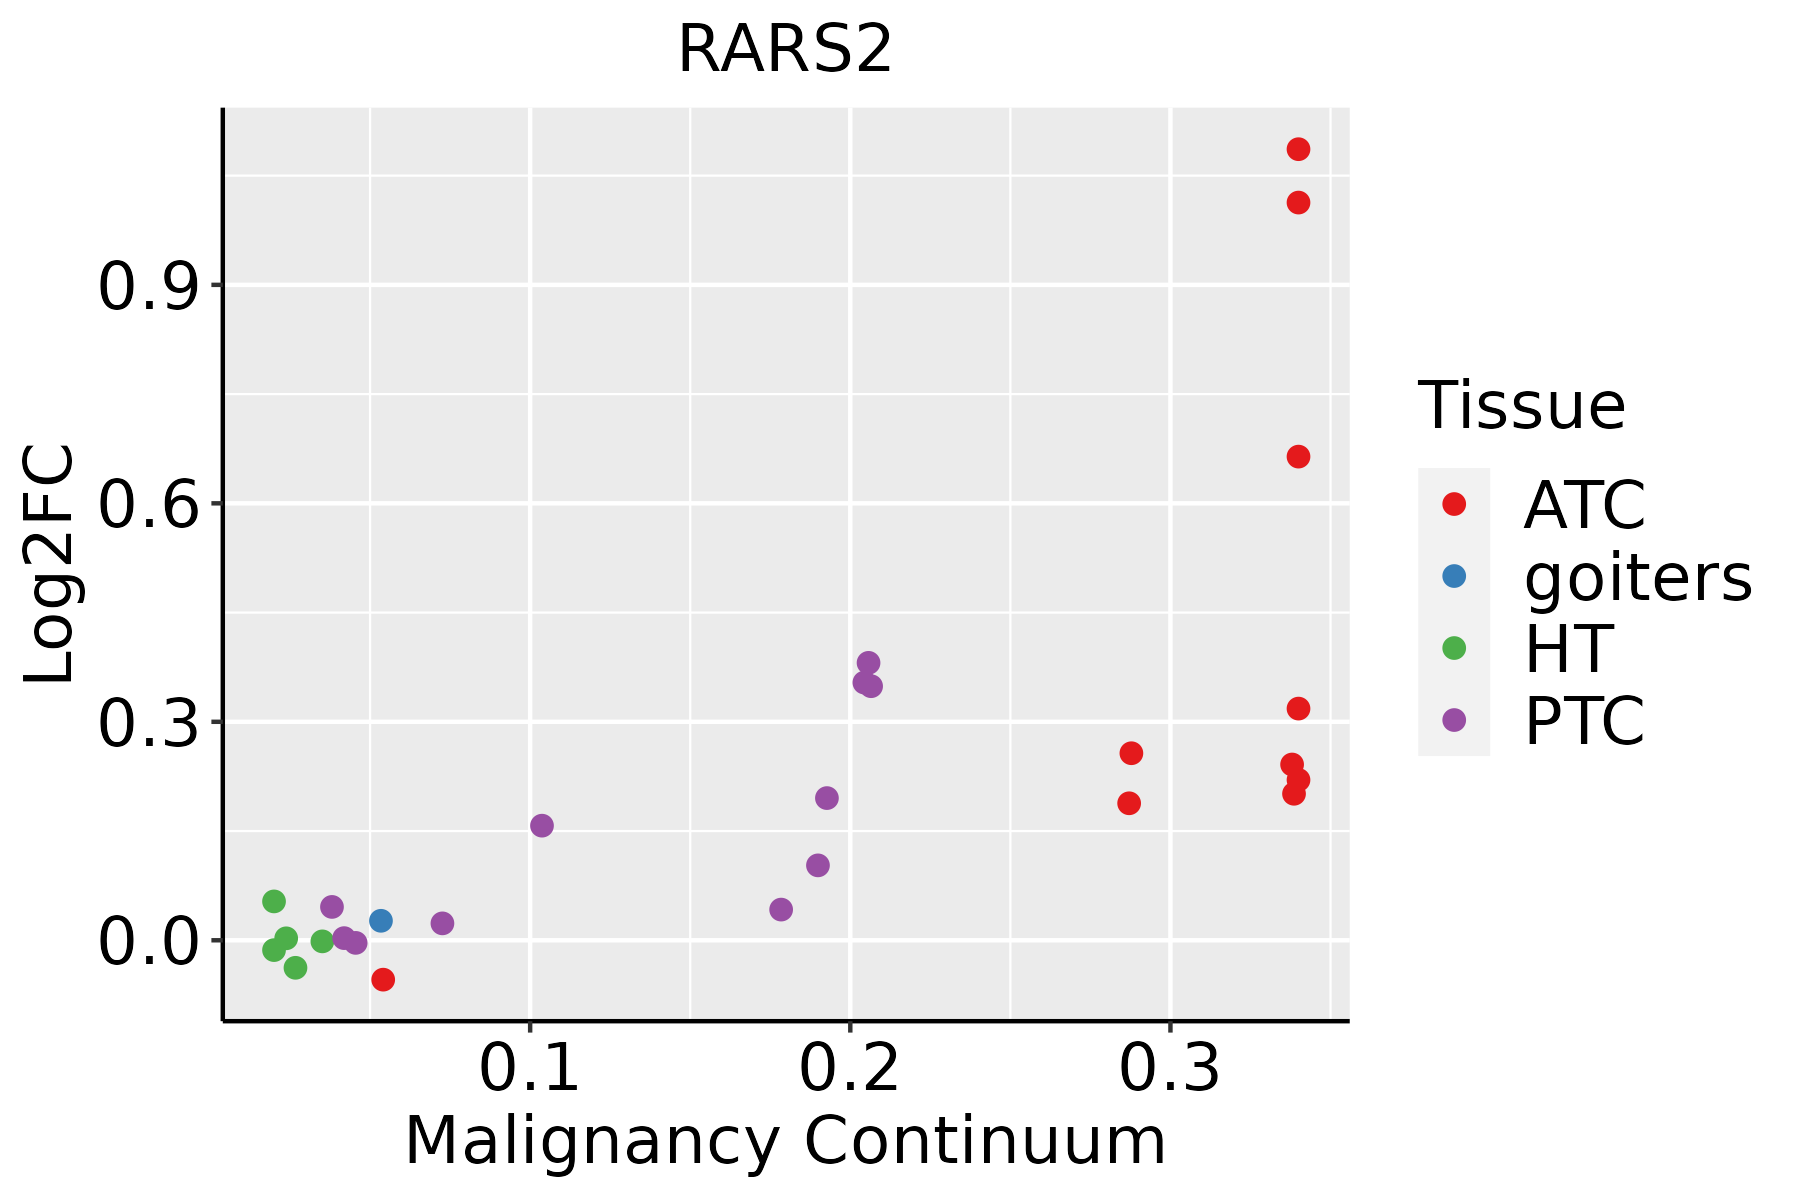 | ATC: Anaplastic thyroid cancer |
| HT: Hashimoto's thyroiditis | ||
| PTC: Papillary thyroid cancer |
| ∗log2FC in expression of this searched gene in stem-like cells from each diseased tissue sample relative to stem-like cells in normal samples in each tissue plotted against the malignancy continuum. Samples are colored based on if they are from different disease stage. |
Top |
Malignant transformation related pathway analysis |
| Find out the enriched GO biological processes and KEGG pathways involved in transition from healthy to precancer to cancer |
| Tissue | Disease Stage | Enriched GO biological Processes |
| Colorectum | AD |  |
| Colorectum | SER |  |
| Colorectum | MSS |  |
| Colorectum | MSI-H |  |
| Colorectum | FAP |  |
| ∗Top 15 enriched GO BP terms are showed in the bar plot of each disease state in each tissue. Each row represents a significant GO biological process which is colored according to the -log10(p.adjust). |
| Page: 1 2 3 4 5 6 7 8 9 |
| GO ID | Tissue | Disease Stage | Description | Gene Ratio | Bg Ratio | pvalue | p.adjust | Count |
| GO:003466012 | Esophagus | ESCC | ncRNA metabolic process | 346/8552 | 485/18723 | 4.35e-31 | 2.51e-28 | 346 |
| GO:014005313 | Esophagus | ESCC | mitochondrial gene expression | 93/8552 | 108/18723 | 1.96e-18 | 2.03e-16 | 93 |
| GO:003254314 | Esophagus | ESCC | mitochondrial translation | 68/8552 | 76/18723 | 1.02e-15 | 6.86e-14 | 68 |
| GO:00063992 | Esophagus | ESCC | tRNA metabolic process | 122/8552 | 179/18723 | 9.03e-10 | 2.19e-08 | 122 |
| GO:00346601 | Liver | HCC | ncRNA metabolic process | 332/7958 | 485/18723 | 1.48e-31 | 7.80e-29 | 332 |
| GO:01400531 | Liver | HCC | mitochondrial gene expression | 82/7958 | 108/18723 | 1.49e-12 | 7.20e-11 | 82 |
| GO:00325431 | Liver | HCC | mitochondrial translation | 62/7958 | 76/18723 | 2.95e-12 | 1.34e-10 | 62 |
| GO:00065202 | Liver | HCC | cellular amino acid metabolic process | 167/7958 | 284/18723 | 1.91e-08 | 4.56e-07 | 167 |
| GO:0006399 | Liver | HCC | tRNA metabolic process | 108/7958 | 179/18723 | 1.07e-06 | 1.59e-05 | 108 |
| GO:00346605 | Oral cavity | OSCC | ncRNA metabolic process | 296/7305 | 485/18723 | 2.94e-23 | 6.65e-21 | 296 |
| GO:01400533 | Oral cavity | OSCC | mitochondrial gene expression | 78/7305 | 108/18723 | 2.37e-12 | 9.86e-11 | 78 |
| GO:00325434 | Oral cavity | OSCC | mitochondrial translation | 59/7305 | 76/18723 | 7.21e-12 | 2.70e-10 | 59 |
| GO:00063991 | Oral cavity | OSCC | tRNA metabolic process | 101/7305 | 179/18723 | 1.65e-06 | 2.15e-05 | 101 |
| GO:00346607 | Skin | AK | ncRNA metabolic process | 75/1910 | 485/18723 | 1.64e-04 | 1.93e-03 | 75 |
| GO:003466013 | Skin | cSCC | ncRNA metabolic process | 234/4864 | 485/18723 | 1.37e-26 | 4.77e-24 | 234 |
| GO:00325436 | Skin | cSCC | mitochondrial translation | 47/4864 | 76/18723 | 4.70e-11 | 2.22e-09 | 47 |
| GO:01400535 | Skin | cSCC | mitochondrial gene expression | 56/4864 | 108/18723 | 8.06e-09 | 2.56e-07 | 56 |
| GO:00063993 | Skin | cSCC | tRNA metabolic process | 64/4864 | 179/18723 | 2.34e-03 | 1.36e-02 | 64 |
| GO:00346608 | Thyroid | PTC | ncRNA metabolic process | 239/5968 | 485/18723 | 5.54e-16 | 4.26e-14 | 239 |
| GO:01400536 | Thyroid | PTC | mitochondrial gene expression | 51/5968 | 108/18723 | 6.04e-04 | 3.83e-03 | 51 |
| Page: 1 2 |
| Pathway ID | Tissue | Disease Stage | Description | Gene Ratio | Bg Ratio | pvalue | p.adjust | qvalue | Count |
| Page: 1 |
Top |
Cell-cell communication analysis |
| Identification of potential cell-cell interactions between two cell types and their ligand-receptor pairs for different disease states |
| Ligand | Receptor | LRpair | Pathway | Tissue | Disease Stage |
| Page: 1 |
Top |
Single-cell gene regulatory network inference analysis |
| Find out the significant the regulons (TFs) and the target genes of each regulon across cell types for different disease states |
| TF | Cell Type | Tissue | Disease Stage | Target Gene | RSS | Regulon Activity |
| ∗The dot plots of a searched regulon are shown for all cell subpopulations in each disease state of each tissue based on the regulon specific score inferred using pySCENIC and by calculating the average expression. |
| Page: 1 |
Top |
Somatic mutation of malignant transformation related genes |
| Annotation of somatic variants for genes involved in malignant transformation |
| Hugo Symbol | Variant Class | Variant Classification | dbSNP RS | HGVSc | HGVSp | HGVSp Short | SWISSPROT | BIOTYPE | SIFT | PolyPhen | Tumor Sample Barcode | Tissue | Histology | Sex | Age | Stage | Therapy Types | Drugs | Outcome |
| RARS2 | SNV | Missense_Mutation | c.622N>A | p.Gln208Lys | p.Q208K | Q5T160 | protein_coding | tolerated(0.4) | benign(0.017) | TCGA-A8-A08H-01 | Breast | breast invasive carcinoma | Female | >=65 | I/II | Unknown | Unknown | SD | |
| RARS2 | SNV | Missense_Mutation | rs201899366 | c.16C>T | p.Arg6Cys | p.R6C | Q5T160 | protein_coding | deleterious(0) | possibly_damaging(0.635) | TCGA-AO-A0J9-01 | Breast | breast invasive carcinoma | Female | <65 | III/IV | Chemotherapy | cyclophosphamide | PD |
| RARS2 | SNV | Missense_Mutation | rs201899366 | c.16N>T | p.Arg6Cys | p.R6C | Q5T160 | protein_coding | deleterious(0) | possibly_damaging(0.635) | TCGA-BH-A0B6-01 | Breast | breast invasive carcinoma | Female | <65 | I/II | Unknown | Unknown | SD |
| RARS2 | SNV | Missense_Mutation | rs201899366 | c.16N>T | p.Arg6Cys | p.R6C | Q5T160 | protein_coding | deleterious(0) | possibly_damaging(0.635) | TCGA-D8-A73U-01 | Breast | breast invasive carcinoma | Female | >=65 | I/II | Hormone Therapy | tamoxiphen | SD |
| RARS2 | SNV | Missense_Mutation | c.95C>A | p.Pro32Gln | p.P32Q | Q5T160 | protein_coding | deleterious(0.01) | possibly_damaging(0.481) | TCGA-E2-A15G-01 | Breast | breast invasive carcinoma | Female | >=65 | I/II | Hormone Therapy | arimidex | SD | |
| RARS2 | insertion | Nonsense_Mutation | novel | c.625_626insAGATGGTGTTAGCATATCCCTCCTAGAA | p.Val209GlufsTer9 | p.V209Efs*9 | Q5T160 | protein_coding | TCGA-A2-A0CU-01 | Breast | breast invasive carcinoma | Female | >=65 | I/II | Hormone Therapy | tamoxiphen | SD | ||
| RARS2 | SNV | Missense_Mutation | novel | c.600G>T | p.Gln200His | p.Q200H | Q5T160 | protein_coding | tolerated(0.06) | benign(0.316) | TCGA-2W-A8YY-01 | Cervix | cervical & endocervical cancer | Female | <65 | I/II | Chemotherapy | cisplatin | CR |
| RARS2 | SNV | Missense_Mutation | c.322G>C | p.Asp108His | p.D108H | Q5T160 | protein_coding | deleterious(0.02) | benign(0.086) | TCGA-DR-A0ZM-01 | Cervix | cervical & endocervical cancer | Female | <65 | III/IV | Unspecific | Cisplatin | SD | |
| RARS2 | SNV | Missense_Mutation | c.338N>C | p.Gly113Ala | p.G113A | Q5T160 | protein_coding | deleterious(0.01) | probably_damaging(0.992) | TCGA-EK-A3GK-01 | Cervix | cervical & endocervical cancer | Female | <65 | I/II | Unknown | Unknown | SD | |
| RARS2 | SNV | Missense_Mutation | rs201899366 | c.16N>T | p.Arg6Cys | p.R6C | Q5T160 | protein_coding | deleterious(0) | possibly_damaging(0.635) | TCGA-JW-A5VL-01 | Cervix | cervical & endocervical cancer | Female | <65 | I/II | Unknown | Unknown | SD |
| Page: 1 2 3 4 5 6 |
Top |
Related drugs of malignant transformation related genes |
| Identification of chemicals and drugs interact with genes involved in malignant transfromation |
| (DGIdb 4.0) |
| Entrez ID | Symbol | Category | Interaction Types | Drug Claim Name | Drug Name | PMIDs |
| Page: 1 |

Copyright 2023-Present -The University of Texas Health Science Center at Houston |