
|
|||||
|
 | |
| |
| |
| |
| |
| |
|
Gene: RARS |
Gene summary for RARS |
| Gene information | Species | Human | Gene symbol | RARS | Gene ID | 5917 |
| Gene name | arginyl-tRNA synthetase 1 | |
| Gene Alias | ArgRS | |
| Cytomap | 5q34 | |
| Gene Type | protein-coding | GO ID | GO:0006082 | UniProtAcc | P54136 |
Top |
Malignant transformation analysis |
| Identification of the aberrant gene expression in precancerous and cancerous lesions by comparing the gene expression of stem-like cells in diseased tissues with normal stem cells |
| Entrez ID | Symbol | Replicates | Species | Organ | Tissue | Adj P-value | Log2FC | Malignancy |
| 5917 | RARS | LZE4T | Human | Esophagus | ESCC | 2.60e-07 | 8.77e-02 | 0.0811 |
| 5917 | RARS | LZE5T | Human | Esophagus | ESCC | 3.23e-03 | 2.42e-01 | 0.0514 |
| 5917 | RARS | LZE8T | Human | Esophagus | ESCC | 6.40e-09 | 8.11e-02 | 0.067 |
| 5917 | RARS | LZE20T | Human | Esophagus | ESCC | 3.49e-07 | 7.71e-02 | 0.0662 |
| 5917 | RARS | LZE24T | Human | Esophagus | ESCC | 8.66e-11 | 2.12e-01 | 0.0596 |
| 5917 | RARS | LZE21T | Human | Esophagus | ESCC | 2.55e-03 | 1.49e-01 | 0.0655 |
| 5917 | RARS | P1T-E | Human | Esophagus | ESCC | 7.95e-03 | 2.58e-01 | 0.0875 |
| 5917 | RARS | P2T-E | Human | Esophagus | ESCC | 6.27e-17 | 2.88e-01 | 0.1177 |
| 5917 | RARS | P4T-E | Human | Esophagus | ESCC | 3.97e-18 | 4.12e-01 | 0.1323 |
| 5917 | RARS | P5T-E | Human | Esophagus | ESCC | 6.74e-24 | 4.71e-01 | 0.1327 |
| 5917 | RARS | P8T-E | Human | Esophagus | ESCC | 4.42e-20 | 2.71e-01 | 0.0889 |
| 5917 | RARS | P9T-E | Human | Esophagus | ESCC | 2.70e-07 | 1.71e-01 | 0.1131 |
| 5917 | RARS | P10T-E | Human | Esophagus | ESCC | 2.75e-19 | 1.89e-01 | 0.116 |
| 5917 | RARS | P11T-E | Human | Esophagus | ESCC | 2.28e-18 | 5.64e-01 | 0.1426 |
| 5917 | RARS | P12T-E | Human | Esophagus | ESCC | 1.58e-18 | 4.46e-01 | 0.1122 |
| 5917 | RARS | P15T-E | Human | Esophagus | ESCC | 1.01e-22 | 5.52e-01 | 0.1149 |
| 5917 | RARS | P16T-E | Human | Esophagus | ESCC | 6.02e-16 | 2.54e-01 | 0.1153 |
| 5917 | RARS | P17T-E | Human | Esophagus | ESCC | 1.60e-09 | 5.07e-01 | 0.1278 |
| 5917 | RARS | P19T-E | Human | Esophagus | ESCC | 6.02e-08 | 7.05e-01 | 0.1662 |
| 5917 | RARS | P20T-E | Human | Esophagus | ESCC | 2.47e-09 | 1.62e-01 | 0.1124 |
| Page: 1 2 3 4 5 6 |
| Tissue | Expression Dynamics | Abbreviation |
| Esophagus |  | ESCC: Esophageal squamous cell carcinoma |
| HGIN: High-grade intraepithelial neoplasias | ||
| LGIN: Low-grade intraepithelial neoplasias | ||
| Liver | 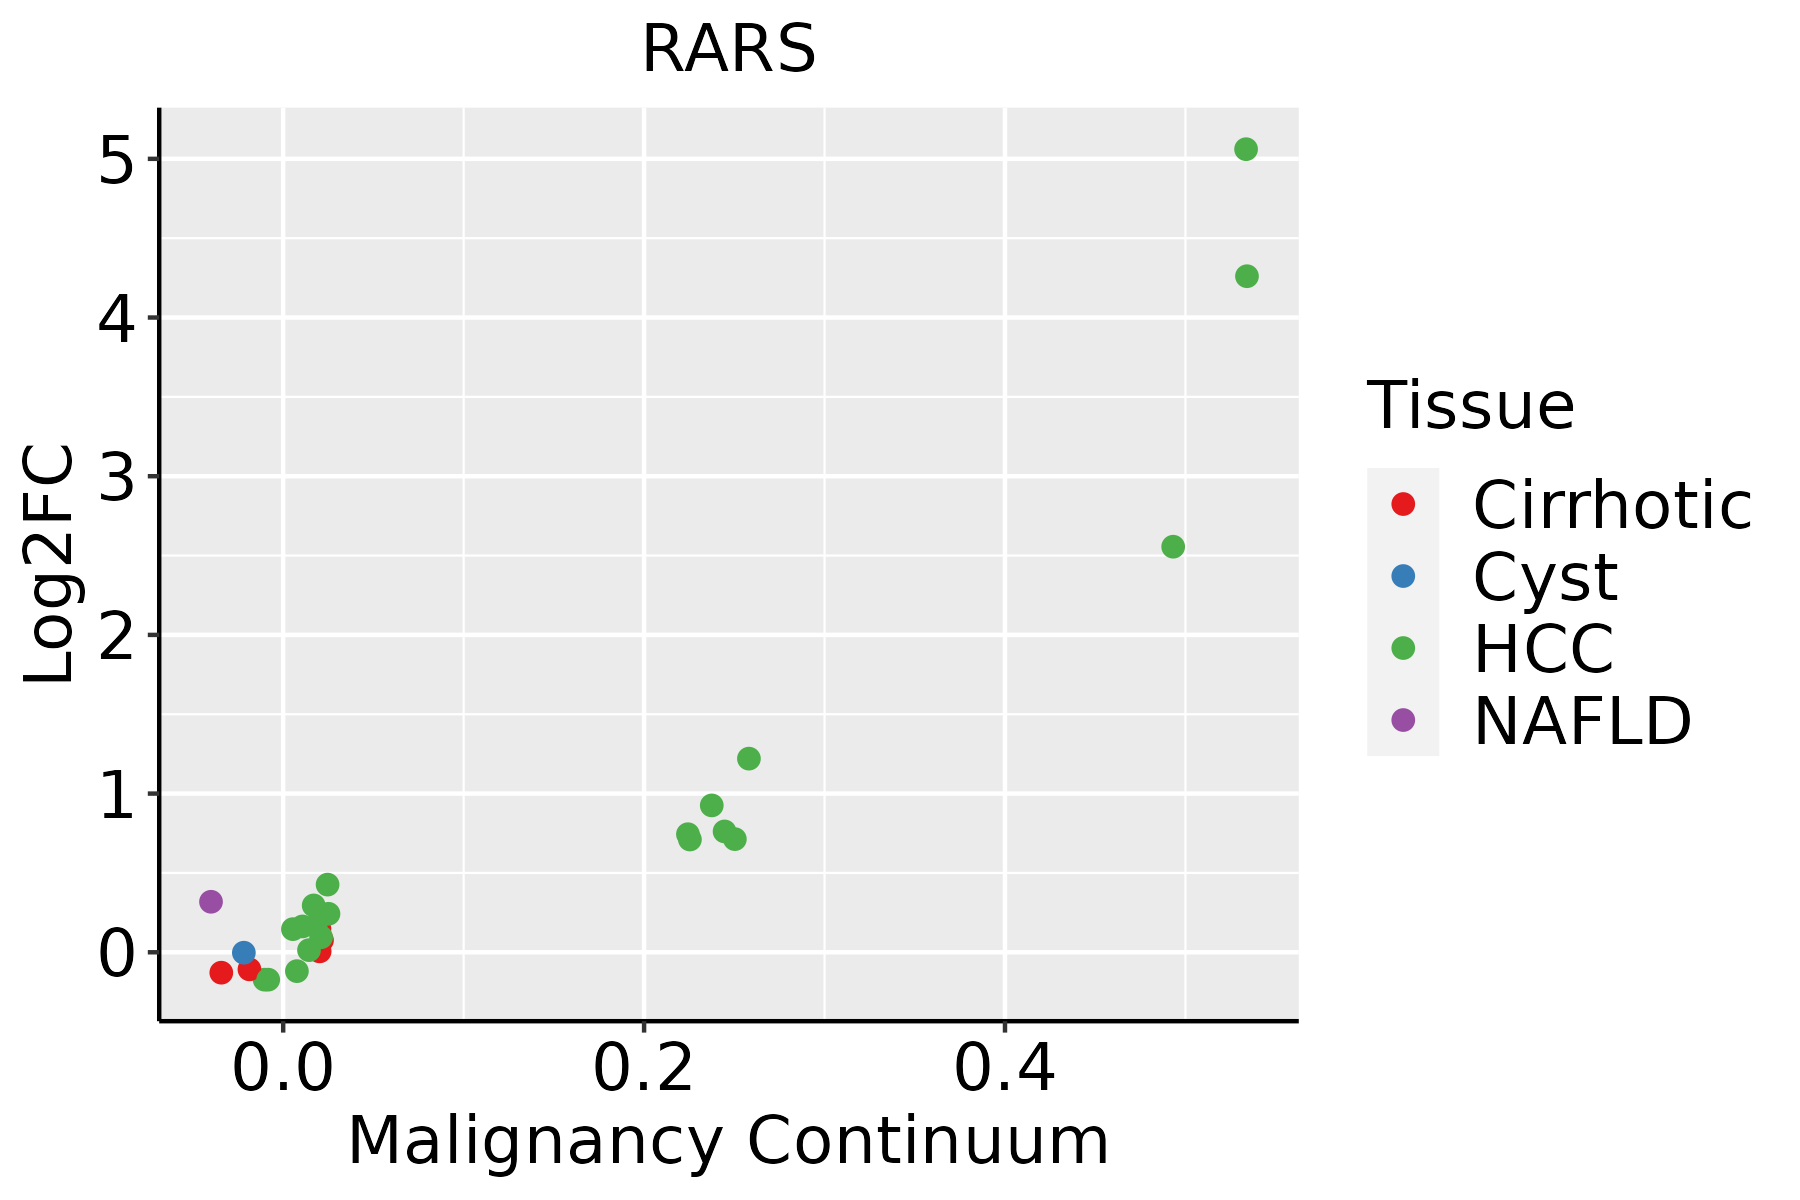 | HCC: Hepatocellular carcinoma |
| NAFLD: Non-alcoholic fatty liver disease | ||
| Oral Cavity | 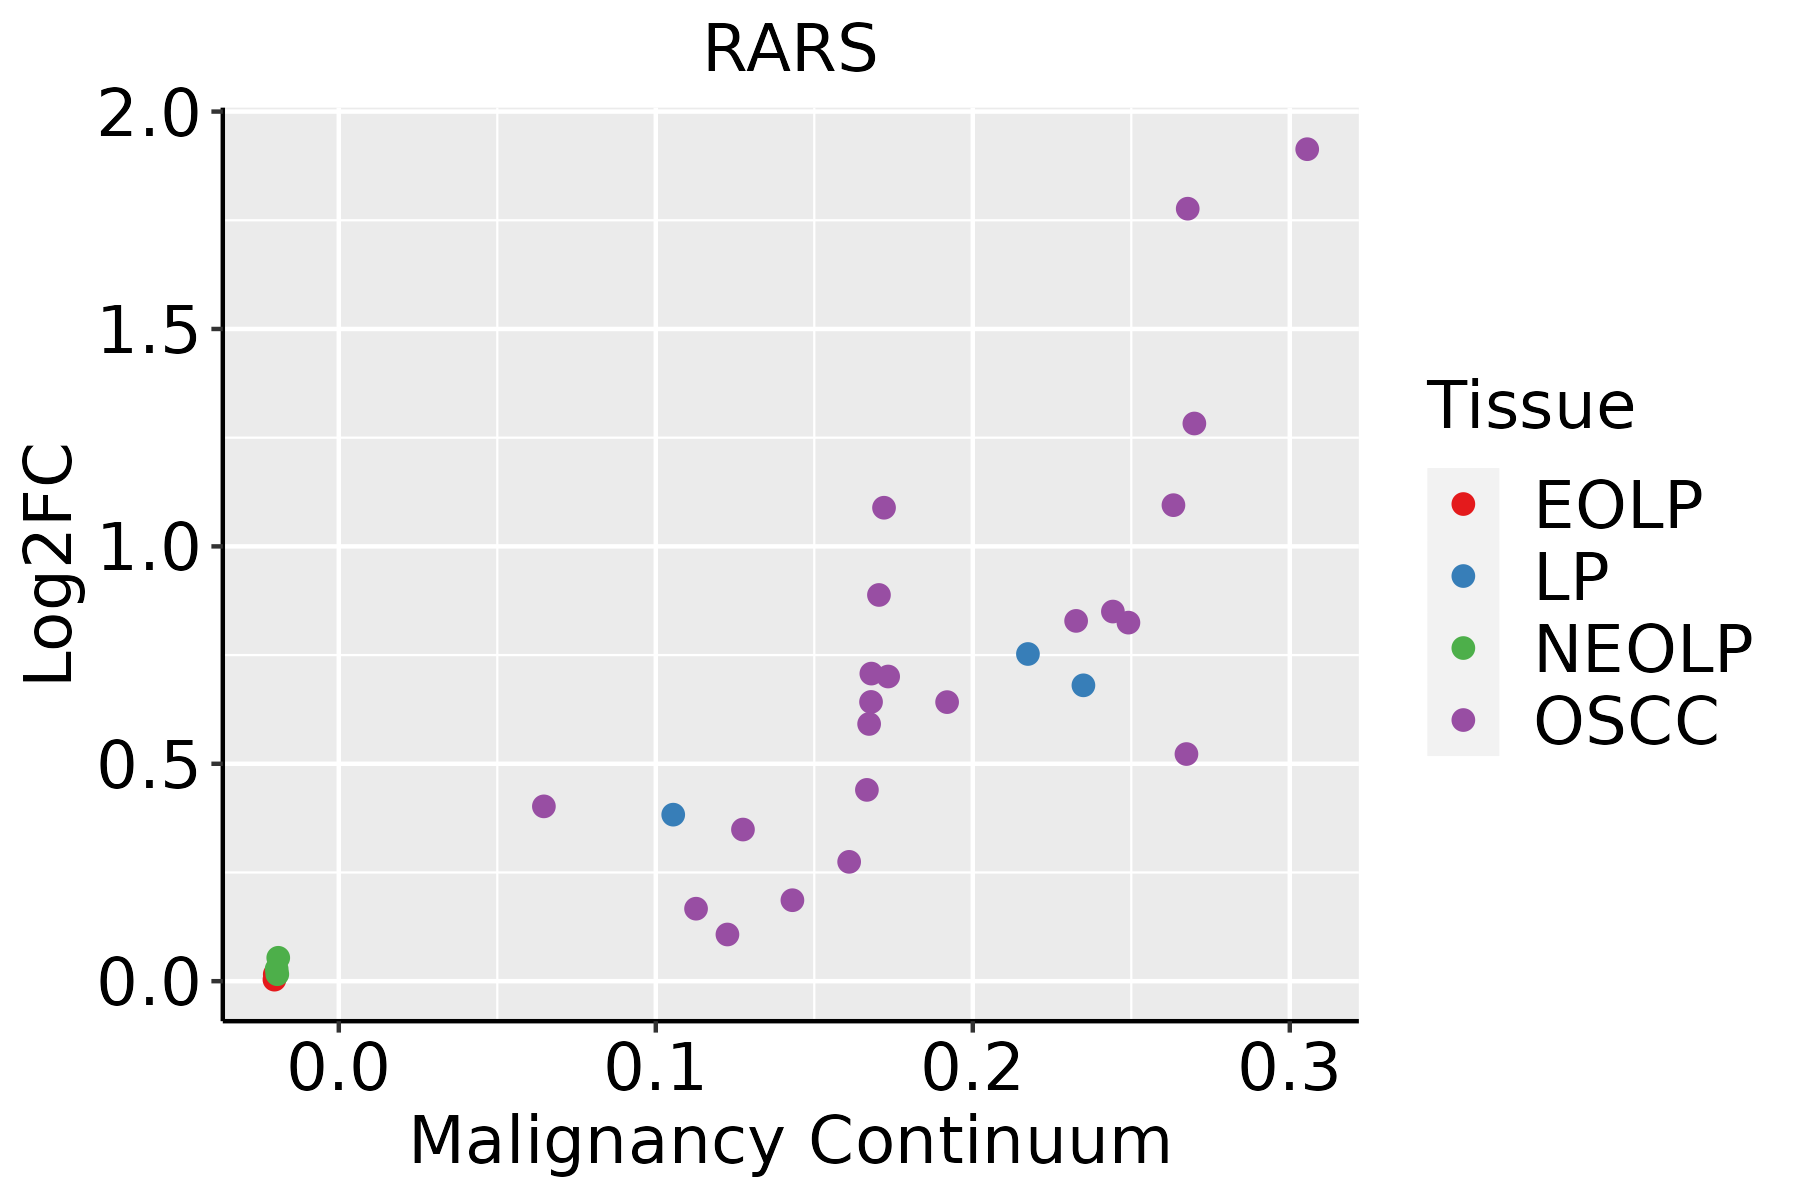 | EOLP: Erosive Oral lichen planus |
| LP: leukoplakia | ||
| NEOLP: Non-erosive oral lichen planus | ||
| OSCC: Oral squamous cell carcinoma | ||
| Skin | 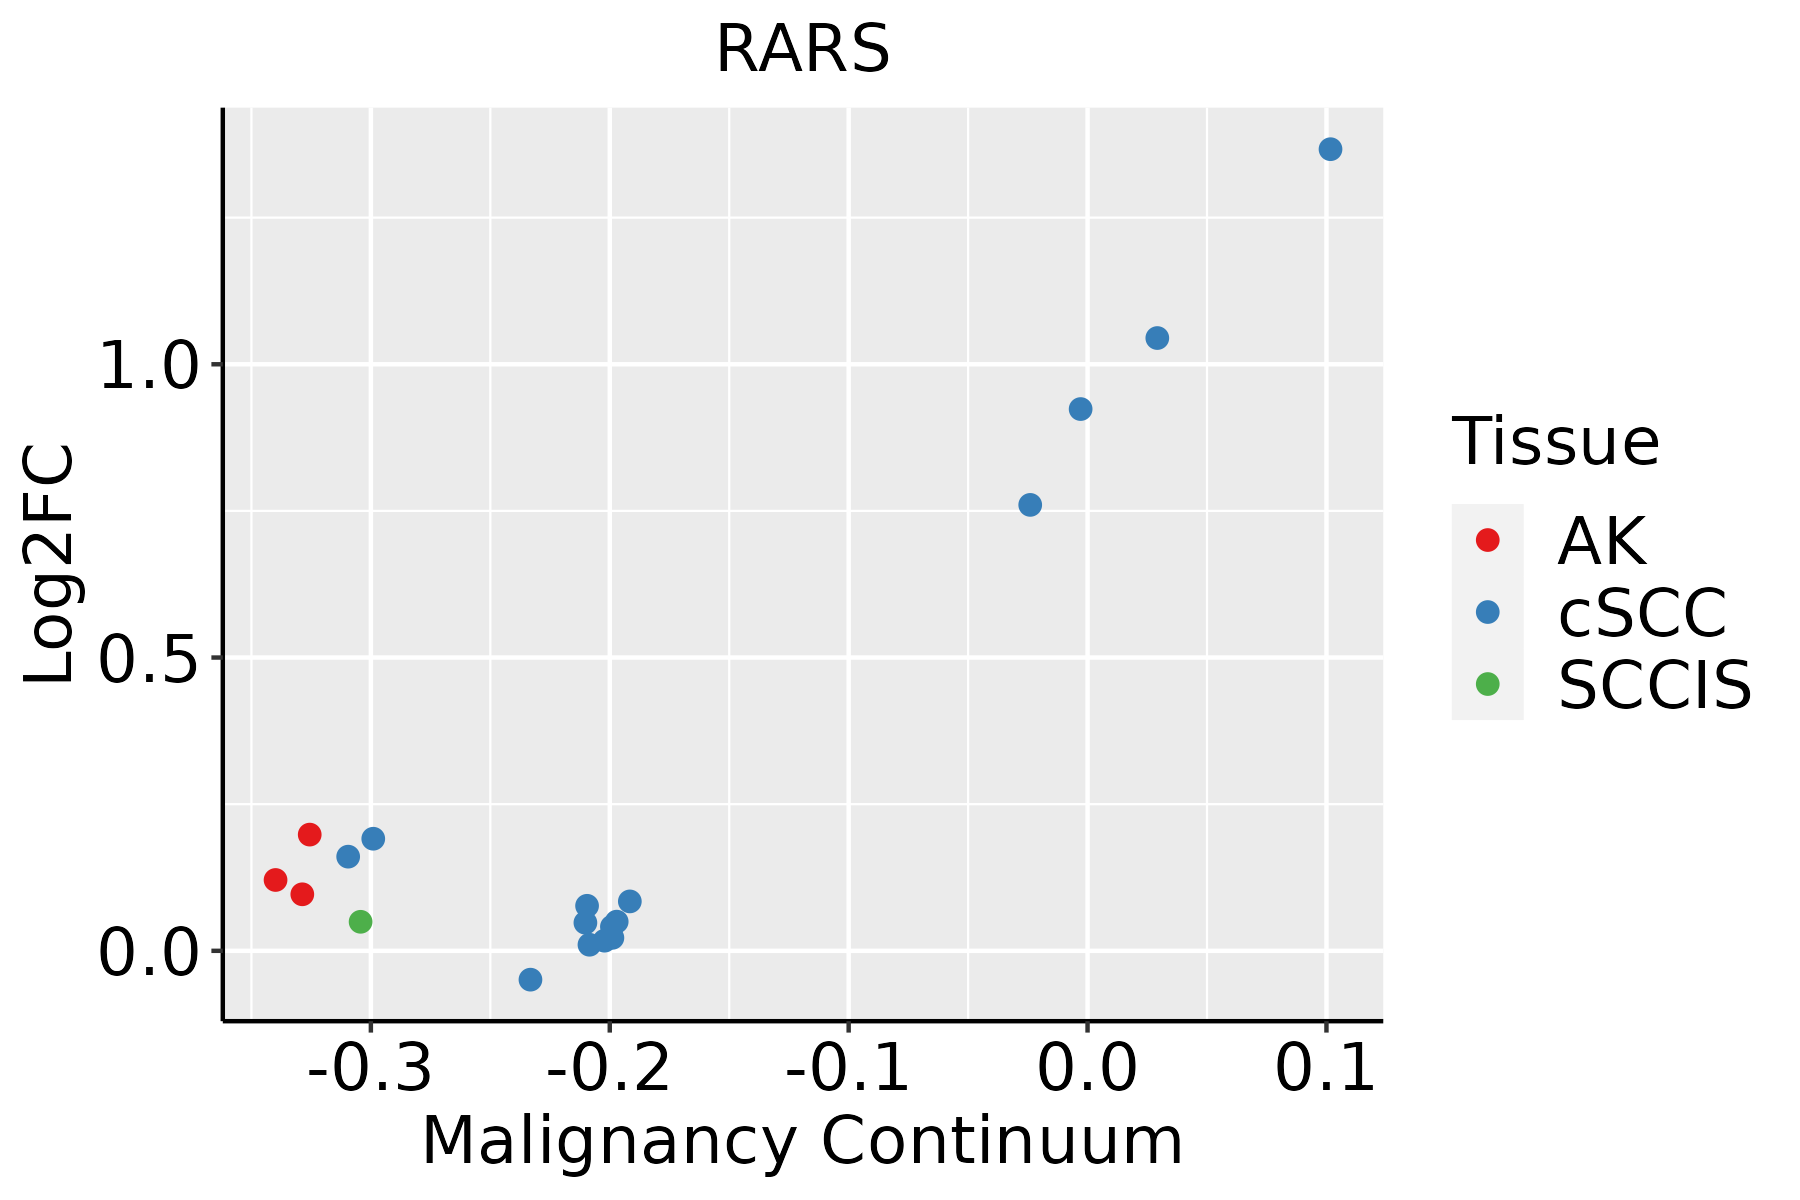 | AK: Actinic keratosis |
| cSCC: Cutaneous squamous cell carcinoma | ||
| SCCIS:squamous cell carcinoma in situ | ||
| Thyroid | 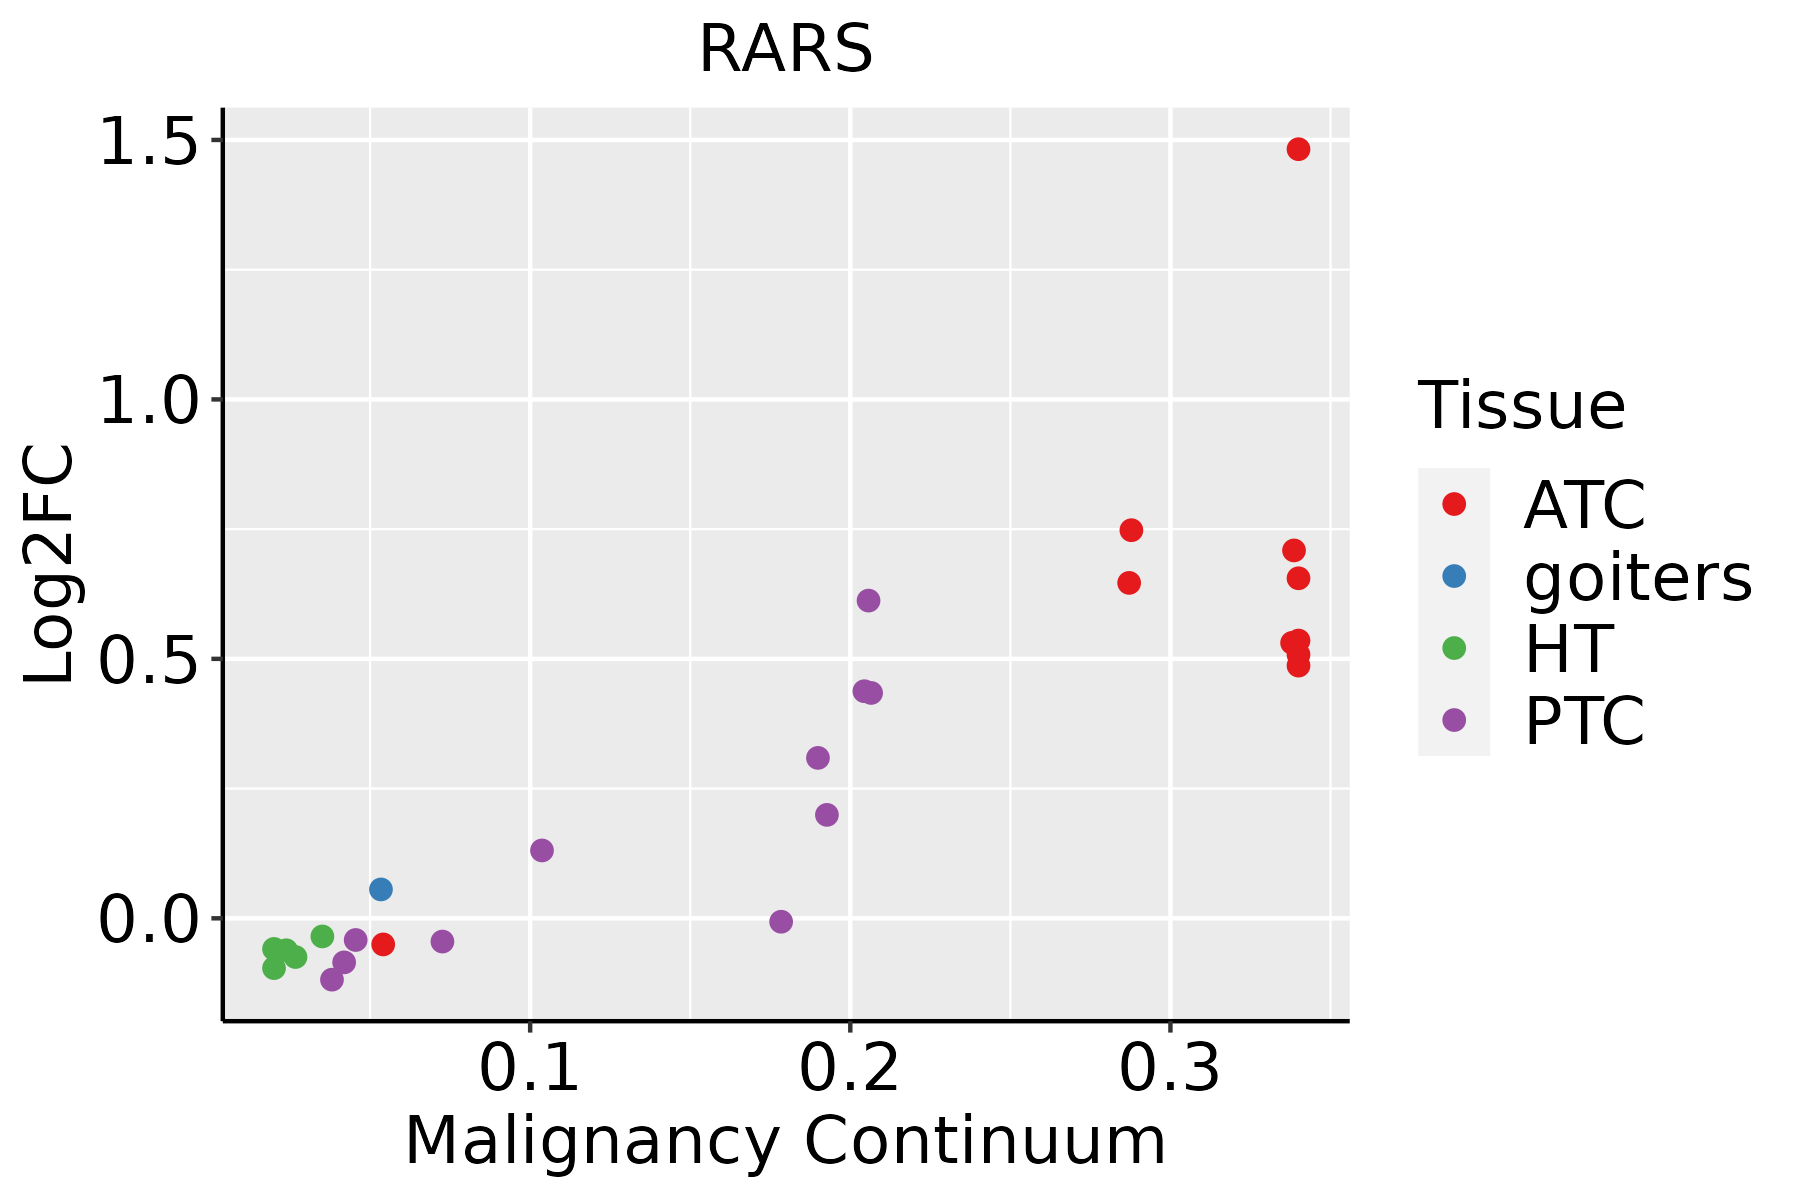 | ATC: Anaplastic thyroid cancer |
| HT: Hashimoto's thyroiditis | ||
| PTC: Papillary thyroid cancer |
| ∗log2FC in expression of this searched gene in stem-like cells from each diseased tissue sample relative to stem-like cells in normal samples in each tissue plotted against the malignancy continuum. Samples are colored based on if they are from different disease stage. |
Top |
Malignant transformation related pathway analysis |
| Find out the enriched GO biological processes and KEGG pathways involved in transition from healthy to precancer to cancer |
| Tissue | Disease Stage | Enriched GO biological Processes |
| Colorectum | AD |  |
| Colorectum | SER |  |
| Colorectum | MSS |  |
| Colorectum | MSI-H |  |
| Colorectum | FAP |  |
| ∗Top 15 enriched GO BP terms are showed in the bar plot of each disease state in each tissue. Each row represents a significant GO biological process which is colored according to the -log10(p.adjust). |
| Page: 1 2 3 4 5 6 7 8 9 |
| GO ID | Tissue | Disease Stage | Description | Gene Ratio | Bg Ratio | pvalue | p.adjust | Count |
| GO:0006418 | Colorectum | AD | tRNA aminoacylation for protein translation | 19/3918 | 41/18723 | 2.37e-04 | 3.03e-03 | 19 |
| GO:0043039 | Colorectum | AD | tRNA aminoacylation | 19/3918 | 44/18723 | 7.13e-04 | 7.21e-03 | 19 |
| GO:0043038 | Colorectum | AD | amino acid activation | 19/3918 | 45/18723 | 9.94e-04 | 9.28e-03 | 19 |
| GO:0006520 | Colorectum | AD | cellular amino acid metabolic process | 81/3918 | 284/18723 | 1.37e-03 | 1.19e-02 | 81 |
| GO:00064181 | Colorectum | SER | tRNA aminoacylation for protein translation | 17/2897 | 41/18723 | 5.75e-05 | 1.35e-03 | 17 |
| GO:00430391 | Colorectum | SER | tRNA aminoacylation | 17/2897 | 44/18723 | 1.64e-04 | 3.12e-03 | 17 |
| GO:00430381 | Colorectum | SER | amino acid activation | 17/2897 | 45/18723 | 2.25e-04 | 3.91e-03 | 17 |
| GO:00065201 | Colorectum | SER | cellular amino acid metabolic process | 61/2897 | 284/18723 | 4.20e-03 | 3.41e-02 | 61 |
| GO:003466012 | Esophagus | ESCC | ncRNA metabolic process | 346/8552 | 485/18723 | 4.35e-31 | 2.51e-28 | 346 |
| GO:014005313 | Esophagus | ESCC | mitochondrial gene expression | 93/8552 | 108/18723 | 1.96e-18 | 2.03e-16 | 93 |
| GO:003254314 | Esophagus | ESCC | mitochondrial translation | 68/8552 | 76/18723 | 1.02e-15 | 6.86e-14 | 68 |
| GO:00063992 | Esophagus | ESCC | tRNA metabolic process | 122/8552 | 179/18723 | 9.03e-10 | 2.19e-08 | 122 |
| GO:00346601 | Liver | HCC | ncRNA metabolic process | 332/7958 | 485/18723 | 1.48e-31 | 7.80e-29 | 332 |
| GO:01400531 | Liver | HCC | mitochondrial gene expression | 82/7958 | 108/18723 | 1.49e-12 | 7.20e-11 | 82 |
| GO:00325431 | Liver | HCC | mitochondrial translation | 62/7958 | 76/18723 | 2.95e-12 | 1.34e-10 | 62 |
| GO:00065202 | Liver | HCC | cellular amino acid metabolic process | 167/7958 | 284/18723 | 1.91e-08 | 4.56e-07 | 167 |
| GO:0006399 | Liver | HCC | tRNA metabolic process | 108/7958 | 179/18723 | 1.07e-06 | 1.59e-05 | 108 |
| GO:00346605 | Oral cavity | OSCC | ncRNA metabolic process | 296/7305 | 485/18723 | 2.94e-23 | 6.65e-21 | 296 |
| GO:01400533 | Oral cavity | OSCC | mitochondrial gene expression | 78/7305 | 108/18723 | 2.37e-12 | 9.86e-11 | 78 |
| GO:00325434 | Oral cavity | OSCC | mitochondrial translation | 59/7305 | 76/18723 | 7.21e-12 | 2.70e-10 | 59 |
| Page: 1 2 |
| Pathway ID | Tissue | Disease Stage | Description | Gene Ratio | Bg Ratio | pvalue | p.adjust | qvalue | Count |
| Page: 1 |
Top |
Cell-cell communication analysis |
| Identification of potential cell-cell interactions between two cell types and their ligand-receptor pairs for different disease states |
| Ligand | Receptor | LRpair | Pathway | Tissue | Disease Stage |
| Page: 1 |
Top |
Single-cell gene regulatory network inference analysis |
| Find out the significant the regulons (TFs) and the target genes of each regulon across cell types for different disease states |
| TF | Cell Type | Tissue | Disease Stage | Target Gene | RSS | Regulon Activity |
| ∗The dot plots of a searched regulon are shown for all cell subpopulations in each disease state of each tissue based on the regulon specific score inferred using pySCENIC and by calculating the average expression. |
| Page: 1 |
Top |
Somatic mutation of malignant transformation related genes |
| Annotation of somatic variants for genes involved in malignant transformation |
| Hugo Symbol | Variant Class | Variant Classification | dbSNP RS | HGVSc | HGVSp | HGVSp Short | SWISSPROT | BIOTYPE | SIFT | PolyPhen | Tumor Sample Barcode | Tissue | Histology | Sex | Age | Stage | Therapy Types | Drugs | Outcome |
| RARS | SNV | Missense_Mutation | rs752688554 | c.1381N>T | p.Arg461Cys | p.R461C | P54136 | protein_coding | deleterious(0) | probably_damaging(0.982) | TCGA-A2-A0T5-01 | Breast | breast invasive carcinoma | Female | <65 | I/II | Unspecific | Taxotere | SD |
| RARS | SNV | Missense_Mutation | c.849N>C | p.Glu283Asp | p.E283D | P54136 | protein_coding | tolerated(1) | benign(0) | TCGA-B6-A0RO-01 | Breast | breast invasive carcinoma | Female | >=65 | III/IV | Unknown | Unknown | SD | |
| RARS | SNV | Missense_Mutation | c.1517N>T | p.Ala506Val | p.A506V | P54136 | protein_coding | deleterious(0) | possibly_damaging(0.9) | TCGA-C8-A12N-01 | Breast | breast invasive carcinoma | Female | <65 | I/II | Unknown | Unknown | SD | |
| RARS | SNV | Missense_Mutation | rs555837551 | c.1901G>A | p.Arg634His | p.R634H | P54136 | protein_coding | deleterious(0) | probably_damaging(0.999) | TCGA-D8-A1Y1-01 | Breast | breast invasive carcinoma | Female | >=65 | III/IV | Hormone Therapy | tamoxiphen | PD |
| RARS | SNV | Missense_Mutation | c.1651N>A | p.Asp551Asn | p.D551N | P54136 | protein_coding | tolerated(0.12) | benign(0.012) | TCGA-GM-A2D9-01 | Breast | breast invasive carcinoma | Female | >=65 | I/II | Hormone Therapy | arimidex | SD | |
| RARS | deletion | Frame_Shift_Del | novel | c.599delN | p.Pro201LeufsTer3 | p.P201Lfs*3 | P54136 | protein_coding | TCGA-D8-A27V-01 | Breast | breast invasive carcinoma | Female | <65 | I/II | Hormone Therapy | tamoxiphen | SD | ||
| RARS | SNV | Missense_Mutation | rs772235029 | c.784G>A | p.Val262Ile | p.V262I | P54136 | protein_coding | tolerated(0.28) | benign(0.012) | TCGA-2W-A8YY-01 | Cervix | cervical & endocervical cancer | Female | <65 | I/II | Chemotherapy | cisplatin | CR |
| RARS | SNV | Missense_Mutation | novel | c.1906C>A | p.Leu636Met | p.L636M | P54136 | protein_coding | tolerated(0.07) | possibly_damaging(0.898) | TCGA-2W-A8YY-01 | Cervix | cervical & endocervical cancer | Female | <65 | I/II | Chemotherapy | cisplatin | CR |
| RARS | SNV | Missense_Mutation | novel | c.219N>A | p.Met73Ile | p.M73I | P54136 | protein_coding | tolerated(0.21) | benign(0.007) | TCGA-PN-A8MA-01 | Cervix | cervical & endocervical cancer | Female | <65 | I/II | Chemotherapy | cisplatin | SD |
| RARS | SNV | Missense_Mutation | c.1880T>C | p.Ile627Thr | p.I627T | P54136 | protein_coding | tolerated(0.09) | benign(0.261) | TCGA-A6-5661-01 | Colorectum | colon adenocarcinoma | Female | >=65 | I/II | Unknown | Unknown | SD |
| Page: 1 2 3 4 5 6 |
Top |
Related drugs of malignant transformation related genes |
| Identification of chemicals and drugs interact with genes involved in malignant transfromation |
| (DGIdb 4.0) |
| Entrez ID | Symbol | Category | Interaction Types | Drug Claim Name | Drug Name | PMIDs |
| Page: 1 |

Copyright 2023-Present -The University of Texas Health Science Center at Houston |