
|
|||||
|
 | |
| |
| |
| |
| |
| |
|
Gene: RARRES3 |
Gene summary for RARRES3 |
| Gene information | Species | Human | Gene symbol | RARRES3 | Gene ID | 5920 |
| Gene name | phospholipase A and acyltransferase 4 | |
| Gene Alias | HRASLS4 | |
| Cytomap | 11q12.3 | |
| Gene Type | protein-coding | GO ID | GO:0006629 | UniProtAcc | Q9UL19 |
Top |
Malignant transformation analysis |
| Identification of the aberrant gene expression in precancerous and cancerous lesions by comparing the gene expression of stem-like cells in diseased tissues with normal stem cells |
| Entrez ID | Symbol | Replicates | Species | Organ | Tissue | Adj P-value | Log2FC | Malignancy |
| 5920 | RARRES3 | GSM4909286 | Human | Breast | IDC | 5.48e-15 | -3.41e-01 | 0.1081 |
| 5920 | RARRES3 | GSM4909290 | Human | Breast | IDC | 2.67e-26 | 7.88e-01 | 0.2096 |
| 5920 | RARRES3 | GSM4909293 | Human | Breast | IDC | 2.33e-16 | 4.68e-01 | 0.1581 |
| 5920 | RARRES3 | GSM4909294 | Human | Breast | IDC | 1.35e-19 | 5.30e-01 | 0.2022 |
| 5920 | RARRES3 | GSM4909296 | Human | Breast | IDC | 3.90e-21 | 5.93e-01 | 0.1524 |
| 5920 | RARRES3 | GSM4909297 | Human | Breast | IDC | 6.63e-08 | 5.80e-02 | 0.1517 |
| 5920 | RARRES3 | GSM4909299 | Human | Breast | IDC | 6.18e-17 | 5.18e-01 | 0.035 |
| 5920 | RARRES3 | GSM4909300 | Human | Breast | IDC | 1.41e-04 | 4.48e-01 | 0.0334 |
| 5920 | RARRES3 | GSM4909302 | Human | Breast | IDC | 1.16e-13 | 5.15e-01 | 0.1545 |
| 5920 | RARRES3 | GSM4909304 | Human | Breast | IDC | 4.98e-07 | 4.26e-01 | 0.1636 |
| 5920 | RARRES3 | GSM4909305 | Human | Breast | IDC | 3.10e-15 | 5.76e-01 | 0.0436 |
| 5920 | RARRES3 | GSM4909306 | Human | Breast | IDC | 4.23e-28 | 7.01e-01 | 0.1564 |
| 5920 | RARRES3 | GSM4909307 | Human | Breast | IDC | 1.14e-29 | 7.19e-01 | 0.1569 |
| 5920 | RARRES3 | GSM4909308 | Human | Breast | IDC | 5.31e-20 | 5.89e-01 | 0.158 |
| 5920 | RARRES3 | GSM4909309 | Human | Breast | IDC | 3.21e-05 | 3.87e-01 | 0.0483 |
| 5920 | RARRES3 | GSM4909311 | Human | Breast | IDC | 3.65e-17 | -2.85e-02 | 0.1534 |
| 5920 | RARRES3 | GSM4909312 | Human | Breast | IDC | 7.92e-05 | -2.09e-01 | 0.1552 |
| 5920 | RARRES3 | GSM4909313 | Human | Breast | IDC | 3.01e-02 | 2.51e-01 | 0.0391 |
| 5920 | RARRES3 | GSM4909317 | Human | Breast | IDC | 2.65e-14 | 5.68e-01 | 0.1355 |
| 5920 | RARRES3 | GSM4909318 | Human | Breast | IDC | 8.96e-12 | 8.24e-01 | 0.2031 |
| Page: 1 2 3 4 5 6 7 |
| Tissue | Expression Dynamics | Abbreviation |
| Breast | 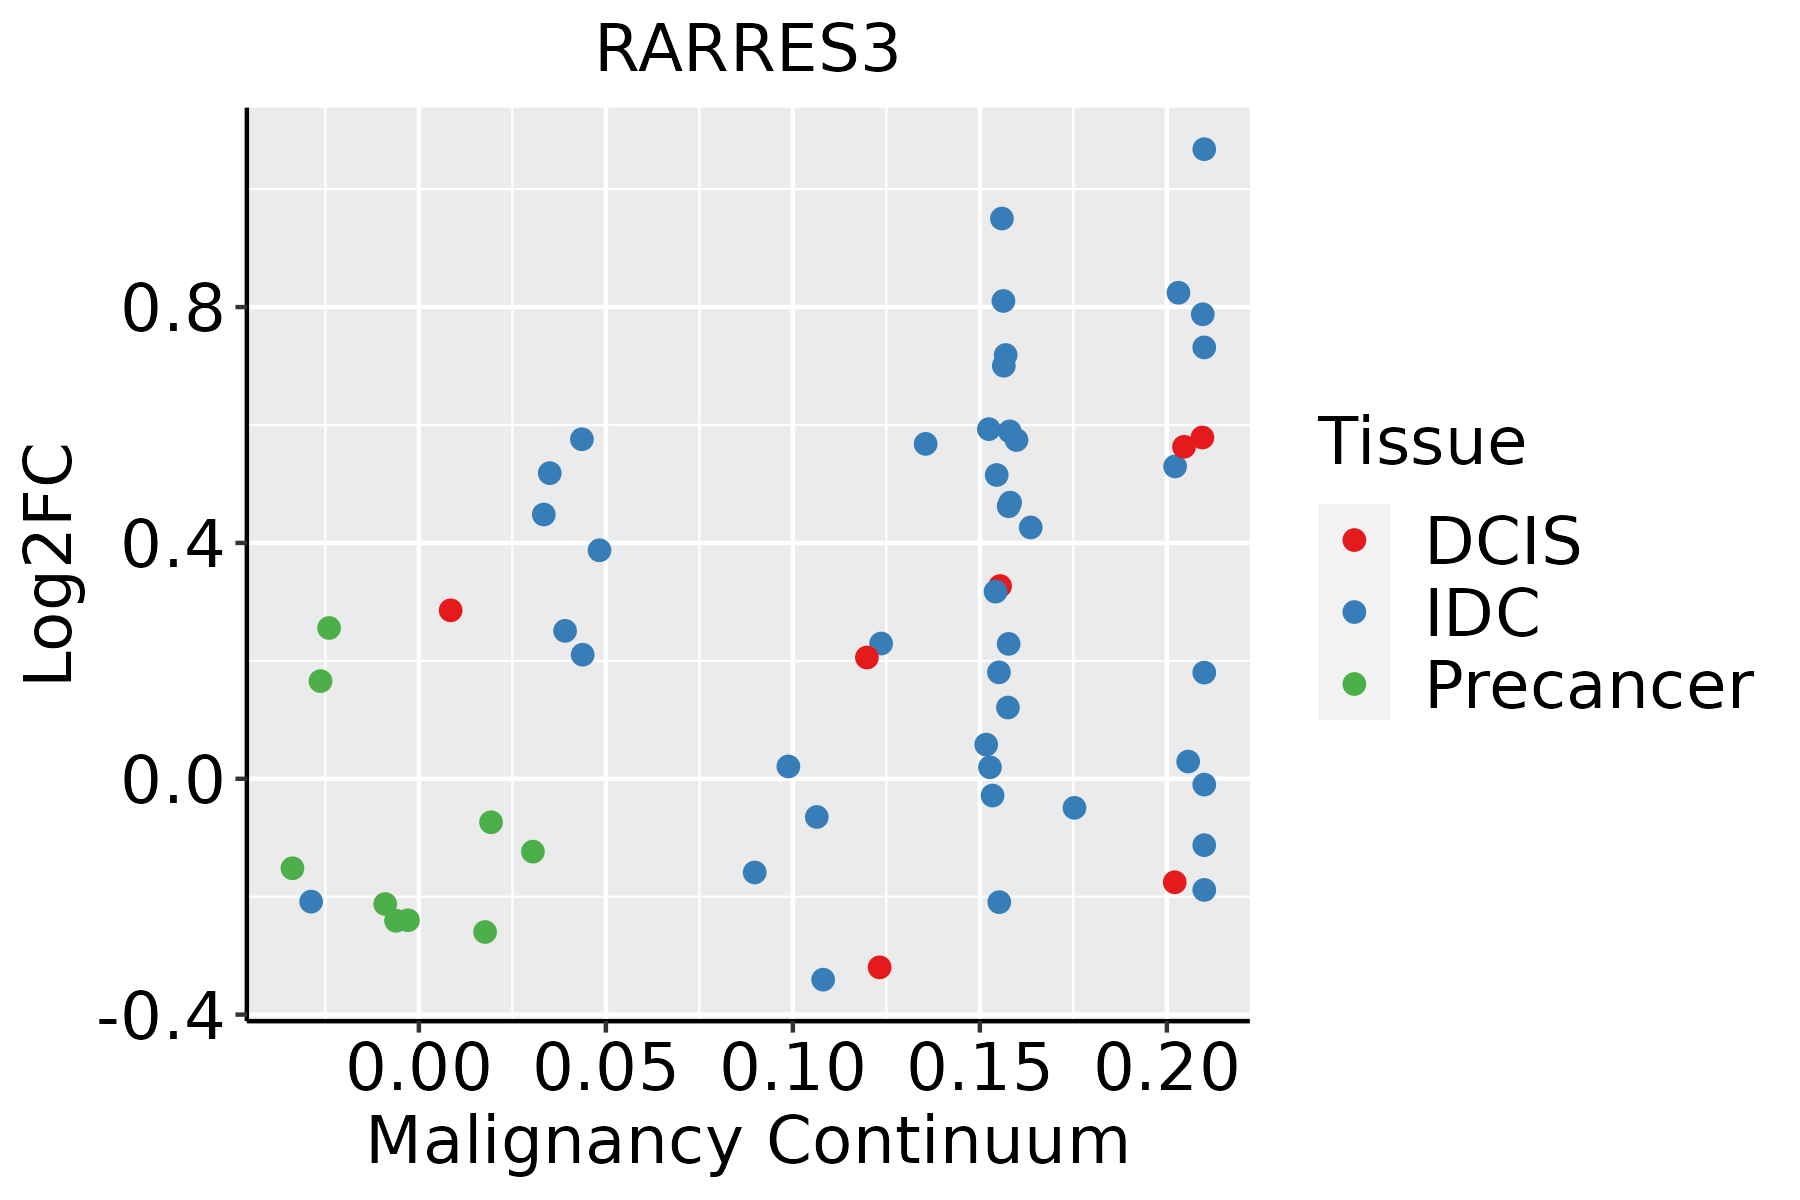 | IDC: Invasive ductal carcinoma |
| DCIS: Ductal carcinoma in situ | ||
| Precancer(BRCA1-mut): Precancerous lesion from BRCA1 mutation carriers | ||
| Esophagus | 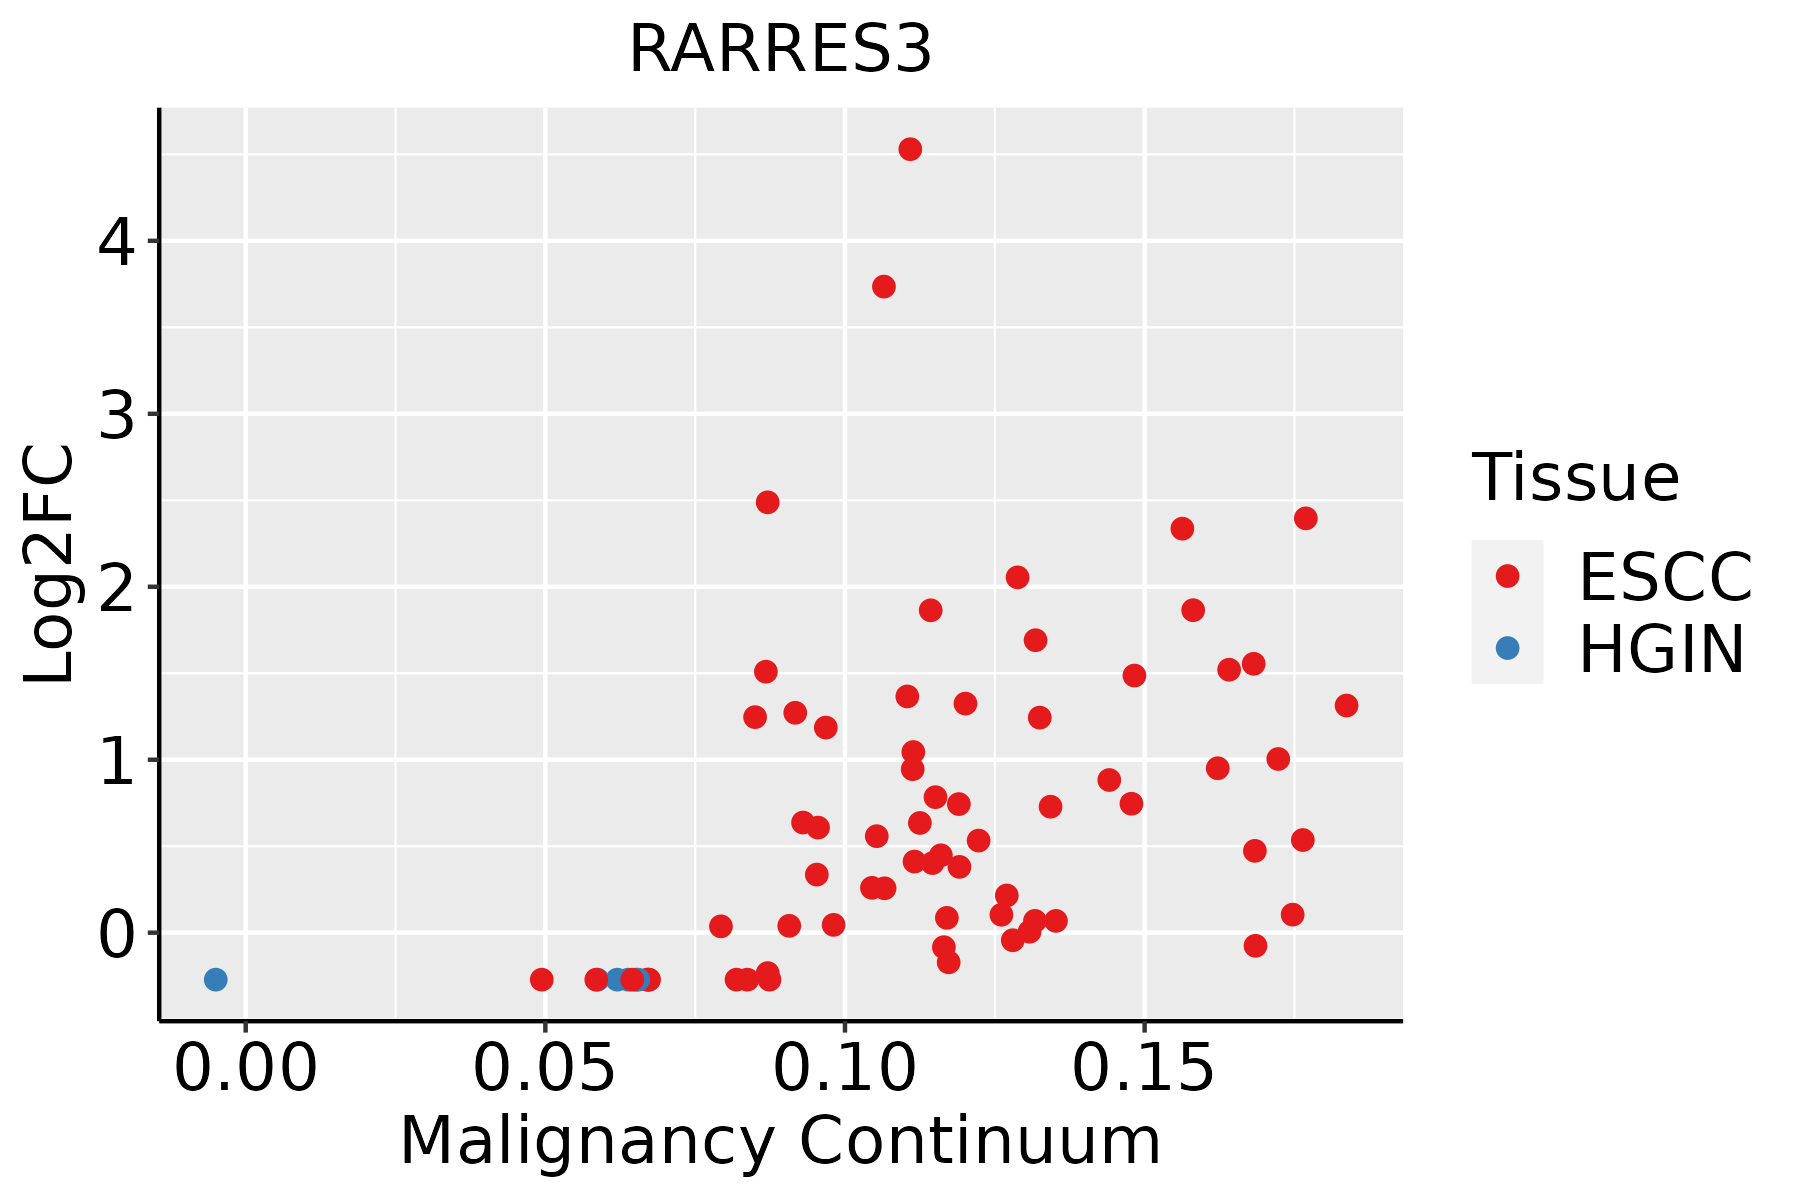 | ESCC: Esophageal squamous cell carcinoma |
| HGIN: High-grade intraepithelial neoplasias | ||
| LGIN: Low-grade intraepithelial neoplasias | ||
| Liver |  | HCC: Hepatocellular carcinoma |
| NAFLD: Non-alcoholic fatty liver disease | ||
| Oral Cavity | 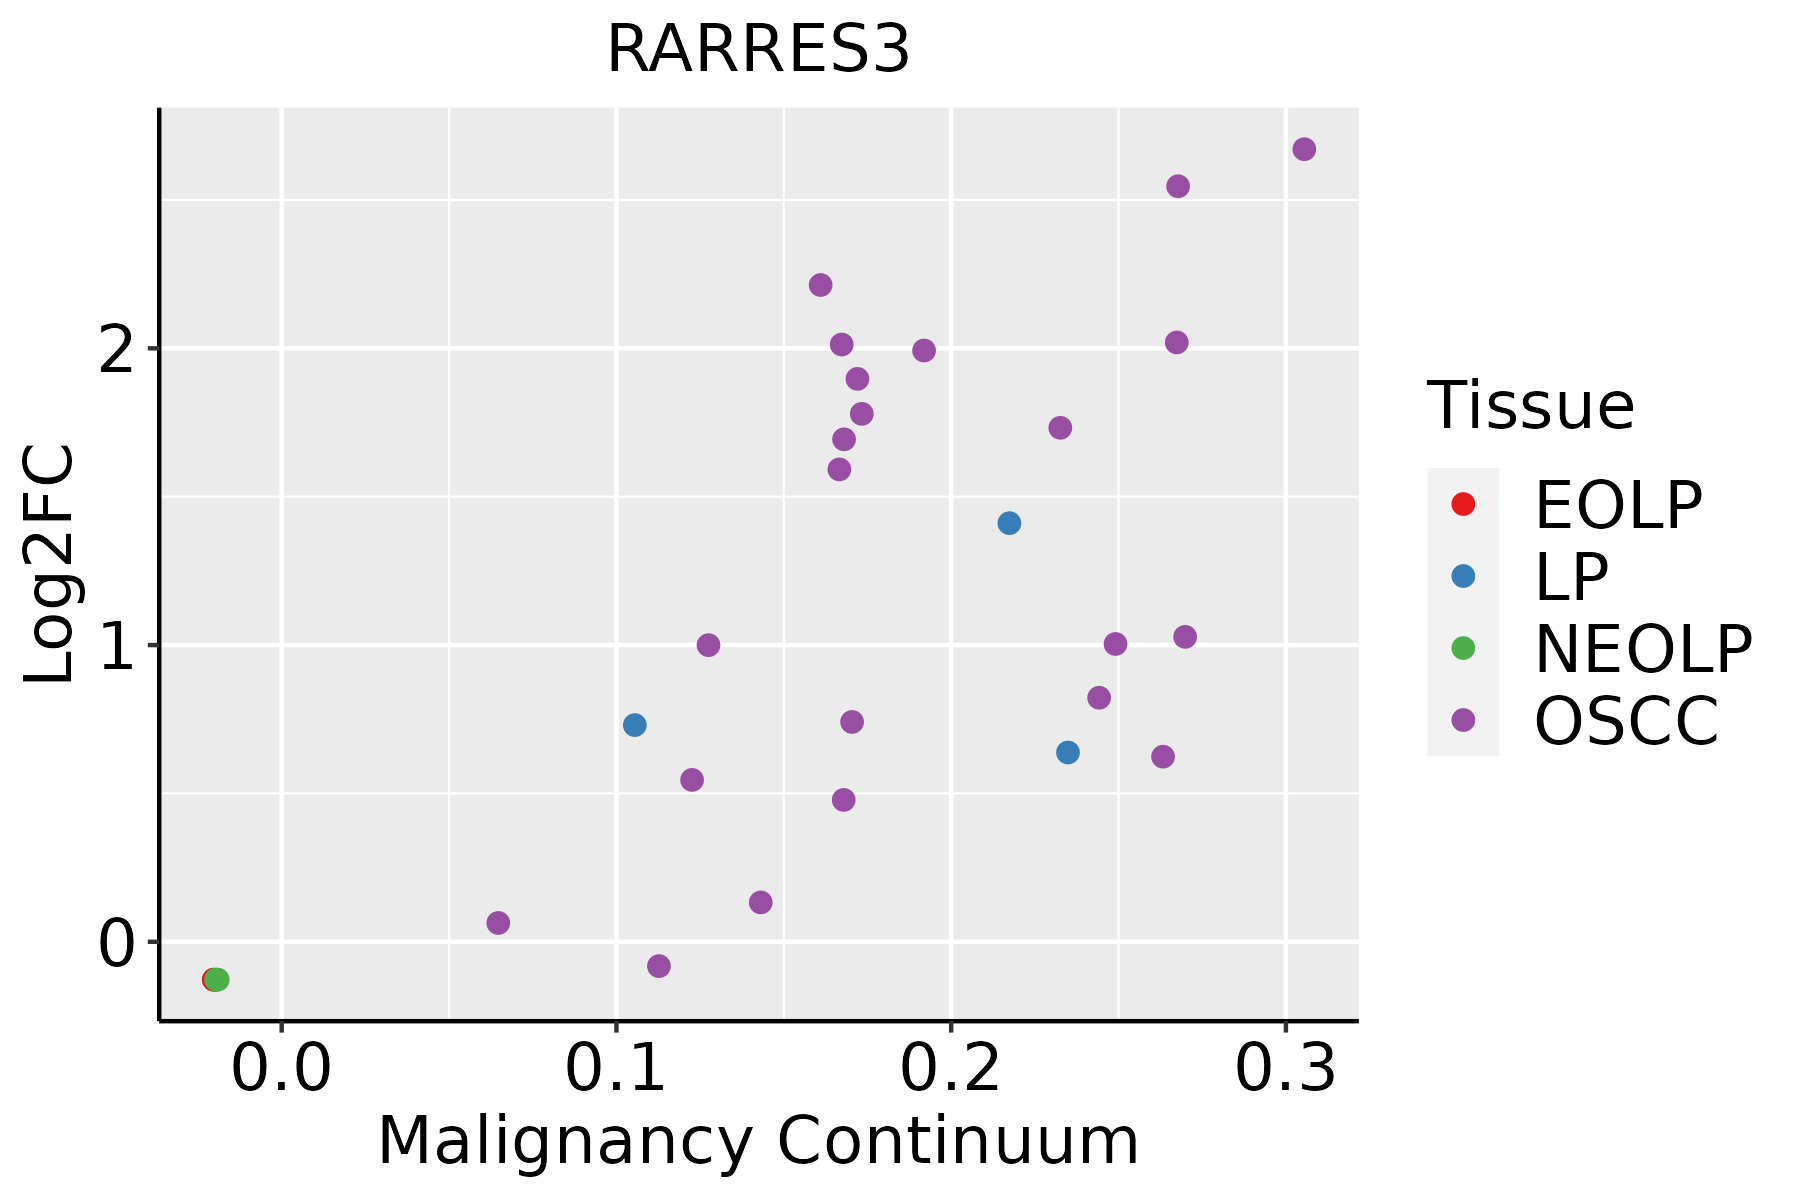 | EOLP: Erosive Oral lichen planus |
| LP: leukoplakia | ||
| NEOLP: Non-erosive oral lichen planus | ||
| OSCC: Oral squamous cell carcinoma | ||
| Prostate | 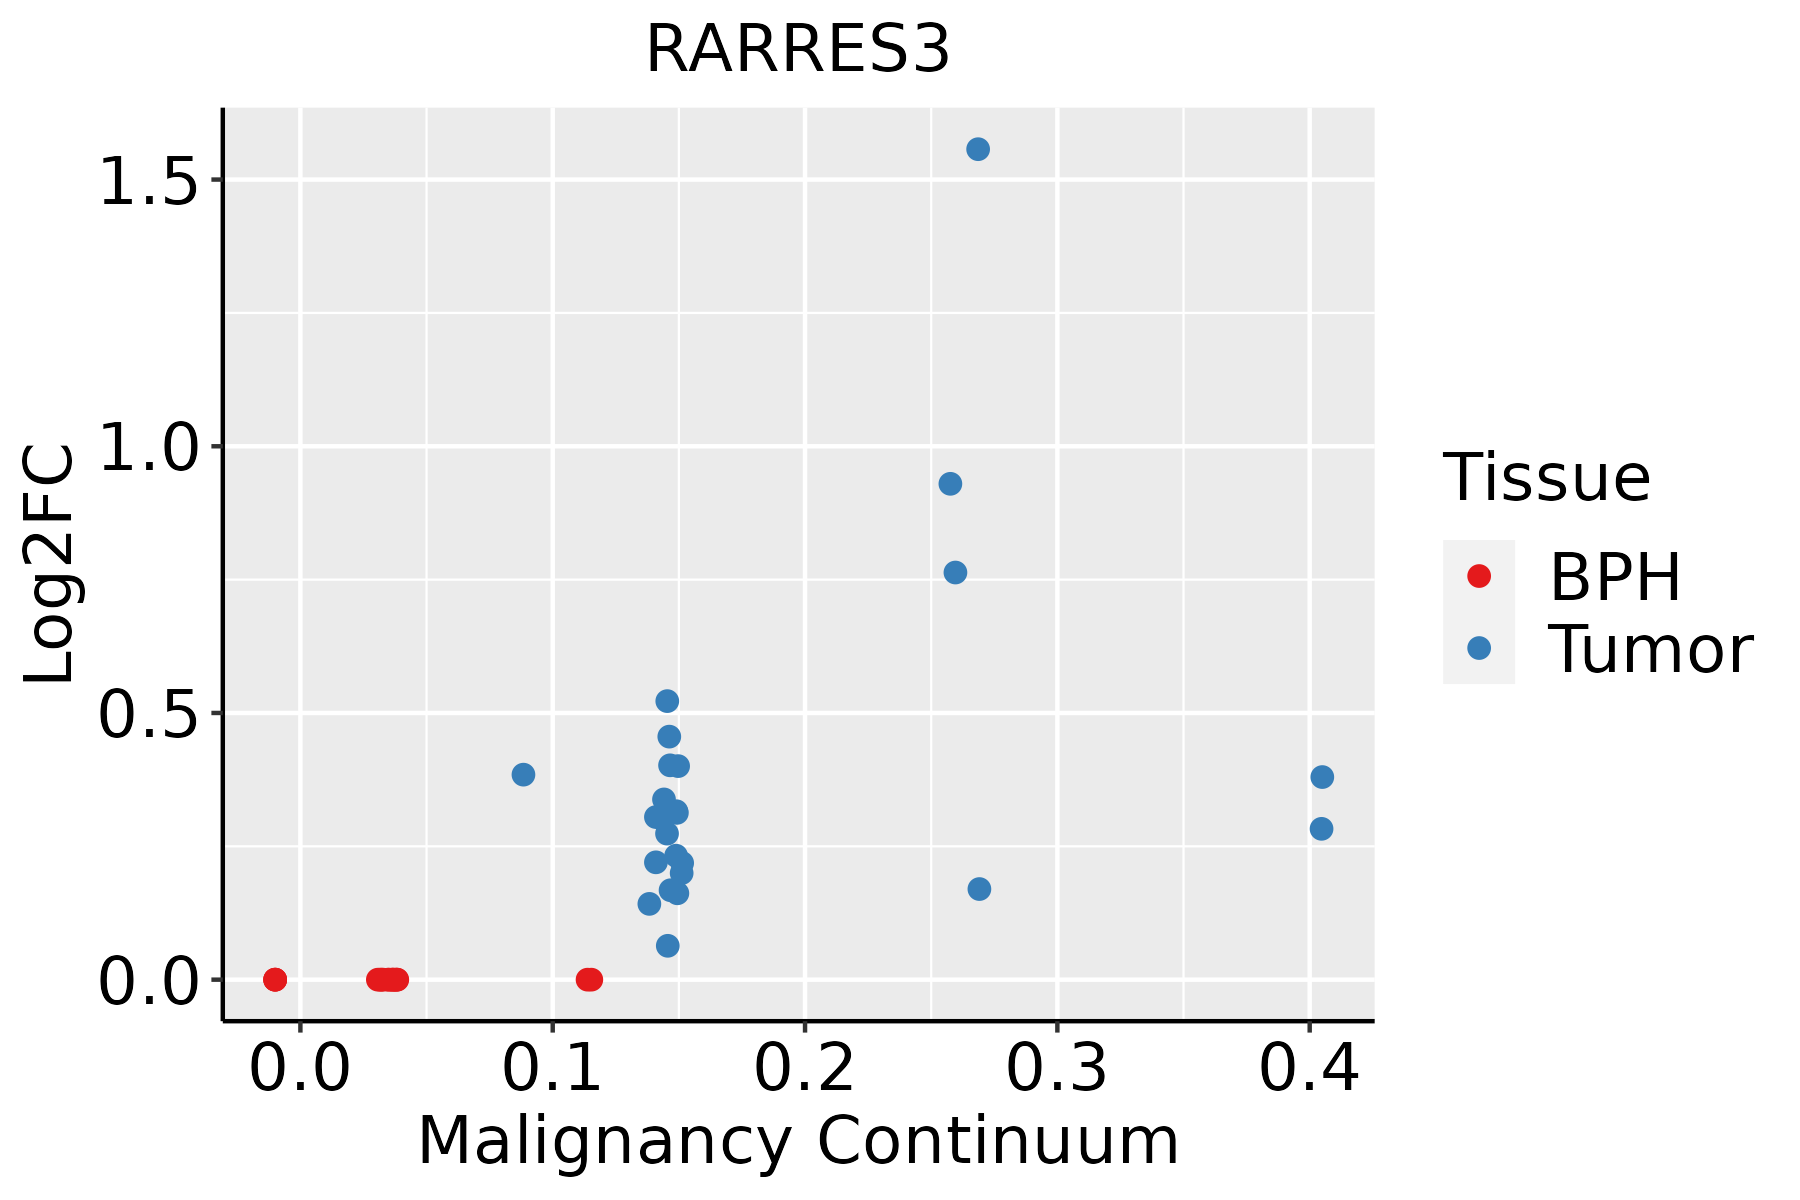 | BPH: Benign Prostatic Hyperplasia |
| Thyroid | 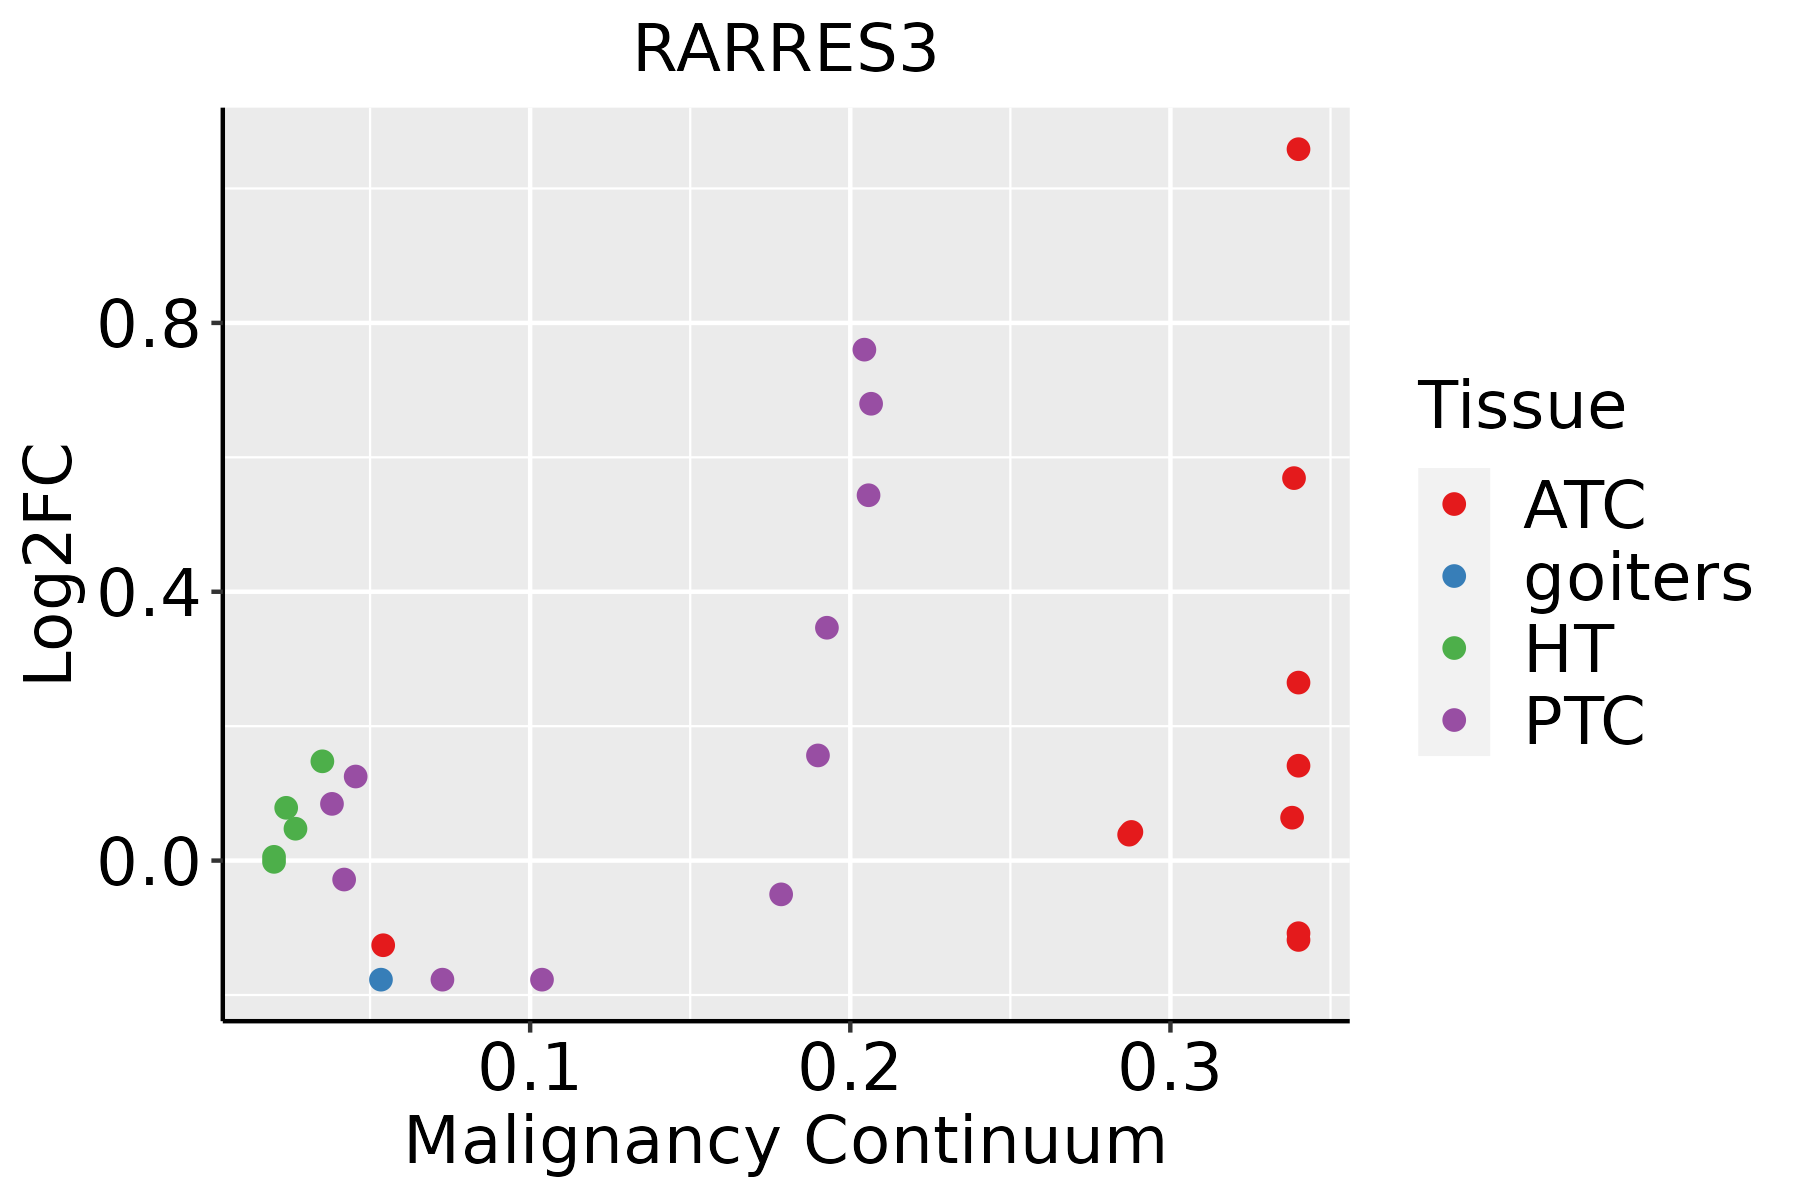 | ATC: Anaplastic thyroid cancer |
| HT: Hashimoto's thyroiditis | ||
| PTC: Papillary thyroid cancer |
| ∗log2FC in expression of this searched gene in stem-like cells from each diseased tissue sample relative to stem-like cells in normal samples in each tissue plotted against the malignancy continuum. Samples are colored based on if they are from different disease stage. |
Top |
Malignant transformation related pathway analysis |
| Find out the enriched GO biological processes and KEGG pathways involved in transition from healthy to precancer to cancer |
| Tissue | Disease Stage | Enriched GO biological Processes |
| Colorectum | AD |  |
| Colorectum | SER |  |
| Colorectum | MSS |  |
| Colorectum | MSI-H |  |
| Colorectum | FAP |  |
| ∗Top 15 enriched GO BP terms are showed in the bar plot of each disease state in each tissue. Each row represents a significant GO biological process which is colored according to the -log10(p.adjust). |
| Page: 1 2 3 4 5 6 7 8 9 |
| GO ID | Tissue | Disease Stage | Description | Gene Ratio | Bg Ratio | pvalue | p.adjust | Count |
| Page: 1 |
| Pathway ID | Tissue | Disease Stage | Description | Gene Ratio | Bg Ratio | pvalue | p.adjust | qvalue | Count |
| Page: 1 |
Top |
Cell-cell communication analysis |
| Identification of potential cell-cell interactions between two cell types and their ligand-receptor pairs for different disease states |
| Ligand | Receptor | LRpair | Pathway | Tissue | Disease Stage |
| Page: 1 |
Top |
Single-cell gene regulatory network inference analysis |
| Find out the significant the regulons (TFs) and the target genes of each regulon across cell types for different disease states |
| TF | Cell Type | Tissue | Disease Stage | Target Gene | RSS | Regulon Activity |
| ∗The dot plots of a searched regulon are shown for all cell subpopulations in each disease state of each tissue based on the regulon specific score inferred using pySCENIC and by calculating the average expression. |
| Page: 1 |
Top |
Somatic mutation of malignant transformation related genes |
| Annotation of somatic variants for genes involved in malignant transformation |
| Hugo Symbol | Variant Class | Variant Classification | dbSNP RS | HGVSc | HGVSp | HGVSp Short | SWISSPROT | BIOTYPE | SIFT | PolyPhen | Tumor Sample Barcode | Tissue | Histology | Sex | Age | Stage | Therapy Types | Drugs | Outcome |
| RARRES3 | SNV | Missense_Mutation | rs368947257 | c.191G>A | p.Arg64His | p.R64H | Q9UL19 | protein_coding | tolerated(0.16) | benign(0.006) | TCGA-AA-3710-01 | Colorectum | colon adenocarcinoma | Female | >=65 | I/II | Unknown | Unknown | SD |
| RARRES3 | SNV | Missense_Mutation | rs371930466 | c.223C>T | p.Arg75Trp | p.R75W | Q9UL19 | protein_coding | deleterious(0) | benign(0.013) | TCGA-AY-6196-01 | Colorectum | colon adenocarcinoma | Male | <65 | III/IV | Unknown | Unknown | SD |
| RARRES3 | SNV | Missense_Mutation | c.477A>T | p.Gln159His | p.Q159H | Q9UL19 | protein_coding | tolerated(0.1) | benign(0.339) | TCGA-AG-A02G-01 | Colorectum | rectum adenocarcinoma | Male | >=65 | III/IV | Chemotherapy | folinic | PD | |
| RARRES3 | insertion | Frame_Shift_Ins | novel | c.341_342insCT | p.Glu114AspfsTer8 | p.E114Dfs*8 | Q9UL19 | protein_coding | TCGA-AG-A00Y-01 | Colorectum | rectum adenocarcinoma | Male | >=65 | I/II | Unknown | Unknown | PD | ||
| RARRES3 | SNV | Missense_Mutation | rs770983321 | c.52N>T | p.Arg18Cys | p.R18C | Q9UL19 | protein_coding | deleterious(0) | probably_damaging(0.949) | TCGA-A5-A0G2-01 | Endometrium | uterine corpus endometrioid carcinoma | Female | <65 | III/IV | Unknown | Unknown | SD |
| RARRES3 | SNV | Missense_Mutation | rs35845275 | c.485N>T | p.Ala162Val | p.A162V | Q9UL19 | protein_coding | deleterious_low_confidence(0) | benign(0) | TCGA-A5-A1OF-01 | Endometrium | uterine corpus endometrioid carcinoma | Female | <65 | I/II | Unknown | Unknown | SD |
| RARRES3 | SNV | Missense_Mutation | c.152N>A | p.Phe51Tyr | p.F51Y | Q9UL19 | protein_coding | deleterious(0) | possibly_damaging(0.69) | TCGA-AP-A059-01 | Endometrium | uterine corpus endometrioid carcinoma | Female | >=65 | I/II | Unknown | Unknown | SD | |
| RARRES3 | SNV | Missense_Mutation | rs371656613 | c.259C>T | p.Arg87Trp | p.R87W | Q9UL19 | protein_coding | deleterious(0.01) | benign(0.019) | TCGA-AX-A0IZ-01 | Endometrium | uterine corpus endometrioid carcinoma | Female | <65 | I/II | Unknown | Unknown | SD |
| RARRES3 | SNV | Missense_Mutation | c.45N>T | p.Glu15Asp | p.E15D | Q9UL19 | protein_coding | deleterious(0) | probably_damaging(0.915) | TCGA-D1-A17Q-01 | Endometrium | uterine corpus endometrioid carcinoma | Female | <65 | I/II | Unknown | Unknown | SD | |
| RARRES3 | SNV | Missense_Mutation | novel | c.251N>G | p.Tyr84Cys | p.Y84C | Q9UL19 | protein_coding | tolerated(0.07) | probably_damaging(0.977) | TCGA-DI-A1BU-01 | Endometrium | uterine corpus endometrioid carcinoma | Female | <65 | I/II | Chemotherapy | paclitaxel | SD |
| Page: 1 2 3 |
Top |
Related drugs of malignant transformation related genes |
| Identification of chemicals and drugs interact with genes involved in malignant transfromation |
| (DGIdb 4.0) |
| Entrez ID | Symbol | Category | Interaction Types | Drug Claim Name | Drug Name | PMIDs |
| Page: 1 |

Copyright 2023-Present -The University of Texas Health Science Center at Houston |