
|
|||||
|
 | |
| |
| |
| |
| |
| |
|
Gene: RARRES2 |
Gene summary for RARRES2 |
| Gene information | Species | Human | Gene symbol | RARRES2 | Gene ID | 5919 |
| Gene name | retinoic acid receptor responder 2 | |
| Gene Alias | HP10433 | |
| Cytomap | 7q36.1 | |
| Gene Type | protein-coding | GO ID | GO:0001523 | UniProtAcc | A0A090N7U9 |
Top |
Malignant transformation analysis |
| Identification of the aberrant gene expression in precancerous and cancerous lesions by comparing the gene expression of stem-like cells in diseased tissues with normal stem cells |
| Entrez ID | Symbol | Replicates | Species | Organ | Tissue | Adj P-value | Log2FC | Malignancy |
| 5919 | RARRES2 | CA_HPV_1 | Human | Cervix | CC | 7.36e-13 | -4.02e-01 | 0.0264 |
| 5919 | RARRES2 | CA_HPV_2 | Human | Cervix | CC | 1.16e-09 | -4.05e-01 | 0.0391 |
| 5919 | RARRES2 | CA_HPV_3 | Human | Cervix | CC | 9.94e-04 | -3.26e-01 | 0.0414 |
| 5919 | RARRES2 | HSIL_HPV_1 | Human | Cervix | HSIL_HPV | 3.85e-03 | -3.20e-01 | 0.0116 |
| 5919 | RARRES2 | N_HPV_1 | Human | Cervix | N_HPV | 2.02e-03 | -2.99e-01 | 0.0079 |
| 5919 | RARRES2 | N_HPV_2 | Human | Cervix | N_HPV | 2.65e-03 | -2.57e-01 | -0.0131 |
| 5919 | RARRES2 | CCI_1 | Human | Cervix | CC | 6.10e-03 | -4.11e-01 | 0.528 |
| 5919 | RARRES2 | CCI_2 | Human | Cervix | CC | 1.57e-02 | -4.11e-01 | 0.5249 |
| 5919 | RARRES2 | CCI_3 | Human | Cervix | CC | 1.34e-04 | -4.11e-01 | 0.516 |
| 5919 | RARRES2 | CCII_1 | Human | Cervix | CC | 5.45e-05 | -3.99e-01 | 0.3249 |
| 5919 | RARRES2 | Tumor | Human | Cervix | CC | 7.36e-13 | -4.11e-01 | 0.1241 |
| 5919 | RARRES2 | sample3 | Human | Cervix | CC | 2.66e-15 | -4.11e-01 | 0.1387 |
| 5919 | RARRES2 | H2 | Human | Cervix | HSIL_HPV | 1.25e-05 | 3.47e-01 | 0.0632 |
| 5919 | RARRES2 | L1 | Human | Cervix | CC | 9.01e-04 | -3.42e-01 | 0.0802 |
| 5919 | RARRES2 | T1 | Human | Cervix | CC | 3.73e-02 | -2.69e-01 | 0.0918 |
| 5919 | RARRES2 | T2 | Human | Cervix | CC | 9.55e-05 | 6.99e-01 | 0.0709 |
| 5919 | RARRES2 | T3 | Human | Cervix | CC | 1.34e-14 | -4.11e-01 | 0.1389 |
| 5919 | RARRES2 | HTA11_866_2000001011 | Human | Colorectum | AD | 1.04e-02 | 6.82e-02 | -0.1001 |
| 5919 | RARRES2 | HTA11_2992_2000001011 | Human | Colorectum | SER | 9.15e-04 | 5.41e-01 | -0.1706 |
| 5919 | RARRES2 | AEH-subject1 | Human | Endometrium | AEH | 1.17e-46 | -8.04e-01 | -0.3059 |
| Page: 1 2 3 4 5 6 7 |
| Tissue | Expression Dynamics | Abbreviation |
| Cervix | 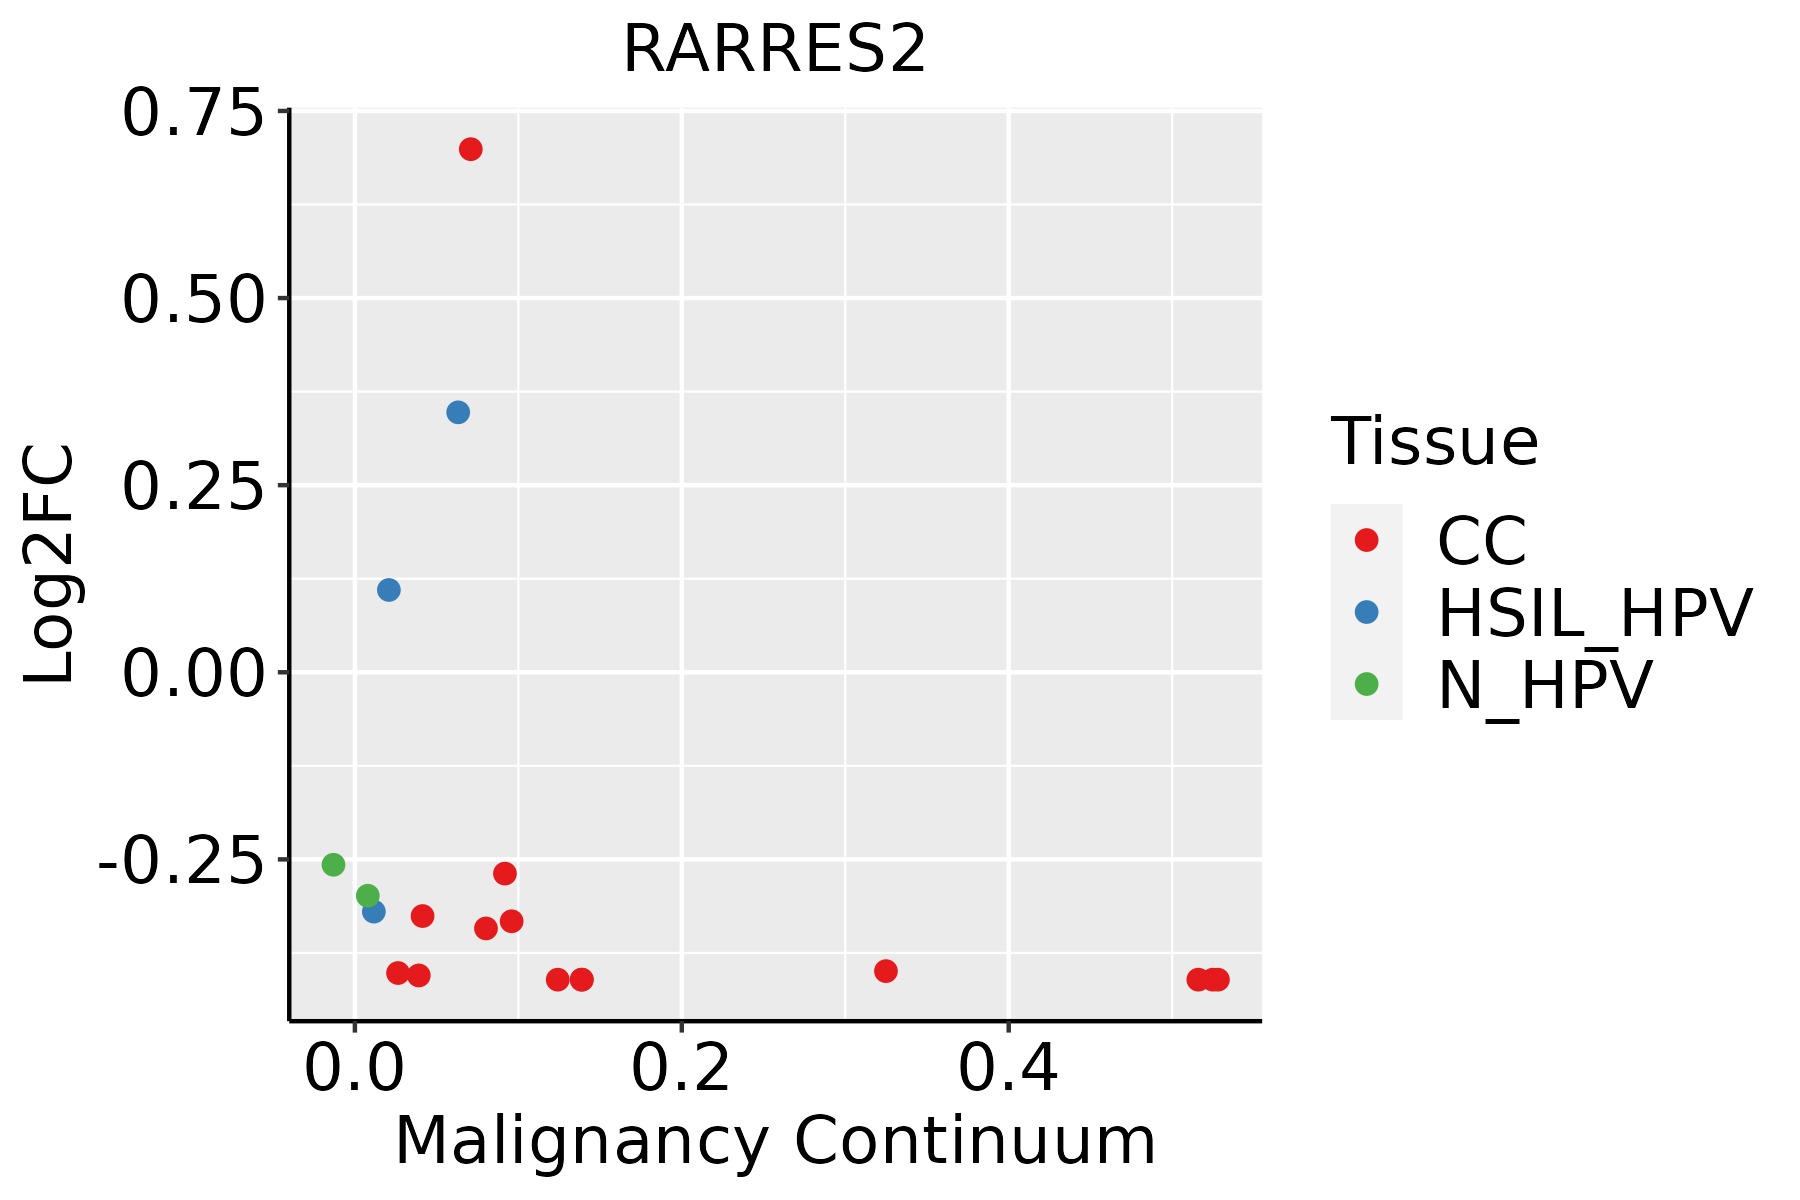 | CC: Cervix cancer |
| HSIL_HPV: HPV-infected high-grade squamous intraepithelial lesions | ||
| N_HPV: HPV-infected normal cervix | ||
| Colorectum (GSE201348) |  | FAP: Familial adenomatous polyposis |
| CRC: Colorectal cancer | ||
| Colorectum (HTA11) |  | AD: Adenomas |
| SER: Sessile serrated lesions | ||
| MSI-H: Microsatellite-high colorectal cancer | ||
| MSS: Microsatellite stable colorectal cancer | ||
| Endometrium | 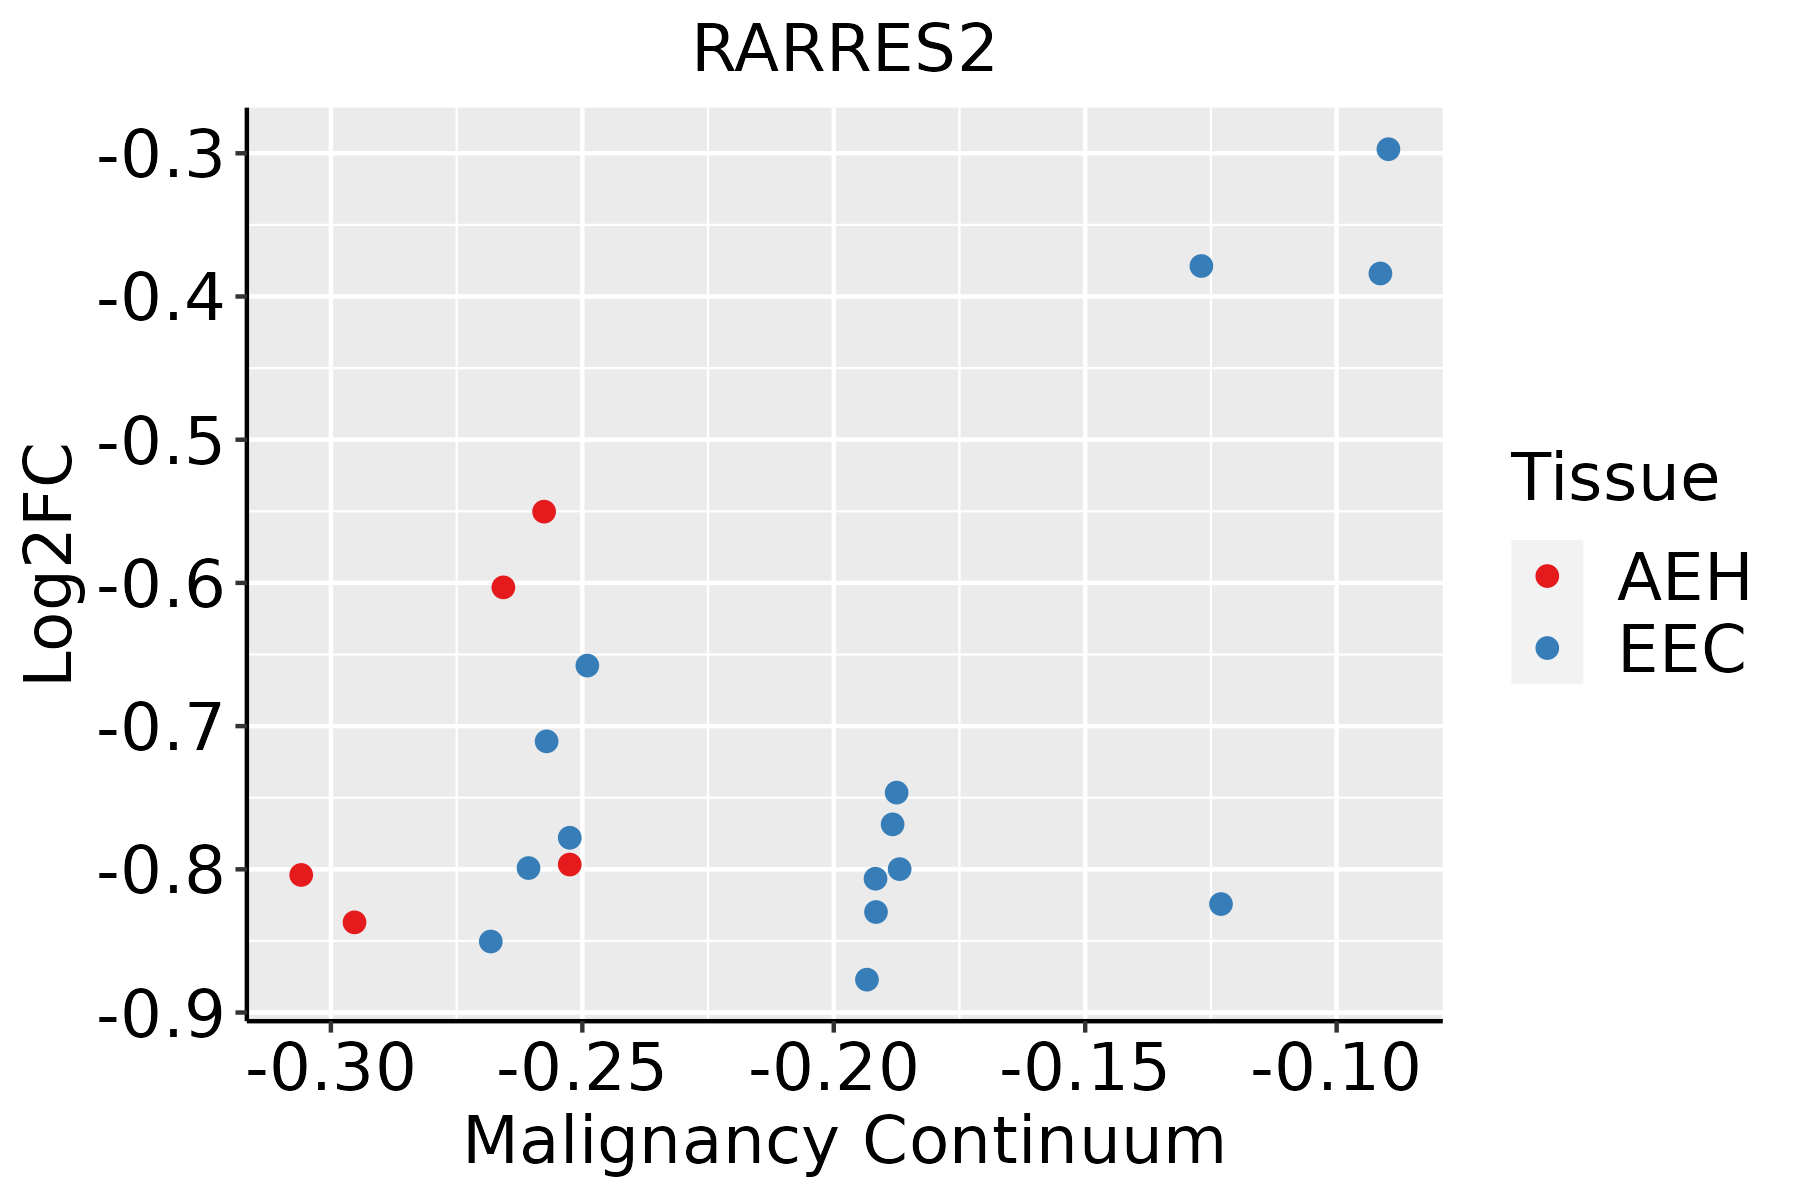 | AEH: Atypical endometrial hyperplasia |
| EEC: Endometrioid Cancer | ||
| Esophagus | 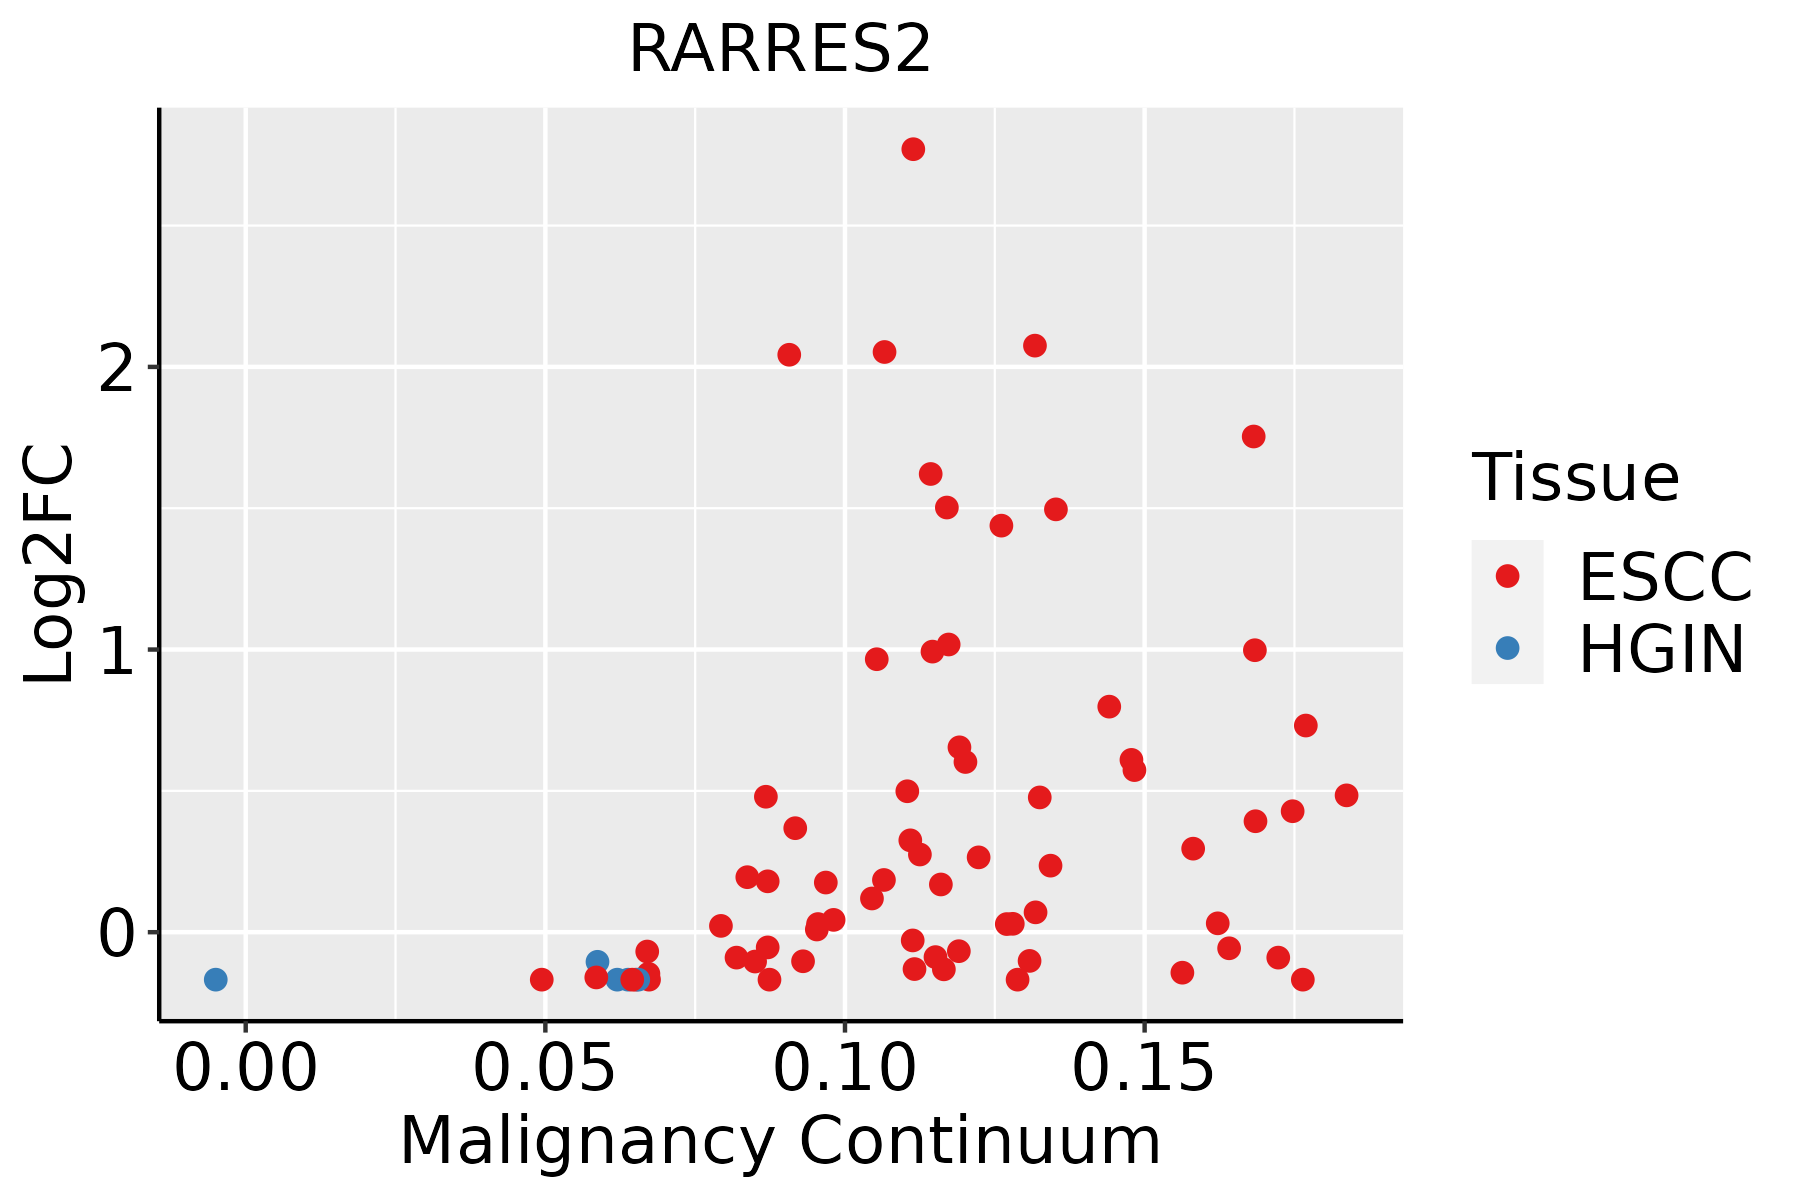 | ESCC: Esophageal squamous cell carcinoma |
| HGIN: High-grade intraepithelial neoplasias | ||
| LGIN: Low-grade intraepithelial neoplasias | ||
| Liver | 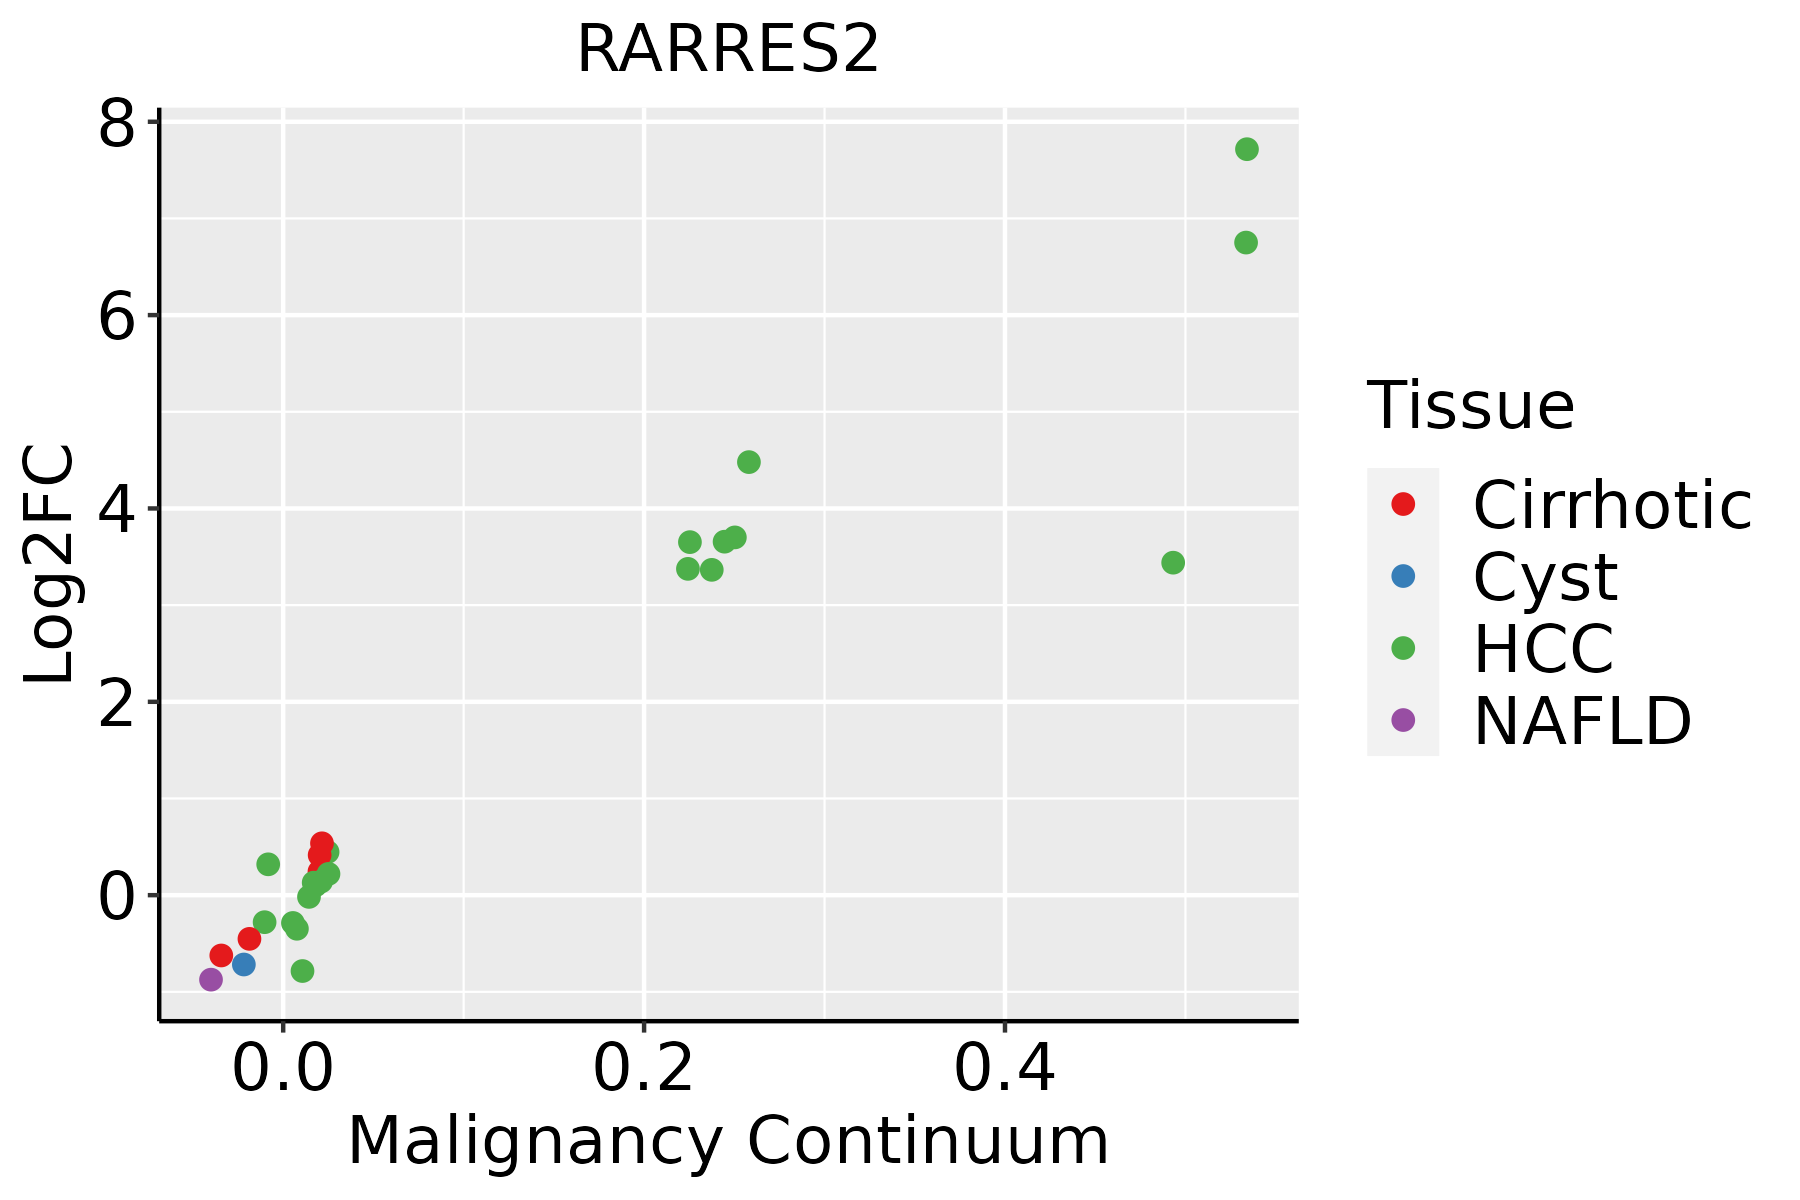 | HCC: Hepatocellular carcinoma |
| NAFLD: Non-alcoholic fatty liver disease | ||
| Oral Cavity |  | EOLP: Erosive Oral lichen planus |
| LP: leukoplakia | ||
| NEOLP: Non-erosive oral lichen planus | ||
| OSCC: Oral squamous cell carcinoma | ||
| Prostate | 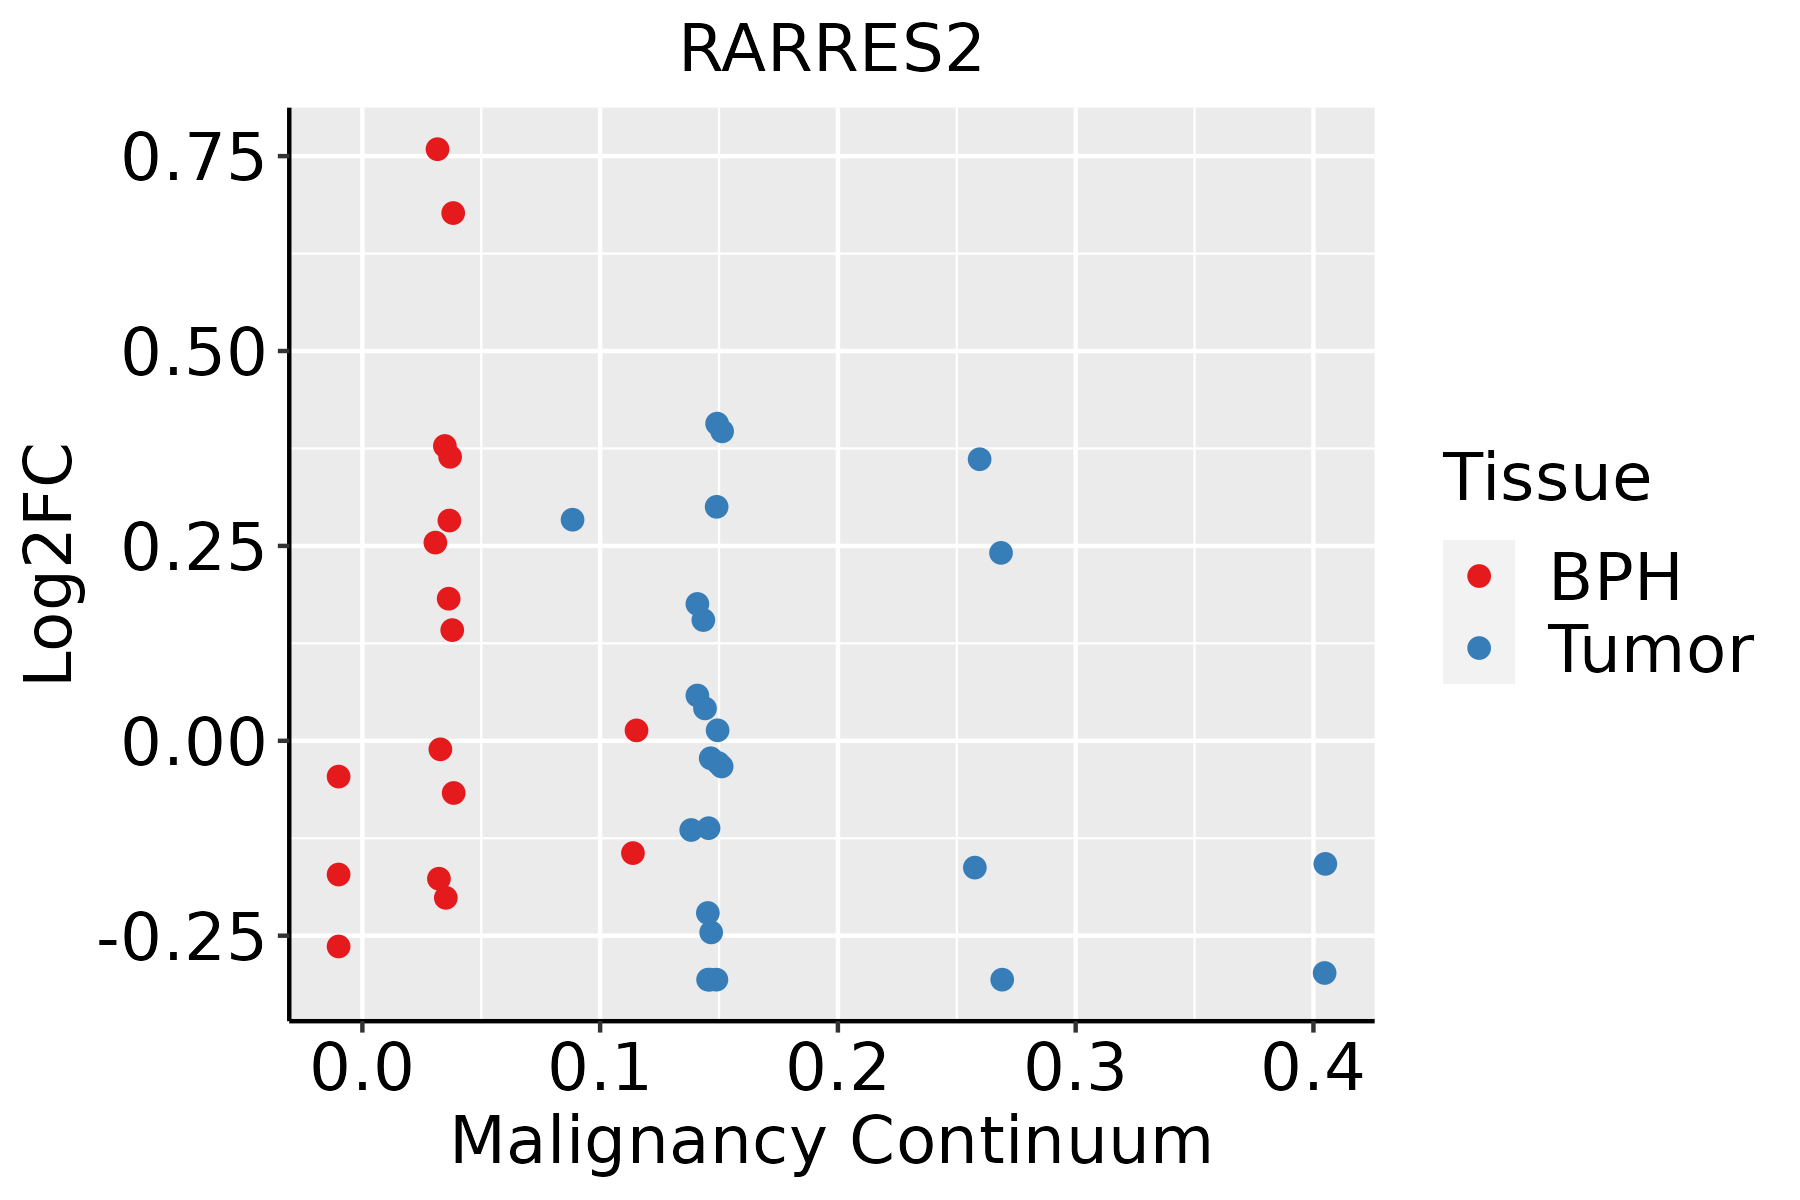 | BPH: Benign Prostatic Hyperplasia |
| Skin | 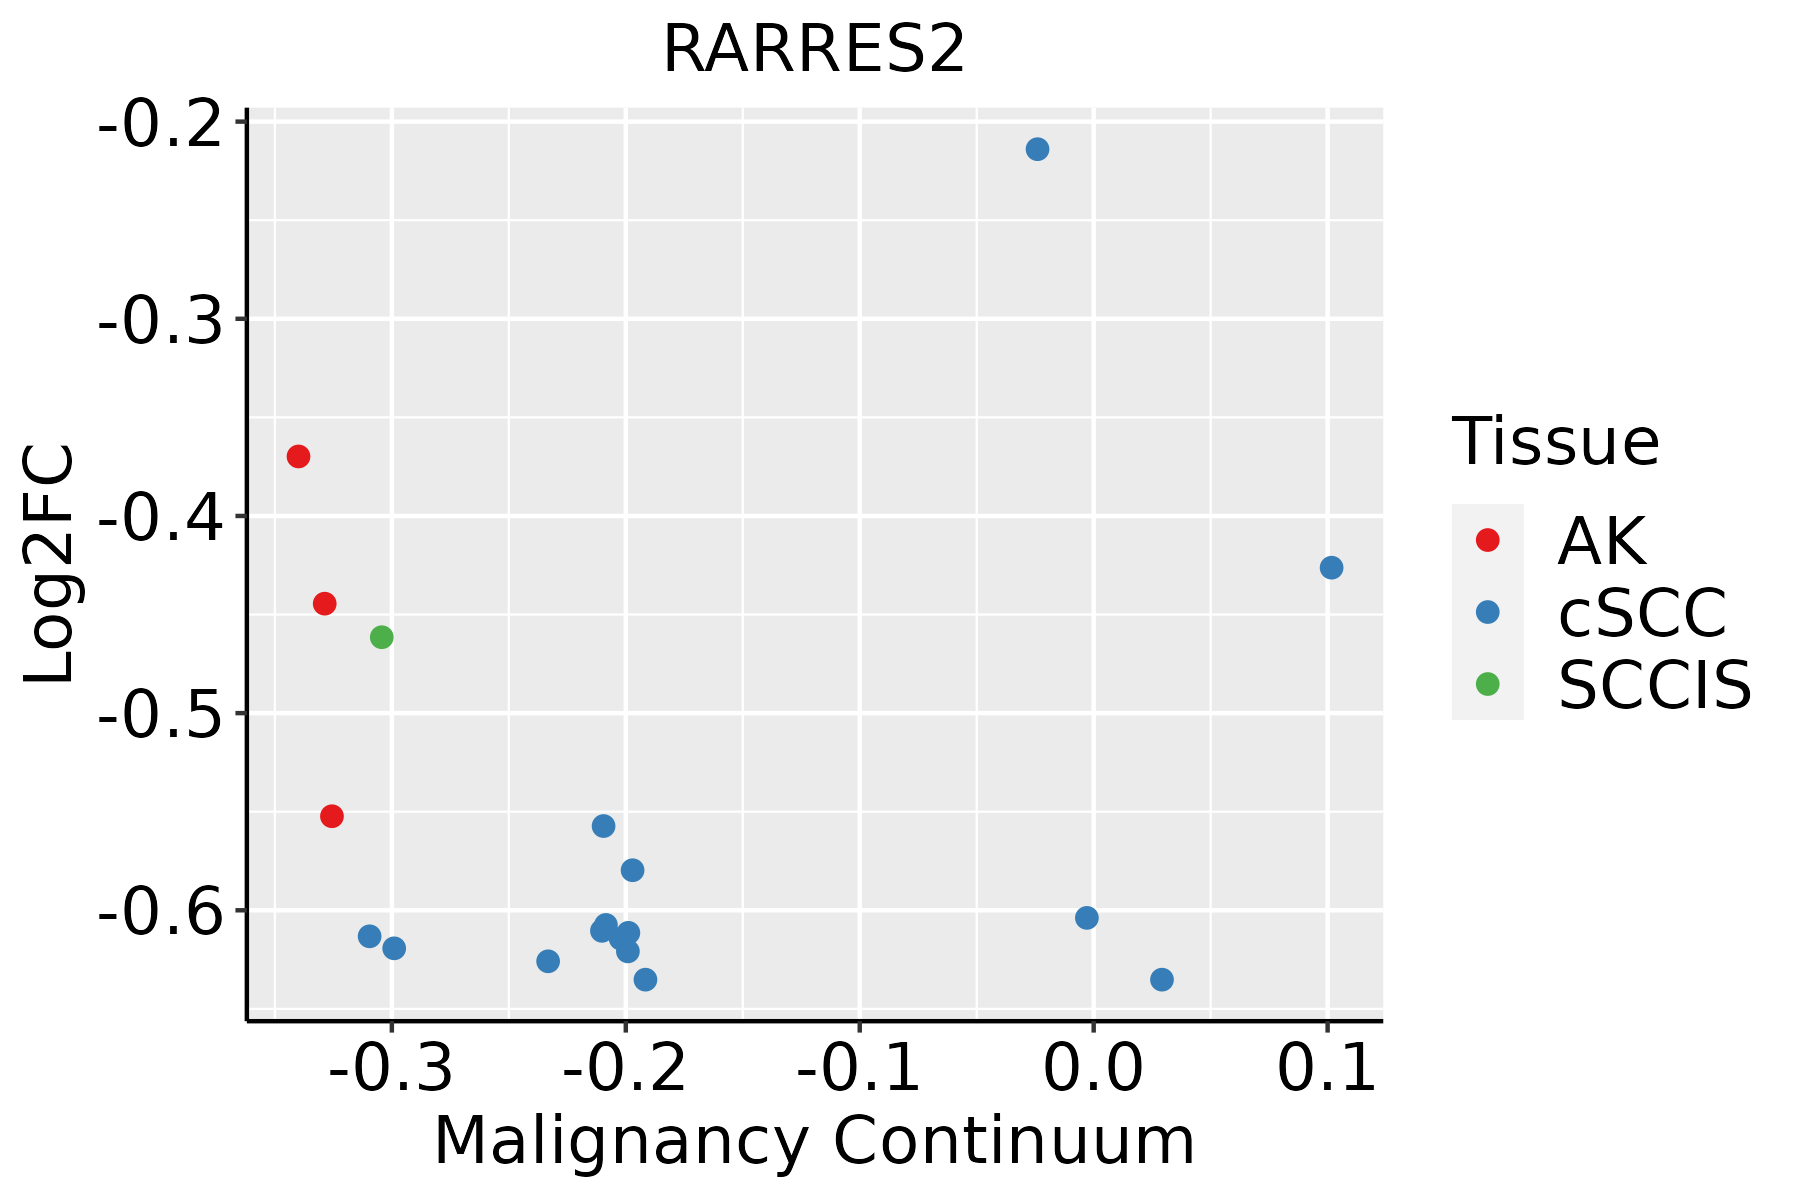 | AK: Actinic keratosis |
| cSCC: Cutaneous squamous cell carcinoma | ||
| SCCIS:squamous cell carcinoma in situ | ||
| Thyroid | 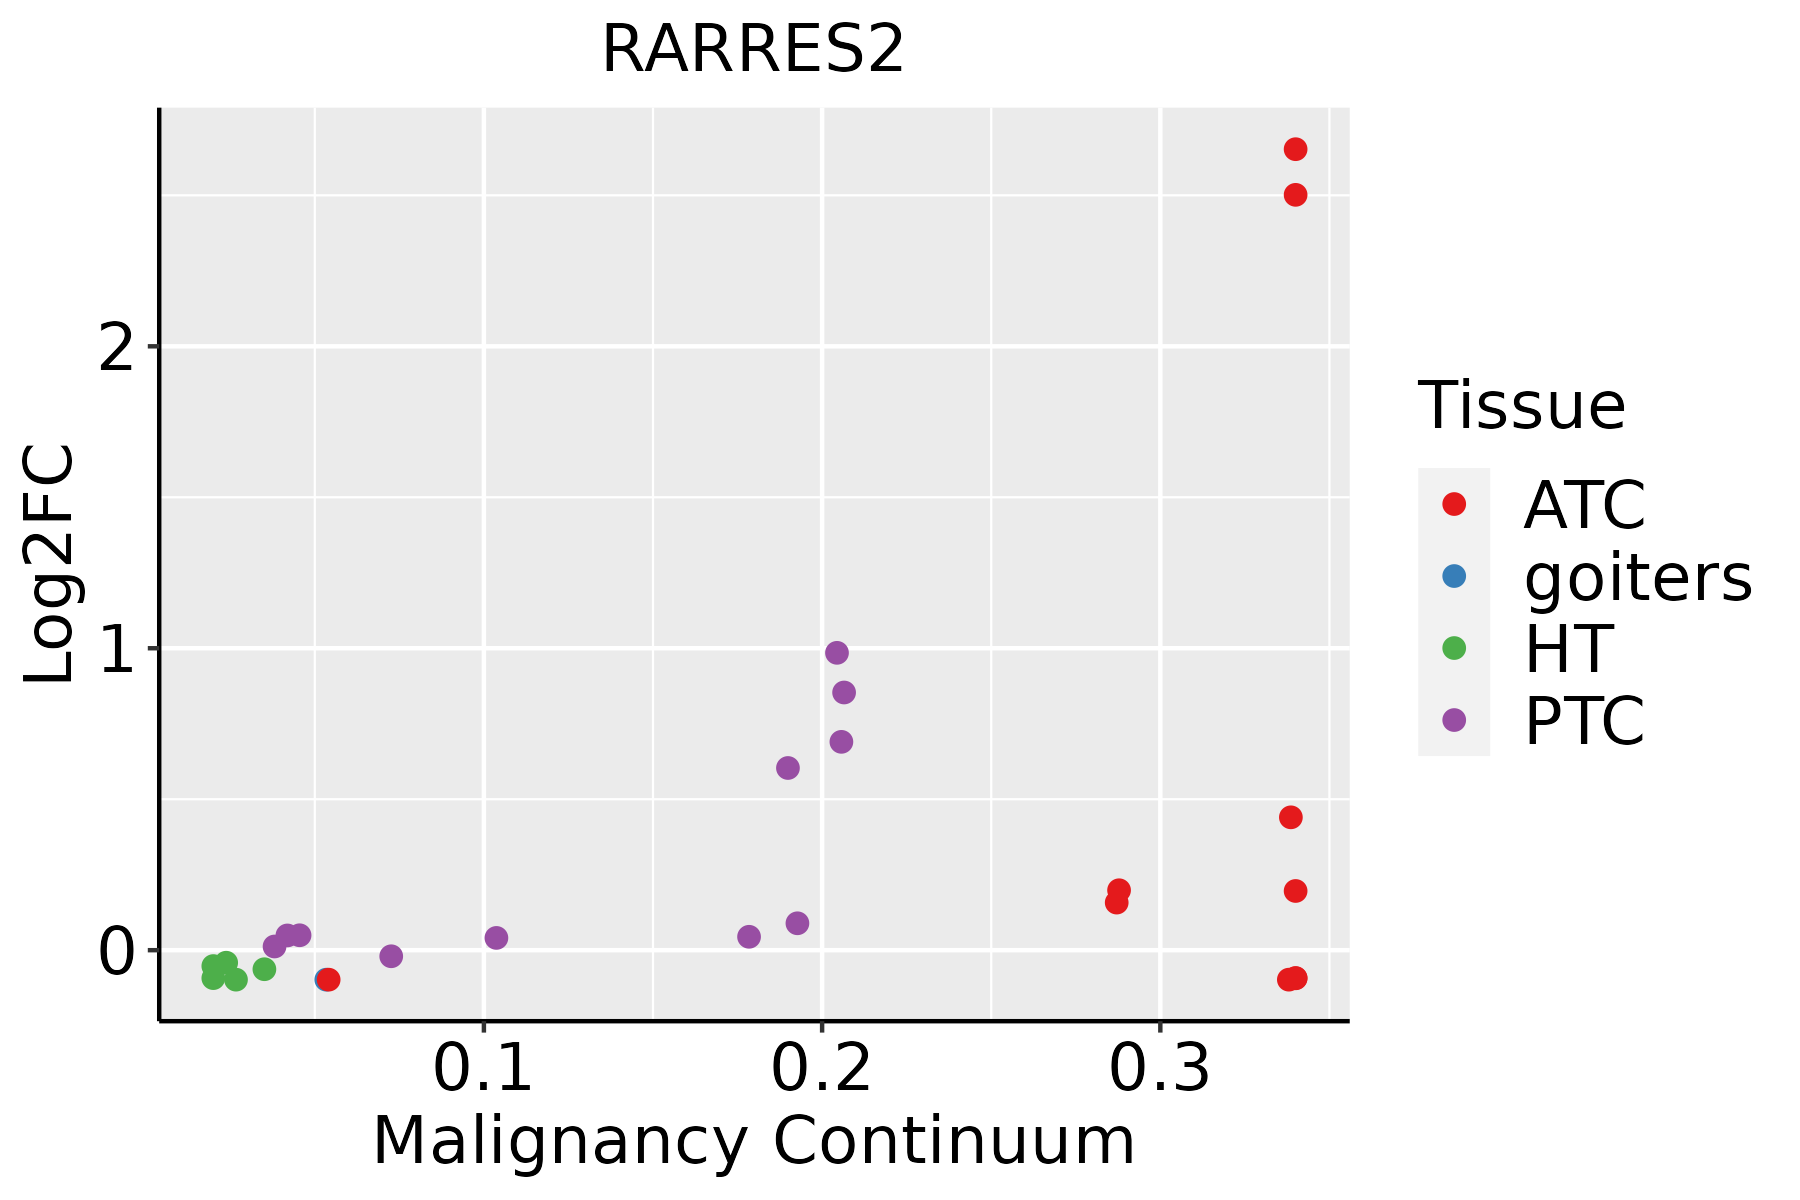 | ATC: Anaplastic thyroid cancer |
| HT: Hashimoto's thyroiditis | ||
| PTC: Papillary thyroid cancer |
| ∗log2FC in expression of this searched gene in stem-like cells from each diseased tissue sample relative to stem-like cells in normal samples in each tissue plotted against the malignancy continuum. Samples are colored based on if they are from different disease stage. |
Top |
Malignant transformation related pathway analysis |
| Find out the enriched GO biological processes and KEGG pathways involved in transition from healthy to precancer to cancer |
| Tissue | Disease Stage | Enriched GO biological Processes |
| Colorectum | AD |  |
| Colorectum | SER |  |
| Colorectum | MSS |  |
| Colorectum | MSI-H |  |
| Colorectum | FAP |  |
| ∗Top 15 enriched GO BP terms are showed in the bar plot of each disease state in each tissue. Each row represents a significant GO biological process which is colored according to the -log10(p.adjust). |
| Page: 1 2 3 4 5 6 7 8 9 |
| GO ID | Tissue | Disease Stage | Description | Gene Ratio | Bg Ratio | pvalue | p.adjust | Count |
| GO:00321035 | Cervix | CC | positive regulation of response to external stimulus | 95/2311 | 427/18723 | 5.44e-09 | 5.03e-07 | 95 |
| GO:00603267 | Cervix | CC | cell chemotaxis | 73/2311 | 310/18723 | 2.82e-08 | 1.96e-06 | 73 |
| GO:00975298 | Cervix | CC | myeloid leukocyte migration | 56/2311 | 220/18723 | 7.21e-08 | 4.15e-06 | 56 |
| GO:00305957 | Cervix | CC | leukocyte chemotaxis | 57/2311 | 230/18723 | 1.48e-07 | 7.07e-06 | 57 |
| GO:00716218 | Cervix | CC | granulocyte chemotaxis | 37/2311 | 125/18723 | 2.16e-07 | 9.56e-06 | 37 |
| GO:00509007 | Cervix | CC | leukocyte migration | 78/2311 | 369/18723 | 1.09e-06 | 3.80e-05 | 78 |
| GO:00975308 | Cervix | CC | granulocyte migration | 39/2311 | 148/18723 | 2.67e-06 | 7.87e-05 | 39 |
| GO:00026857 | Cervix | CC | regulation of leukocyte migration | 50/2311 | 210/18723 | 2.95e-06 | 8.31e-05 | 50 |
| GO:00026888 | Cervix | CC | regulation of leukocyte chemotaxis | 34/2311 | 122/18723 | 3.00e-06 | 8.38e-05 | 34 |
| GO:00454445 | Cervix | CC | fat cell differentiation | 53/2311 | 229/18723 | 3.72e-06 | 9.75e-05 | 53 |
| GO:003166710 | Cervix | CC | response to nutrient levels | 92/2311 | 474/18723 | 5.80e-06 | 1.42e-04 | 92 |
| GO:00509203 | Cervix | CC | regulation of chemotaxis | 51/2311 | 223/18723 | 8.03e-06 | 1.86e-04 | 51 |
| GO:00026878 | Cervix | CC | positive regulation of leukocyte migration | 35/2311 | 135/18723 | 1.25e-05 | 2.60e-04 | 35 |
| GO:00716755 | Cervix | CC | regulation of mononuclear cell migration | 31/2311 | 115/18723 | 1.67e-05 | 3.22e-04 | 31 |
| GO:19016538 | Cervix | CC | cellular response to peptide | 72/2311 | 359/18723 | 1.89e-05 | 3.48e-04 | 72 |
| GO:00026906 | Cervix | CC | positive regulation of leukocyte chemotaxis | 26/2311 | 94/18723 | 4.85e-05 | 7.34e-04 | 26 |
| GO:00509213 | Cervix | CC | positive regulation of chemotaxis | 34/2311 | 141/18723 | 8.19e-05 | 1.11e-03 | 34 |
| GO:00482464 | Cervix | CC | macrophage chemotaxis | 14/2311 | 38/18723 | 9.80e-05 | 1.27e-03 | 14 |
| GO:00434349 | Cervix | CC | response to peptide hormone | 77/2311 | 414/18723 | 1.40e-04 | 1.70e-03 | 77 |
| GO:00713757 | Cervix | CC | cellular response to peptide hormone stimulus | 57/2311 | 290/18723 | 2.32e-04 | 2.59e-03 | 57 |
| Page: 1 2 3 4 5 6 7 8 9 10 11 12 13 14 15 16 17 18 19 |
| Pathway ID | Tissue | Disease Stage | Description | Gene Ratio | Bg Ratio | pvalue | p.adjust | qvalue | Count |
| Page: 1 |
Top |
Cell-cell communication analysis |
| Identification of potential cell-cell interactions between two cell types and their ligand-receptor pairs for different disease states |
| Ligand | Receptor | LRpair | Pathway | Tissue | Disease Stage |
| RARRES2 | CMKLR1 | RARRES2_CMKLR1 | CHEMERIN | Breast | DCIS |
| RARRES2 | CMKLR1 | RARRES2_CMKLR1 | CHEMERIN | Breast | IDC |
| RARRES2 | CMKLR1 | RARRES2_CMKLR1 | CHEMERIN | Cervix | CC |
| RARRES2 | CMKLR1 | RARRES2_CMKLR1 | CHEMERIN | CRC | AD |
| RARRES2 | CMKLR1 | RARRES2_CMKLR1 | CHEMERIN | CRC | SER |
| RARRES2 | GPR1 | RARRES2_GPR1 | CHEMERIN | Endometrium | ADJ |
| RARRES2 | CMKLR1 | RARRES2_CMKLR1 | CHEMERIN | HNSCC | OSCC |
| RARRES2 | CMKLR1 | RARRES2_CMKLR1 | CHEMERIN | Liver | Healthy |
| RARRES2 | CMKLR1 | RARRES2_CMKLR1 | CHEMERIN | Lung | AAH |
| RARRES2 | CMKLR1 | RARRES2_CMKLR1 | CHEMERIN | THCA | ADJ |
| RARRES2 | CMKLR1 | RARRES2_CMKLR1 | CHEMERIN | THCA | Cancer |
| RARRES2 | CMKLR1 | RARRES2_CMKLR1 | CHEMERIN | THCA | Precancer |
| RARRES2 | CMKLR1 | RARRES2_CMKLR1 | CHEMERIN | THCA | PTC |
| Page: 1 |
Top |
Single-cell gene regulatory network inference analysis |
| Find out the significant the regulons (TFs) and the target genes of each regulon across cell types for different disease states |
| TF | Cell Type | Tissue | Disease Stage | Target Gene | RSS | Regulon Activity |
| ∗The dot plots of a searched regulon are shown for all cell subpopulations in each disease state of each tissue based on the regulon specific score inferred using pySCENIC and by calculating the average expression. |
| Page: 1 |
Top |
Somatic mutation of malignant transformation related genes |
| Annotation of somatic variants for genes involved in malignant transformation |
| Hugo Symbol | Variant Class | Variant Classification | dbSNP RS | HGVSc | HGVSp | HGVSp Short | SWISSPROT | BIOTYPE | SIFT | PolyPhen | Tumor Sample Barcode | Tissue | Histology | Sex | Age | Stage | Therapy Types | Drugs | Outcome |
| RARRES2 | SNV | Missense_Mutation | c.249N>T | p.Lys83Asn | p.K83N | Q99969 | protein_coding | deleterious(0.01) | possibly_damaging(0.801) | TCGA-AP-A059-01 | Endometrium | uterine corpus endometrioid carcinoma | Female | >=65 | I/II | Unknown | Unknown | SD | |
| RARRES2 | SNV | Missense_Mutation | novel | c.25N>A | p.Ala9Thr | p.A9T | Q99969 | protein_coding | deleterious_low_confidence(0) | benign(0.137) | TCGA-EO-A22U-01 | Endometrium | uterine corpus endometrioid carcinoma | Female | >=65 | I/II | Unknown | Unknown | SD |
| RARRES2 | SNV | Missense_Mutation | novel | c.292T>G | p.Cys98Gly | p.C98G | Q99969 | protein_coding | deleterious(0.01) | probably_damaging(0.996) | TCGA-CR-6482-01 | Oral cavity | head & neck squamous cell carcinoma | Male | <65 | I/II | Chemotherapy | paclitaxel | SD |
| RARRES2 | SNV | Missense_Mutation | novel | c.286N>G | p.Arg96Gly | p.R96G | Q99969 | protein_coding | deleterious(0.02) | probably_damaging(0.997) | TCGA-CR-7371-01 | Oral cavity | head & neck squamous cell carcinoma | Female | <65 | III/IV | Unknown | Unknown | SD |
| RARRES2 | SNV | Missense_Mutation | rs772969637 | c.337N>T | p.Arg113Trp | p.R113W | Q99969 | protein_coding | tolerated(0.13) | benign(0.005) | TCGA-CD-8527-01 | Stomach | stomach adenocarcinoma | Female | >=65 | I/II | Chemotherapy | epirubicin | PD |
| Page: 1 |
Top |
Related drugs of malignant transformation related genes |
| Identification of chemicals and drugs interact with genes involved in malignant transfromation |
| (DGIdb 4.0) |
| Entrez ID | Symbol | Category | Interaction Types | Drug Claim Name | Drug Name | PMIDs |
| Page: 1 |

Copyright 2023-Present -The University of Texas Health Science Center at Houston |