
|
|||||
|
 | |
| |
| |
| |
| |
| |
|
Gene: RARG |
Gene summary for RARG |
| Gene information | Species | Human | Gene symbol | RARG | Gene ID | 5916 |
| Gene name | retinoic acid receptor gamma | |
| Gene Alias | NR1B3 | |
| Cytomap | 12q13.13 | |
| Gene Type | protein-coding | GO ID | GO:0000003 | UniProtAcc | A8K3H3 |
Top |
Malignant transformation analysis |
| Identification of the aberrant gene expression in precancerous and cancerous lesions by comparing the gene expression of stem-like cells in diseased tissues with normal stem cells |
| Entrez ID | Symbol | Replicates | Species | Organ | Tissue | Adj P-value | Log2FC | Malignancy |
| 5916 | RARG | LZE5T | Human | Esophagus | ESCC | 2.68e-06 | 2.68e-01 | 0.0514 |
| 5916 | RARG | LZE8T | Human | Esophagus | ESCC | 6.31e-13 | 3.58e-01 | 0.067 |
| 5916 | RARG | LZE20T | Human | Esophagus | ESCC | 7.46e-12 | 2.17e-01 | 0.0662 |
| 5916 | RARG | LZE22D1 | Human | Esophagus | HGIN | 1.78e-02 | 1.06e-01 | 0.0595 |
| 5916 | RARG | LZE22T | Human | Esophagus | ESCC | 1.79e-02 | 3.20e-01 | 0.068 |
| 5916 | RARG | LZE24T | Human | Esophagus | ESCC | 5.02e-11 | 1.90e-01 | 0.0596 |
| 5916 | RARG | LZE21T | Human | Esophagus | ESCC | 1.75e-02 | 3.75e-01 | 0.0655 |
| 5916 | RARG | P1T-E | Human | Esophagus | ESCC | 4.56e-11 | 5.47e-01 | 0.0875 |
| 5916 | RARG | P2T-E | Human | Esophagus | ESCC | 8.50e-55 | 9.43e-01 | 0.1177 |
| 5916 | RARG | P4T-E | Human | Esophagus | ESCC | 1.08e-18 | 3.48e-01 | 0.1323 |
| 5916 | RARG | P5T-E | Human | Esophagus | ESCC | 2.97e-13 | 2.19e-01 | 0.1327 |
| 5916 | RARG | P8T-E | Human | Esophagus | ESCC | 2.97e-31 | 6.53e-01 | 0.0889 |
| 5916 | RARG | P9T-E | Human | Esophagus | ESCC | 9.19e-09 | 2.32e-01 | 0.1131 |
| 5916 | RARG | P10T-E | Human | Esophagus | ESCC | 1.67e-23 | 4.34e-01 | 0.116 |
| 5916 | RARG | P11T-E | Human | Esophagus | ESCC | 2.35e-10 | 3.83e-01 | 0.1426 |
| 5916 | RARG | P12T-E | Human | Esophagus | ESCC | 3.01e-26 | 5.84e-01 | 0.1122 |
| 5916 | RARG | P15T-E | Human | Esophagus | ESCC | 5.66e-33 | 8.73e-01 | 0.1149 |
| 5916 | RARG | P16T-E | Human | Esophagus | ESCC | 7.77e-27 | 5.26e-01 | 0.1153 |
| 5916 | RARG | P17T-E | Human | Esophagus | ESCC | 2.12e-08 | 4.14e-01 | 0.1278 |
| 5916 | RARG | P19T-E | Human | Esophagus | ESCC | 4.77e-03 | 3.68e-01 | 0.1662 |
| Page: 1 2 3 4 5 |
| Tissue | Expression Dynamics | Abbreviation |
| Esophagus | 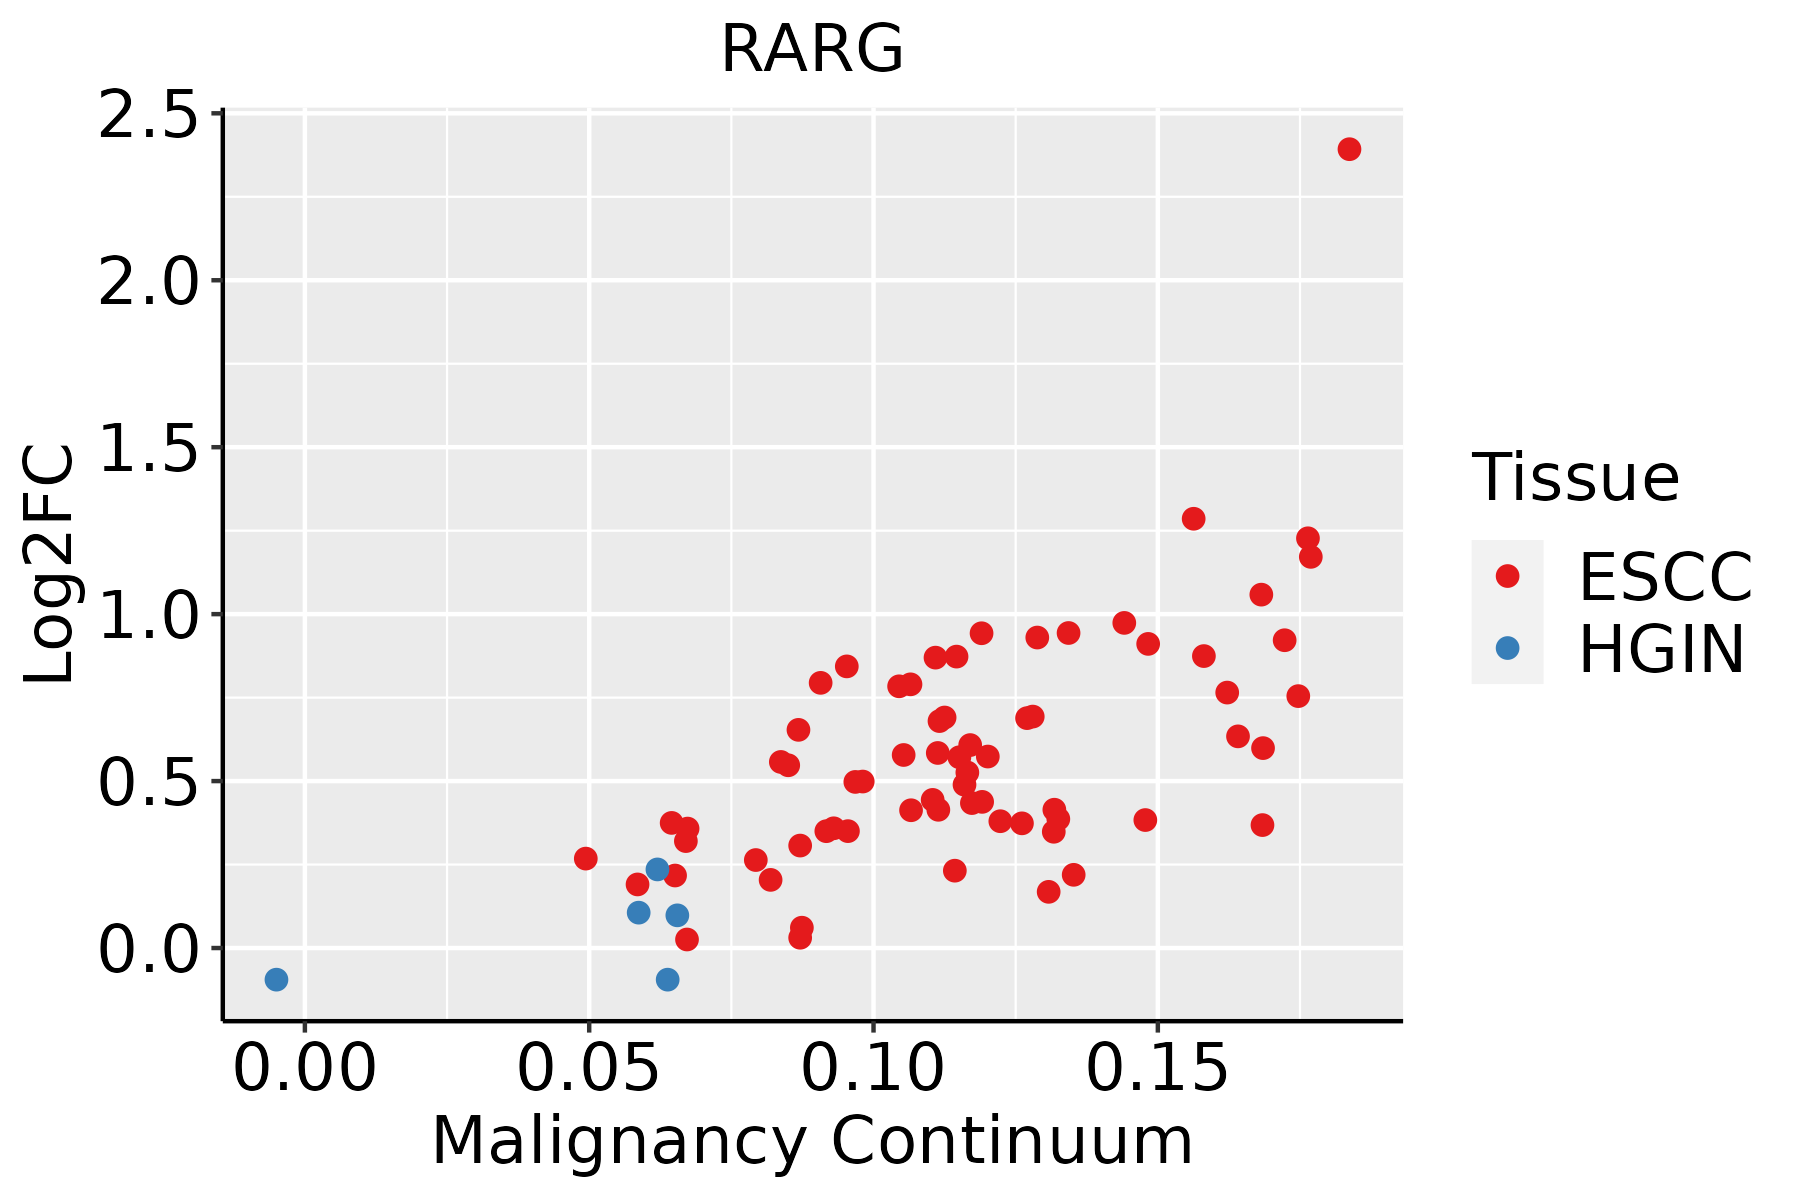 | ESCC: Esophageal squamous cell carcinoma |
| HGIN: High-grade intraepithelial neoplasias | ||
| LGIN: Low-grade intraepithelial neoplasias | ||
| Oral Cavity | 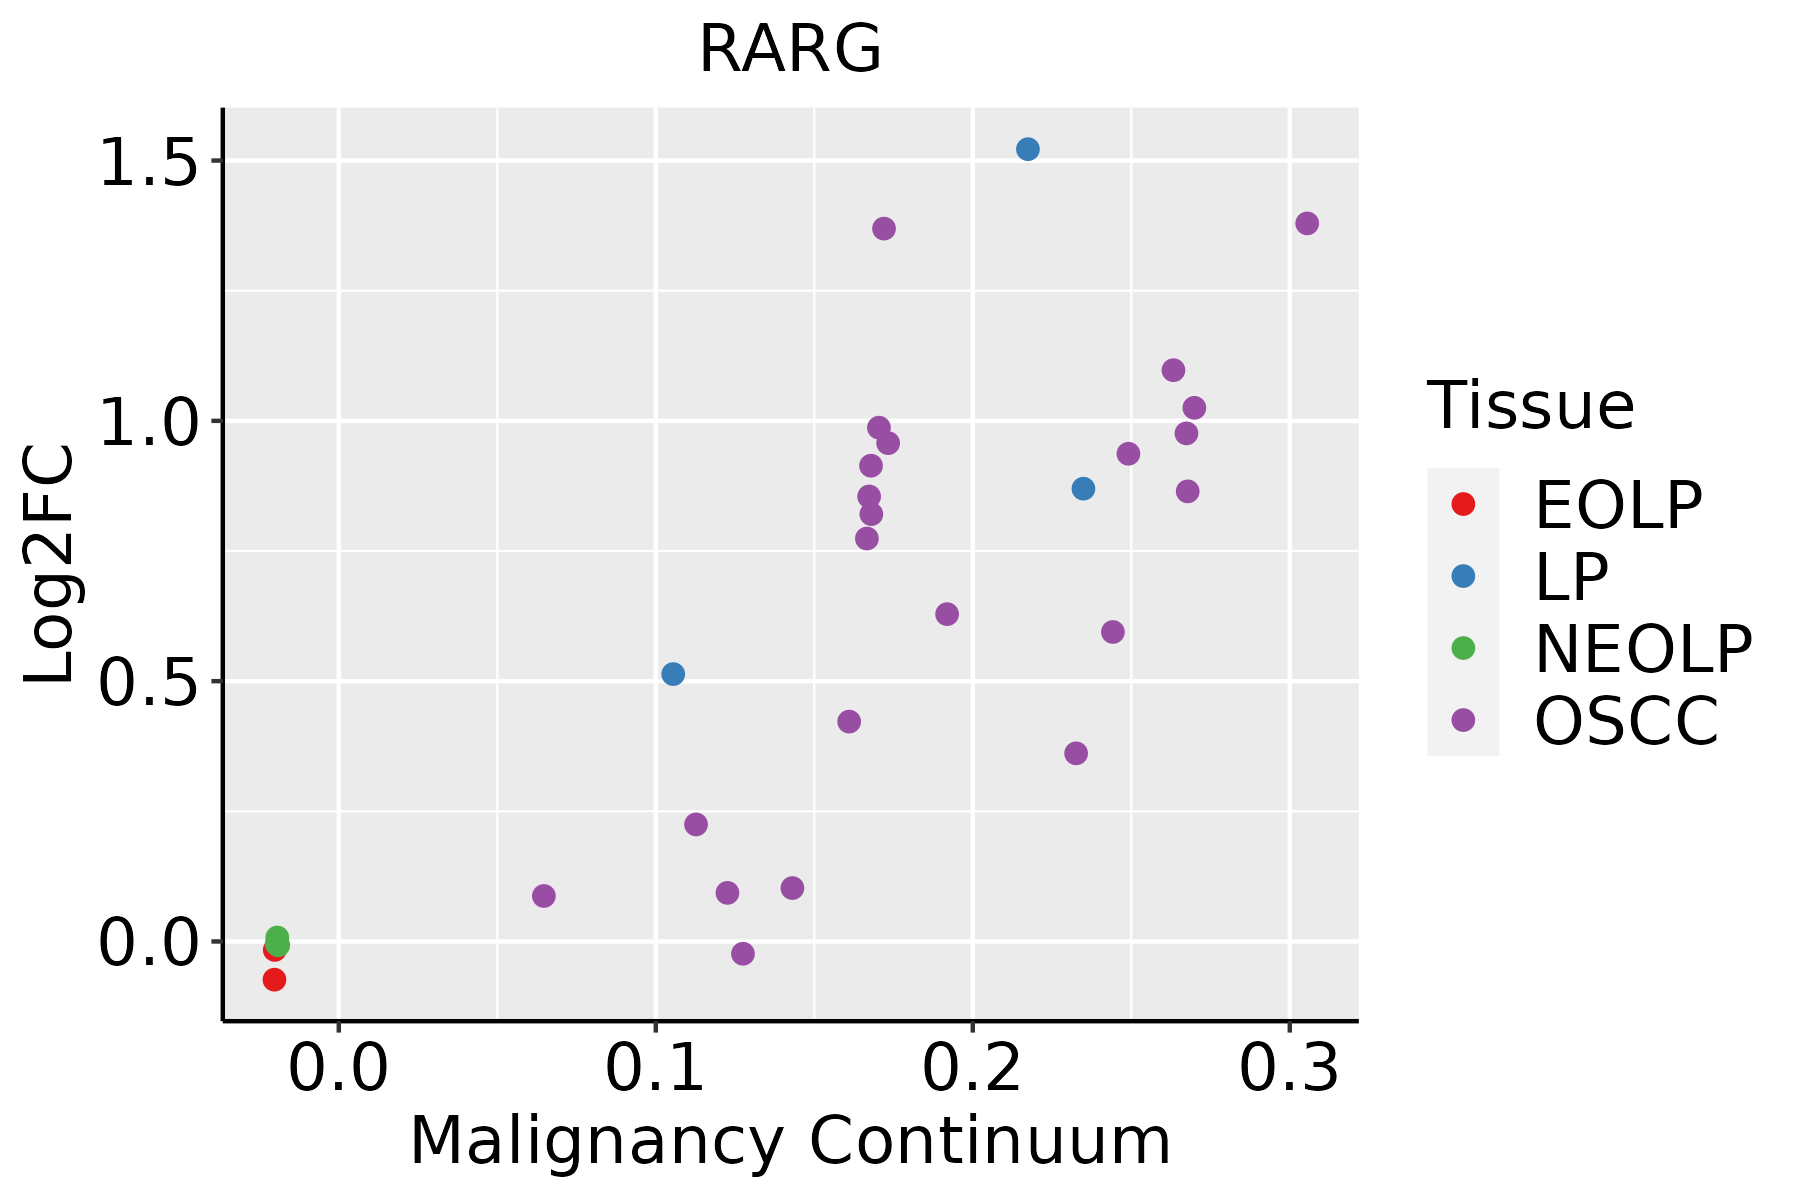 | EOLP: Erosive Oral lichen planus |
| LP: leukoplakia | ||
| NEOLP: Non-erosive oral lichen planus | ||
| OSCC: Oral squamous cell carcinoma | ||
| Skin | 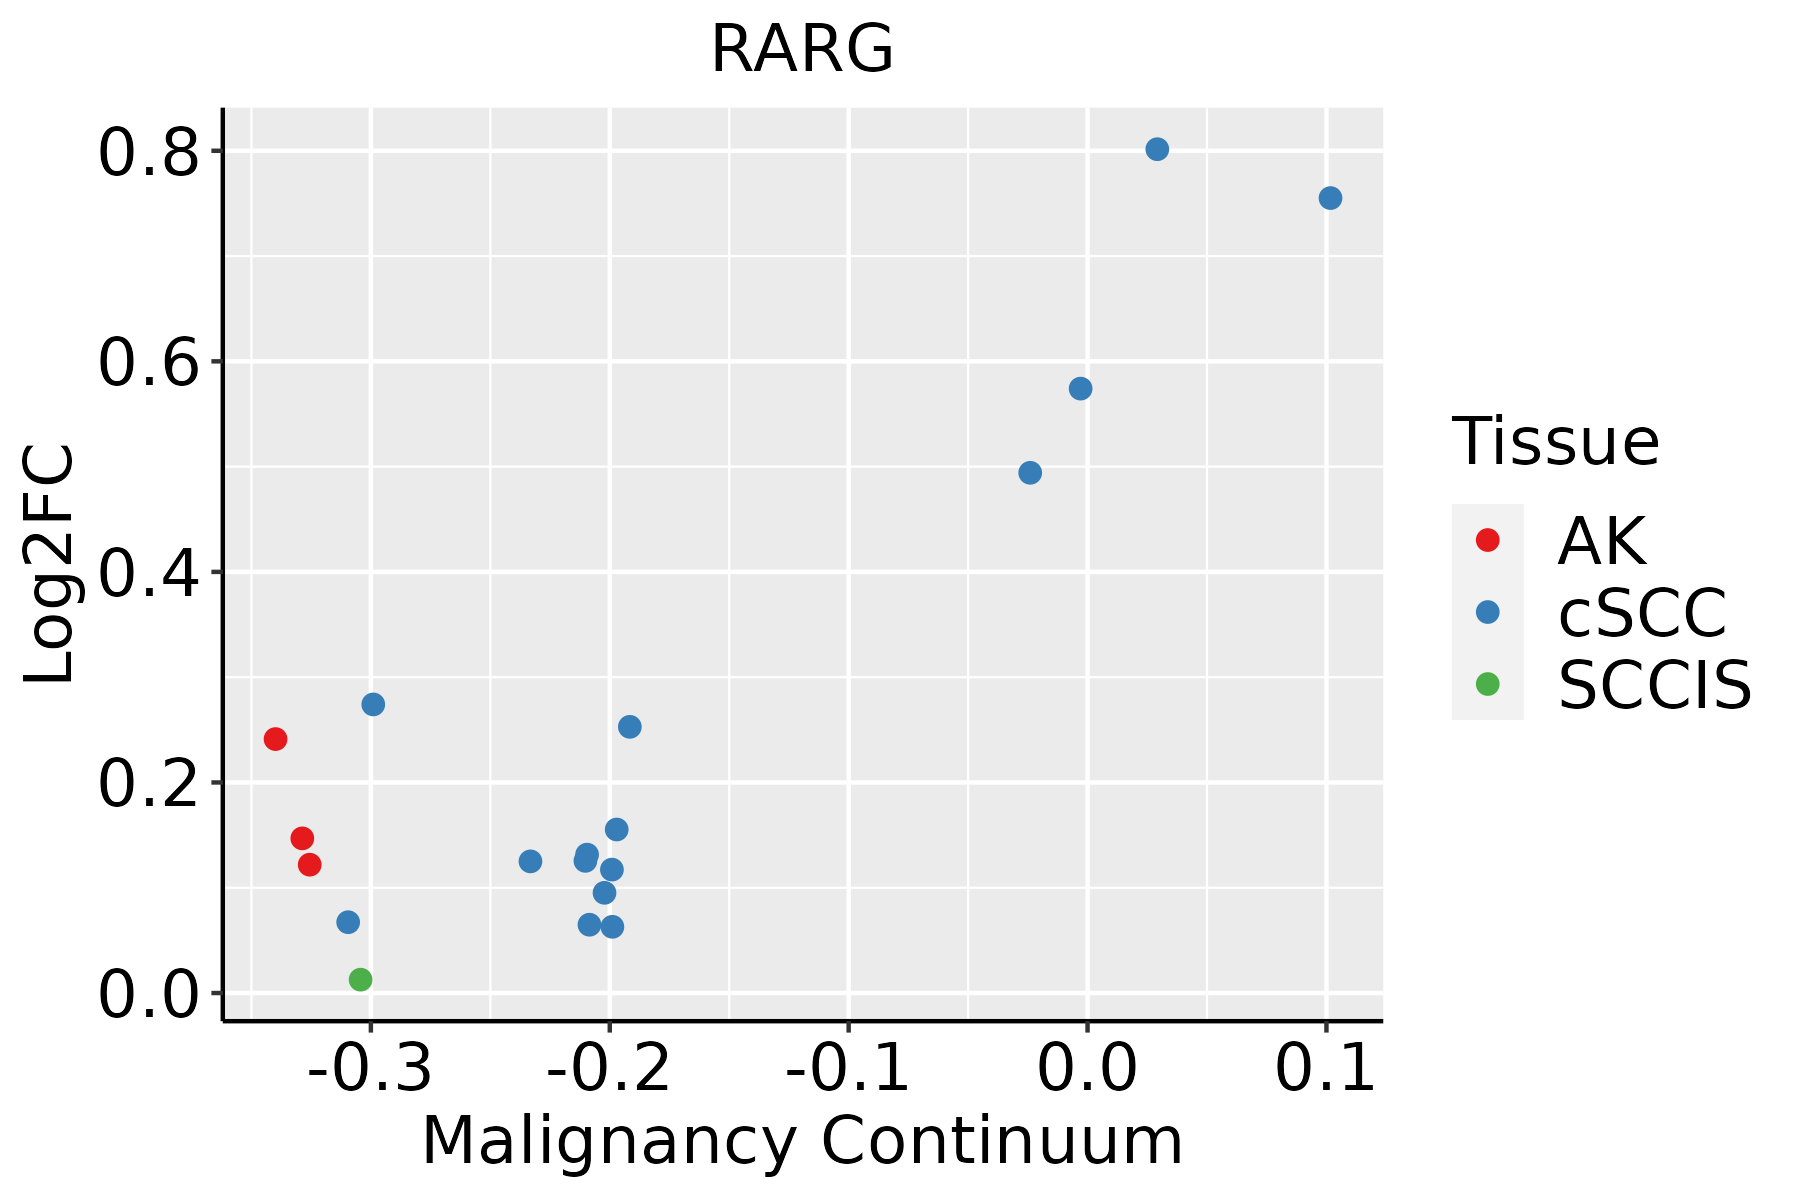 | AK: Actinic keratosis |
| cSCC: Cutaneous squamous cell carcinoma | ||
| SCCIS:squamous cell carcinoma in situ |
| ∗log2FC in expression of this searched gene in stem-like cells from each diseased tissue sample relative to stem-like cells in normal samples in each tissue plotted against the malignancy continuum. Samples are colored based on if they are from different disease stage. |
Top |
Malignant transformation related pathway analysis |
| Find out the enriched GO biological processes and KEGG pathways involved in transition from healthy to precancer to cancer |
| Tissue | Disease Stage | Enriched GO biological Processes |
| Colorectum | AD |  |
| Colorectum | SER |  |
| Colorectum | MSS |  |
| Colorectum | MSI-H |  |
| Colorectum | FAP |  |
| ∗Top 15 enriched GO BP terms are showed in the bar plot of each disease state in each tissue. Each row represents a significant GO biological process which is colored according to the -log10(p.adjust). |
| Page: 1 2 3 4 5 6 7 8 9 |
| GO ID | Tissue | Disease Stage | Description | Gene Ratio | Bg Ratio | pvalue | p.adjust | Count |
| GO:003009927 | Esophagus | HGIN | myeloid cell differentiation | 83/2587 | 381/18723 | 1.26e-05 | 3.52e-04 | 83 |
| GO:003052220 | Esophagus | HGIN | intracellular receptor signaling pathway | 62/2587 | 265/18723 | 1.63e-05 | 4.50e-04 | 62 |
| GO:004563725 | Esophagus | HGIN | regulation of myeloid cell differentiation | 49/2587 | 210/18723 | 1.28e-04 | 2.61e-03 | 49 |
| GO:004873225 | Esophagus | HGIN | gland development | 88/2587 | 436/18723 | 1.34e-04 | 2.71e-03 | 88 |
| GO:001604919 | Esophagus | HGIN | cell growth | 93/2587 | 482/18723 | 4.49e-04 | 6.62e-03 | 93 |
| GO:00483844 | Esophagus | HGIN | retinoic acid receptor signaling pathway | 11/2587 | 31/18723 | 2.02e-03 | 2.12e-02 | 11 |
| GO:001605516 | Esophagus | HGIN | Wnt signaling pathway | 83/2587 | 444/18723 | 2.27e-03 | 2.33e-02 | 83 |
| GO:019873816 | Esophagus | HGIN | cell-cell signaling by wnt | 83/2587 | 446/18723 | 2.58e-03 | 2.55e-02 | 83 |
| GO:00018438 | Esophagus | HGIN | neural tube closure | 22/2587 | 88/18723 | 3.57e-03 | 3.27e-02 | 22 |
| GO:00018389 | Esophagus | HGIN | embryonic epithelial tube formation | 28/2587 | 121/18723 | 3.72e-03 | 3.39e-02 | 28 |
| GO:00140209 | Esophagus | HGIN | primary neural tube formation | 23/2587 | 94/18723 | 3.92e-03 | 3.54e-02 | 23 |
| GO:19908308 | Esophagus | HGIN | cellular response to leukemia inhibitory factor | 23/2587 | 94/18723 | 3.92e-03 | 3.54e-02 | 23 |
| GO:00606067 | Esophagus | HGIN | tube closure | 22/2587 | 89/18723 | 4.14e-03 | 3.70e-02 | 22 |
| GO:190370620 | Esophagus | HGIN | regulation of hemopoiesis | 69/2587 | 367/18723 | 4.39e-03 | 3.86e-02 | 69 |
| GO:19908238 | Esophagus | HGIN | response to leukemia inhibitory factor | 23/2587 | 95/18723 | 4.51e-03 | 3.93e-02 | 23 |
| GO:006145819 | Esophagus | HGIN | reproductive system development | 78/2587 | 427/18723 | 5.53e-03 | 4.52e-02 | 78 |
| GO:000184114 | Esophagus | HGIN | neural tube formation | 24/2587 | 102/18723 | 5.54e-03 | 4.52e-02 | 24 |
| GO:0048732111 | Esophagus | ESCC | gland development | 269/8552 | 436/18723 | 7.81e-12 | 2.95e-10 | 269 |
| GO:0016049110 | Esophagus | ESCC | cell growth | 289/8552 | 482/18723 | 1.29e-10 | 3.77e-09 | 289 |
| GO:001605517 | Esophagus | ESCC | Wnt signaling pathway | 268/8552 | 444/18723 | 2.32e-10 | 6.58e-09 | 268 |
| Page: 1 2 3 4 5 6 7 8 |
| Pathway ID | Tissue | Disease Stage | Description | Gene Ratio | Bg Ratio | pvalue | p.adjust | qvalue | Count |
| Page: 1 |
Top |
Cell-cell communication analysis |
| Identification of potential cell-cell interactions between two cell types and their ligand-receptor pairs for different disease states |
| Ligand | Receptor | LRpair | Pathway | Tissue | Disease Stage |
| Page: 1 |
Top |
Single-cell gene regulatory network inference analysis |
| Find out the significant the regulons (TFs) and the target genes of each regulon across cell types for different disease states |
| TF | Cell Type | Tissue | Disease Stage | Target Gene | RSS | Regulon Activity |
| RARG | TRANS | Cervix | ADJ | TRIM29,ANKRD65,PROM2, etc. | 1.35e-01 |  |
| RARG | INCAF | Cervix | HSIL_HPV | NEFM,COL1A1,COL3A1, etc. | 7.73e-01 |  |
| RARG | END | Colorectum | AD | PLPP3,PRSS23,RGCC, etc. | 4.80e-01 |  |
| RARG | END | Colorectum | CRC | PLPP3,PRSS23,RGCC, etc. | 3.71e-01 |  |
| RARG | END | Colorectum | FAP | PLPP3,PRSS23,RGCC, etc. | 3.64e-01 |  |
| RARG | END | Colorectum | MSS | PLPP3,PRSS23,RGCC, etc. | 4.76e-01 |  |
| RARG | KER | Esophagus | HGIN | LY6D,IL20RB,PKP3, etc. | 2.85e-01 |  |
| RARG | TREG | Esophagus | ADJ | AURKA,TMEM68,ATXN7L2, etc. | 1.46e-02 |  |
| RARG | MVA | Liver | HCC | FBLN2,LYVE1,COL8A1, etc. | 4.20e-01 |  |
| RARG | BMEM | Lung | Healthy | PTPN11,LRRC8D,THYN1, etc. | 1.28e-03 |  |
| ∗The dot plots of a searched regulon are shown for all cell subpopulations in each disease state of each tissue based on the regulon specific score inferred using pySCENIC and by calculating the average expression. |
| Page: 1 2 |
Top |
Somatic mutation of malignant transformation related genes |
| Annotation of somatic variants for genes involved in malignant transformation |
| Hugo Symbol | Variant Class | Variant Classification | dbSNP RS | HGVSc | HGVSp | HGVSp Short | SWISSPROT | BIOTYPE | SIFT | PolyPhen | Tumor Sample Barcode | Tissue | Histology | Sex | Age | Stage | Therapy Types | Drugs | Outcome |
| RARG | SNV | Missense_Mutation | c.914N>A | p.Gly305Glu | p.G305E | P13631 | protein_coding | deleterious(0) | probably_damaging(1) | TCGA-A8-A08L-01 | Breast | breast invasive carcinoma | Female | >=65 | III/IV | Unknown | Unknown | SD | |
| RARG | SNV | Missense_Mutation | c.34G>T | p.Gly12Cys | p.G12C | P13631 | protein_coding | deleterious_low_confidence(0) | benign(0.089) | TCGA-AN-A0AM-01 | Breast | breast invasive carcinoma | Female | <65 | I/II | Unknown | Unknown | SD | |
| RARG | SNV | Missense_Mutation | rs754842832 | c.1021N>T | p.Arg341Cys | p.R341C | P13631 | protein_coding | deleterious(0) | probably_damaging(0.999) | TCGA-B6-A0I2-01 | Breast | breast invasive carcinoma | Female | <65 | I/II | Unknown | Unknown | SD |
| RARG | deletion | Frame_Shift_Del | novel | c.1333delN | p.Gln445ArgfsTer6 | p.Q445Rfs*6 | P13631 | protein_coding | TCGA-D8-A27V-01 | Breast | breast invasive carcinoma | Female | <65 | I/II | Hormone Therapy | tamoxiphen | SD | ||
| RARG | SNV | Missense_Mutation | novel | c.784C>G | p.Leu262Val | p.L262V | P13631 | protein_coding | deleterious(0) | probably_damaging(0.997) | TCGA-C5-A3HD-01 | Cervix | cervical & endocervical cancer | Female | <65 | I/II | Chemotherapy | cisplatin | SD |
| RARG | SNV | Missense_Mutation | novel | c.1186N>G | p.Arg396Gly | p.R396G | P13631 | protein_coding | deleterious(0) | possibly_damaging(0.68) | TCGA-DS-A3LQ-01 | Cervix | cervical & endocervical cancer | Female | <65 | III/IV | Chemotherapy | cisplatin | SD |
| RARG | SNV | Missense_Mutation | c.864C>G | p.Phe288Leu | p.F288L | P13631 | protein_coding | tolerated(0.38) | probably_damaging(0.996) | TCGA-JW-A5VL-01 | Cervix | cervical & endocervical cancer | Female | <65 | I/II | Unknown | Unknown | SD | |
| RARG | SNV | Missense_Mutation | c.608C>T | p.Ser203Leu | p.S203L | P13631 | protein_coding | tolerated(0.05) | probably_damaging(0.995) | TCGA-JW-A5VL-01 | Cervix | cervical & endocervical cancer | Female | <65 | I/II | Unknown | Unknown | SD | |
| RARG | SNV | Missense_Mutation | novel | c.1183G>A | p.Glu395Lys | p.E395K | P13631 | protein_coding | deleterious(0.01) | benign(0.345) | TCGA-VS-A953-01 | Cervix | cervical & endocervical cancer | Female | <65 | I/II | Unknown | Unknown | PD |
| RARG | SNV | Missense_Mutation | rs769476878 | c.245N>T | p.Pro82Leu | p.P82L | P13631 | protein_coding | deleterious(0.02) | benign(0.418) | TCGA-AA-3713-01 | Colorectum | colon adenocarcinoma | Male | >=65 | III/IV | Chemotherapy | 5-fluorouracil | PR |
| Page: 1 2 3 4 5 6 |
Top |
Related drugs of malignant transformation related genes |
| Identification of chemicals and drugs interact with genes involved in malignant transfromation |
| (DGIdb 4.0) |
| Entrez ID | Symbol | Category | Interaction Types | Drug Claim Name | Drug Name | PMIDs |
| 5916 | RARG | NUCLEAR HORMONE RECEPTOR, DRUGGABLE GENOME, TRANSCRIPTION FACTOR COMPLEX | PMID27336223-Compound-12 | |||
| 5916 | RARG | NUCLEAR HORMONE RECEPTOR, DRUGGABLE GENOME, TRANSCRIPTION FACTOR COMPLEX | agonist | 135650917 | ||
| 5916 | RARG | NUCLEAR HORMONE RECEPTOR, DRUGGABLE GENOME, TRANSCRIPTION FACTOR COMPLEX | agonist | CHEMBL38 | TRETINOIN | |
| 5916 | RARG | NUCLEAR HORMONE RECEPTOR, DRUGGABLE GENOME, TRANSCRIPTION FACTOR COMPLEX | agonist | CHEMBL547 | ISOTRETINOIN | |
| 5916 | RARG | NUCLEAR HORMONE RECEPTOR, DRUGGABLE GENOME, TRANSCRIPTION FACTOR COMPLEX | PMID27336223-Compound-11 | |||
| 5916 | RARG | NUCLEAR HORMONE RECEPTOR, DRUGGABLE GENOME, TRANSCRIPTION FACTOR COMPLEX | antagonist | 135649903 | ||
| 5916 | RARG | NUCLEAR HORMONE RECEPTOR, DRUGGABLE GENOME, TRANSCRIPTION FACTOR COMPLEX | antagonist | 135650003 | ||
| 5916 | RARG | NUCLEAR HORMONE RECEPTOR, DRUGGABLE GENOME, TRANSCRIPTION FACTOR COMPLEX | modulator | CHEMBL146506 | MOFAROTENE | |
| 5916 | RARG | NUCLEAR HORMONE RECEPTOR, DRUGGABLE GENOME, TRANSCRIPTION FACTOR COMPLEX | TAZAROTENE | TAZAROTENE | ||
| 5916 | RARG | NUCLEAR HORMONE RECEPTOR, DRUGGABLE GENOME, TRANSCRIPTION FACTOR COMPLEX | agonist | 135649930 | TAMIBAROTENE |
| Page: 1 2 3 4 5 6 |

Copyright 2023-Present -The University of Texas Health Science Center at Houston |