| GO ID | Tissue | Disease Stage | Description | Gene Ratio | Bg Ratio | pvalue | p.adjust | Count |
| GO:00305229 | Cervix | CC | intracellular receptor signaling pathway | 60/2311 | 265/18723 | 1.89e-06 | 5.97e-05 | 60 |
| GO:00605375 | Cervix | CC | muscle tissue development | 76/2311 | 403/18723 | 9.76e-05 | 1.27e-03 | 76 |
| GO:00147064 | Cervix | CC | striated muscle tissue development | 72/2311 | 384/18723 | 1.76e-04 | 2.07e-03 | 72 |
| GO:000206410 | Cervix | CC | epithelial cell development | 45/2311 | 220/18723 | 4.14e-04 | 4.21e-03 | 45 |
| GO:00426924 | Cervix | CC | muscle cell differentiation | 69/2311 | 384/18723 | 8.12e-04 | 7.09e-03 | 69 |
| GO:00519603 | Cervix | CC | regulation of nervous system development | 77/2311 | 443/18723 | 1.13e-03 | 9.30e-03 | 77 |
| GO:00487365 | Cervix | CC | appendage development | 35/2311 | 172/18723 | 1.88e-03 | 1.39e-02 | 35 |
| GO:00601735 | Cervix | CC | limb development | 35/2311 | 172/18723 | 1.88e-03 | 1.39e-02 | 35 |
| GO:00511464 | Cervix | CC | striated muscle cell differentiation | 50/2311 | 283/18723 | 5.53e-03 | 3.19e-02 | 50 |
| GO:00309003 | Cervix | CC | forebrain development | 64/2311 | 379/18723 | 5.53e-03 | 3.19e-02 | 64 |
| GO:0150063 | Cervix | CC | visual system development | 63/2311 | 375/18723 | 6.58e-03 | 3.65e-02 | 63 |
| GO:0001654 | Cervix | CC | eye development | 62/2311 | 371/18723 | 7.83e-03 | 4.13e-02 | 62 |
| GO:0048880 | Cervix | CC | sensory system development | 63/2311 | 381/18723 | 9.29e-03 | 4.66e-02 | 63 |
| GO:0061351 | Cervix | CC | neural precursor cell proliferation | 28/2311 | 145/18723 | 1.04e-02 | 4.97e-02 | 28 |
| GO:00605376 | Endometrium | AEH | muscle tissue development | 83/2100 | 403/18723 | 2.57e-08 | 1.50e-06 | 83 |
| GO:003052210 | Endometrium | AEH | intracellular receptor signaling pathway | 60/2100 | 265/18723 | 7.16e-08 | 3.77e-06 | 60 |
| GO:00147065 | Endometrium | AEH | striated muscle tissue development | 75/2100 | 384/18723 | 1.06e-06 | 3.62e-05 | 75 |
| GO:00016556 | Endometrium | AEH | urogenital system development | 67/2100 | 338/18723 | 2.30e-06 | 6.76e-05 | 67 |
| GO:00720015 | Endometrium | AEH | renal system development | 61/2100 | 302/18723 | 3.43e-06 | 9.24e-05 | 61 |
| GO:00018224 | Endometrium | AEH | kidney development | 57/2100 | 293/18723 | 2.25e-05 | 4.35e-04 | 57 |
| Hugo Symbol | Variant Class | Variant Classification | dbSNP RS | HGVSc | HGVSp | HGVSp Short | SWISSPROT | BIOTYPE | SIFT | PolyPhen | Tumor Sample Barcode | Tissue | Histology | Sex | Age | Stage | Therapy Types | Drugs | Outcome |
| RARB | SNV | Missense_Mutation | | c.184N>C | p.Glu62Gln | p.E62Q | P10826 | protein_coding | deleterious(0.05) | possibly_damaging(0.864) | TCGA-A2-A0SY-01 | Breast | breast invasive carcinoma | Female | <65 | III/IV | Hormone Therapy | arimidex | SD |
| RARB | SNV | Missense_Mutation | | c.205N>T | p.Pro69Ser | p.P69S | P10826 | protein_coding | deleterious(0.02) | possibly_damaging(0.839) | TCGA-AN-A041-01 | Breast | breast invasive carcinoma | Female | <65 | I/II | Unknown | Unknown | SD |
| RARB | SNV | Missense_Mutation | | c.505N>C | p.Glu169Gln | p.E169Q | P10826 | protein_coding | tolerated(0.06) | benign(0.213) | TCGA-AN-A049-01 | Breast | breast invasive carcinoma | Female | <65 | I/II | Unknown | Unknown | SD |
| RARB | SNV | Missense_Mutation | | c.434G>A | p.Gly145Glu | p.G145E | P10826 | protein_coding | deleterious(0) | possibly_damaging(0.903) | TCGA-B6-A0IN-01 | Breast | breast invasive carcinoma | Female | <65 | I/II | Unknown | Unknown | PD |
| RARB | SNV | Missense_Mutation | | c.206N>T | p.Pro69Leu | p.P69L | P10826 | protein_coding | deleterious(0.02) | possibly_damaging(0.887) | TCGA-C8-A132-01 | Breast | breast invasive carcinoma | Female | <65 | I/II | Unknown | Unknown | SD |
| RARB | SNV | Missense_Mutation | | c.860N>A | p.Arg287Gln | p.R287Q | P10826 | protein_coding | deleterious(0.02) | possibly_damaging(0.812) | TCGA-D8-A1JA-01 | Breast | breast invasive carcinoma | Female | <65 | III/IV | Chemotherapy | adriamycin | PD |
| RARB | SNV | Missense_Mutation | | c.1173N>C | p.Leu391Phe | p.L391F | P10826 | protein_coding | deleterious(0) | probably_damaging(0.989) | TCGA-C5-A1BK-01 | Cervix | cervical & endocervical cancer | Female | <65 | I/II | Unknown | Unknown | SD |
| RARB | SNV | Missense_Mutation | | c.440N>T | p.Ser147Phe | p.S147F | P10826 | protein_coding | deleterious(0) | probably_damaging(0.968) | TCGA-C5-A7CL-01 | Cervix | cervical & endocervical cancer | Female | <65 | III/IV | Chemotherapy | cisplatin | PD |
| RARB | SNV | Missense_Mutation | | c.1058N>C | p.Lys353Thr | p.K353T | P10826 | protein_coding | deleterious(0) | probably_damaging(0.995) | TCGA-FU-A3HZ-01 | Cervix | cervical & endocervical cancer | Female | <65 | I/II | Chemotherapy | cisplatin | CR |
| RARB | SNV | Missense_Mutation | | c.339G>C | p.Met113Ile | p.M113I | P10826 | protein_coding | deleterious(0) | possibly_damaging(0.794) | TCGA-Q1-A73O-01 | Cervix | cervical & endocervical cancer | Female | <65 | I/II | Chemotherapy | cisplatin | CR |
| Entrez ID | Symbol | Category | Interaction Types | Drug Claim Name | Drug Name | PMIDs |
| 5915 | RARB | NUCLEAR HORMONE RECEPTOR, DRUGGABLE GENOME | agonist | 53801005 | | |
| 5915 | RARB | NUCLEAR HORMONE RECEPTOR, DRUGGABLE GENOME | agonist | CHEMBL464 | ETRETINATE | |
| 5915 | RARB | NUCLEAR HORMONE RECEPTOR, DRUGGABLE GENOME | agonist | 135650917 | | |
| 5915 | RARB | NUCLEAR HORMONE RECEPTOR, DRUGGABLE GENOME | | PMID27336223-Compound-7 | | |
| 5915 | RARB | NUCLEAR HORMONE RECEPTOR, DRUGGABLE GENOME | agonist | 178102082 | ADAPALENE | |
| 5915 | RARB | NUCLEAR HORMONE RECEPTOR, DRUGGABLE GENOME | | Tamibarotene | TAMIBAROTENE | |
| 5915 | RARB | NUCLEAR HORMONE RECEPTOR, DRUGGABLE GENOME | | RETINOIC ACID | | 17001699 |
| 5915 | RARB | NUCLEAR HORMONE RECEPTOR, DRUGGABLE GENOME | agonist | CHEMBL1657 | TAZAROTENE | |
| 5915 | RARB | NUCLEAR HORMONE RECEPTOR, DRUGGABLE GENOME | | LGD-1550 | | |
| 5915 | RARB | NUCLEAR HORMONE RECEPTOR, DRUGGABLE GENOME | agonist | 178103534 | TAZAROTENE | |


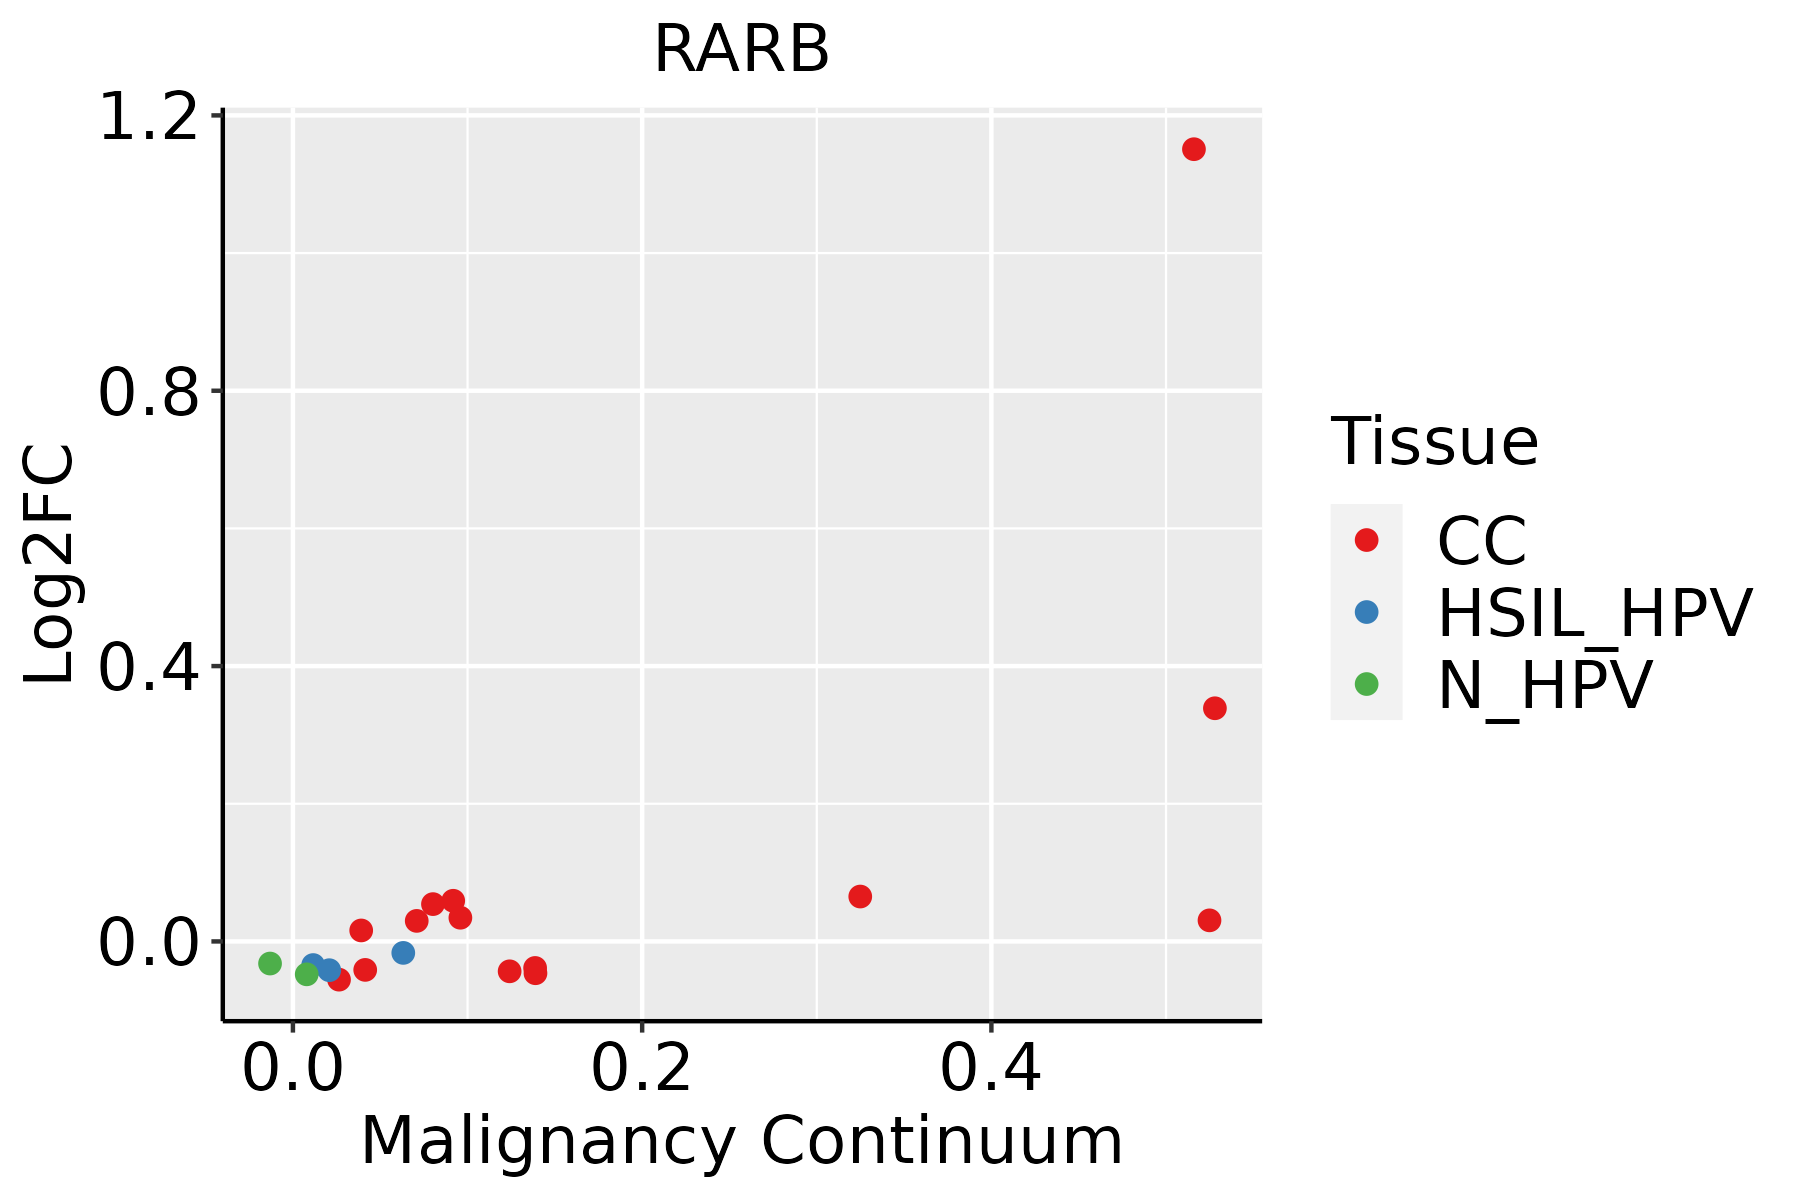
 Identification of the aberrant gene expression in precancerous and cancerous lesions by comparing the gene expression of stem-like cells in diseased tissues with normal stem cells
 Find out the enriched GO biological processes and KEGG pathways involved in transition from healthy to precancer to cancer


 Identification of potential cell-cell interactions between two cell types and their ligand-receptor pairs for different disease states
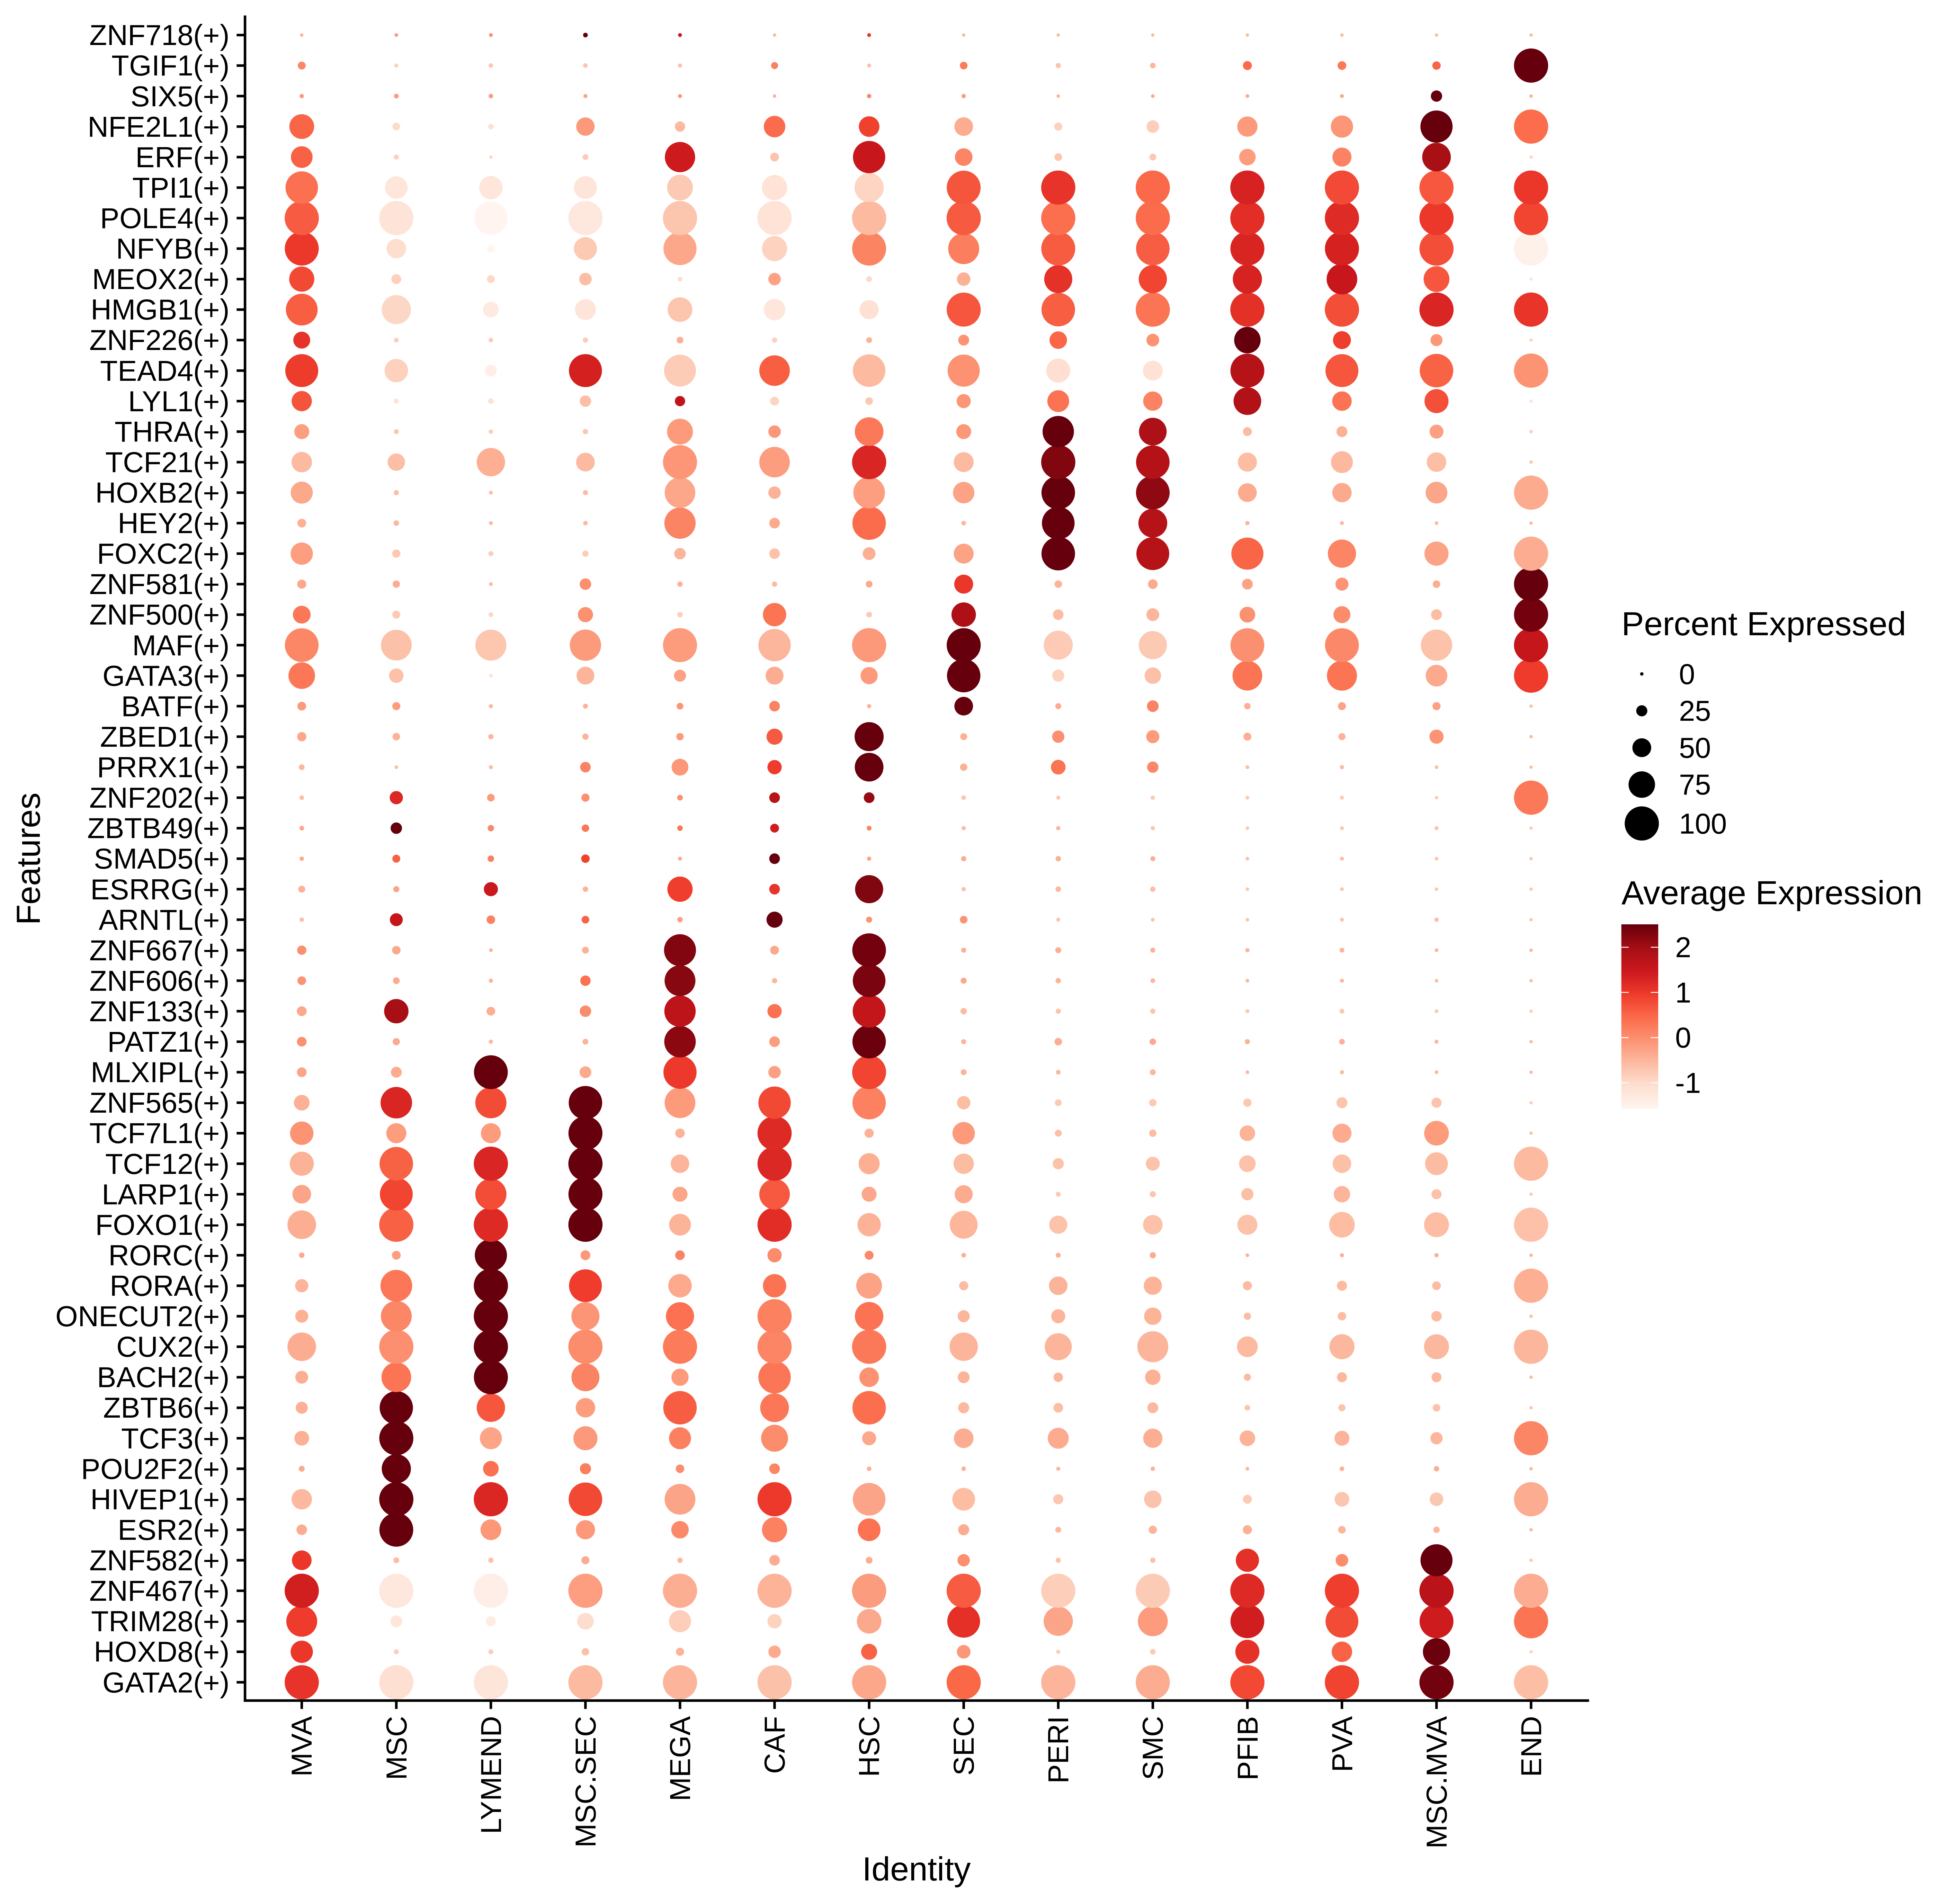
 Find out the significant the regulons (TFs) and the target genes of each regulon across cell types for different disease states
 Annotation of somatic variants for genes involved in malignant transformation
 Identification of chemicals and drugs interact with genes involved in malignant transfromation


