
|
|||||
|
 | |
| |
| |
| |
| |
| |
|
Gene: RARA |
Gene summary for RARA |
| Gene information | Species | Human | Gene symbol | RARA | Gene ID | 5914 |
| Gene name | retinoic acid receptor alpha | |
| Gene Alias | NR1B1 | |
| Cytomap | 17q21.2 | |
| Gene Type | protein-coding | GO ID | GO:0000003 | UniProtAcc | P10276 |
Top |
Malignant transformation analysis |
| Identification of the aberrant gene expression in precancerous and cancerous lesions by comparing the gene expression of stem-like cells in diseased tissues with normal stem cells |
| Entrez ID | Symbol | Replicates | Species | Organ | Tissue | Adj P-value | Log2FC | Malignancy |
| 5914 | RARA | LZE24T | Human | Esophagus | ESCC | 1.07e-20 | 4.51e-01 | 0.0596 |
| 5914 | RARA | P1T-E | Human | Esophagus | ESCC | 1.80e-03 | 2.23e-01 | 0.0875 |
| 5914 | RARA | P2T-E | Human | Esophagus | ESCC | 8.58e-25 | 2.62e-01 | 0.1177 |
| 5914 | RARA | P4T-E | Human | Esophagus | ESCC | 3.47e-18 | 2.50e-01 | 0.1323 |
| 5914 | RARA | P5T-E | Human | Esophagus | ESCC | 5.50e-19 | 7.09e-02 | 0.1327 |
| 5914 | RARA | P8T-E | Human | Esophagus | ESCC | 4.80e-26 | 2.86e-01 | 0.0889 |
| 5914 | RARA | P9T-E | Human | Esophagus | ESCC | 2.32e-06 | 9.70e-02 | 0.1131 |
| 5914 | RARA | P10T-E | Human | Esophagus | ESCC | 1.44e-22 | 3.13e-01 | 0.116 |
| 5914 | RARA | P11T-E | Human | Esophagus | ESCC | 5.83e-13 | 5.24e-01 | 0.1426 |
| 5914 | RARA | P12T-E | Human | Esophagus | ESCC | 7.79e-20 | 3.95e-01 | 0.1122 |
| 5914 | RARA | P15T-E | Human | Esophagus | ESCC | 6.57e-21 | 5.15e-01 | 0.1149 |
| 5914 | RARA | P16T-E | Human | Esophagus | ESCC | 2.43e-18 | 2.43e-01 | 0.1153 |
| 5914 | RARA | P17T-E | Human | Esophagus | ESCC | 2.91e-04 | 2.42e-01 | 0.1278 |
| 5914 | RARA | P19T-E | Human | Esophagus | ESCC | 8.01e-10 | 5.00e-01 | 0.1662 |
| 5914 | RARA | P20T-E | Human | Esophagus | ESCC | 1.34e-04 | 1.66e-01 | 0.1124 |
| 5914 | RARA | P21T-E | Human | Esophagus | ESCC | 5.42e-18 | 3.80e-01 | 0.1617 |
| 5914 | RARA | P22T-E | Human | Esophagus | ESCC | 3.10e-14 | 1.38e-01 | 0.1236 |
| 5914 | RARA | P23T-E | Human | Esophagus | ESCC | 2.04e-09 | 2.45e-01 | 0.108 |
| 5914 | RARA | P24T-E | Human | Esophagus | ESCC | 3.20e-10 | 1.70e-01 | 0.1287 |
| 5914 | RARA | P26T-E | Human | Esophagus | ESCC | 6.94e-26 | 3.22e-01 | 0.1276 |
| Page: 1 2 3 4 |
| Tissue | Expression Dynamics | Abbreviation |
| Esophagus | 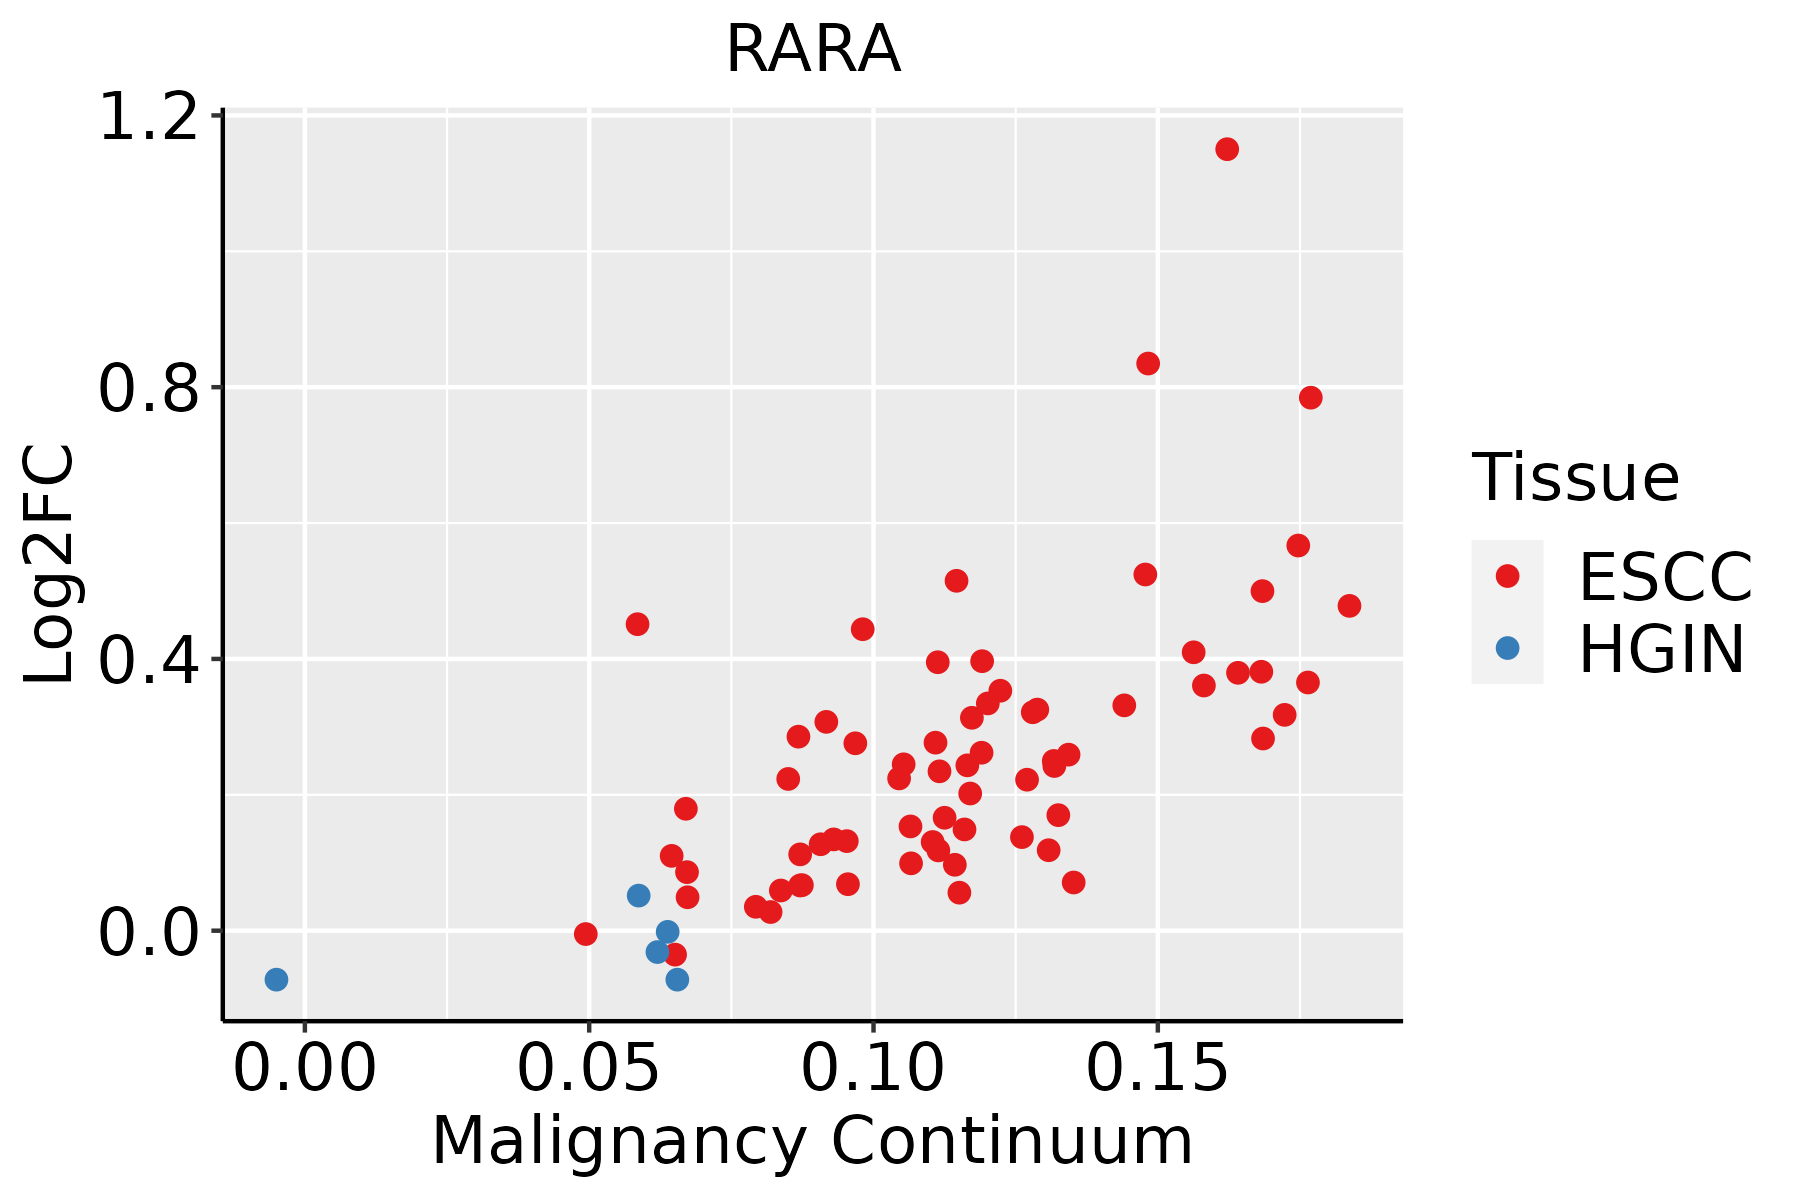 | ESCC: Esophageal squamous cell carcinoma |
| HGIN: High-grade intraepithelial neoplasias | ||
| LGIN: Low-grade intraepithelial neoplasias | ||
| Liver | 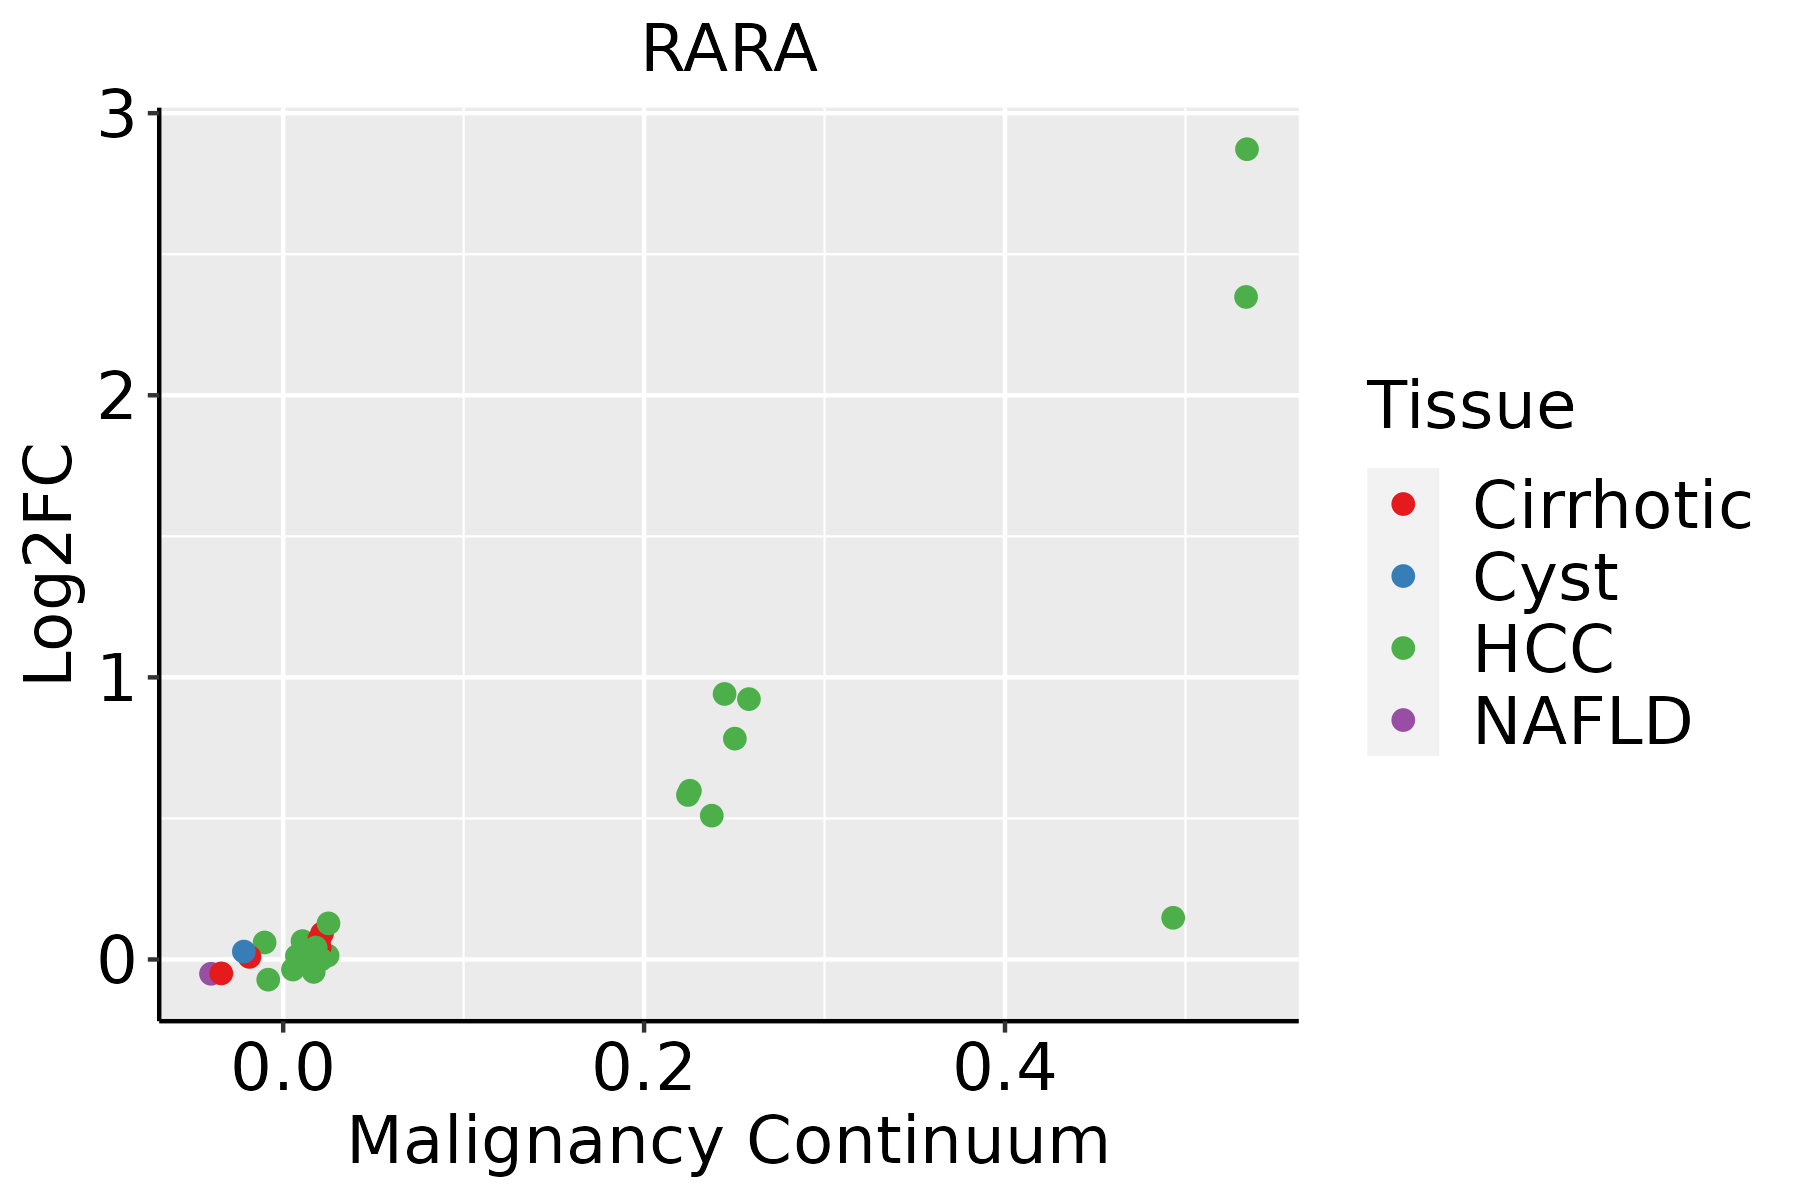 | HCC: Hepatocellular carcinoma |
| NAFLD: Non-alcoholic fatty liver disease |
| ∗log2FC in expression of this searched gene in stem-like cells from each diseased tissue sample relative to stem-like cells in normal samples in each tissue plotted against the malignancy continuum. Samples are colored based on if they are from different disease stage. |
Top |
Malignant transformation related pathway analysis |
| Find out the enriched GO biological processes and KEGG pathways involved in transition from healthy to precancer to cancer |
| Tissue | Disease Stage | Enriched GO biological Processes |
| Colorectum | AD |  |
| Colorectum | SER |  |
| Colorectum | MSS |  |
| Colorectum | MSI-H |  |
| Colorectum | FAP |  |
| ∗Top 15 enriched GO BP terms are showed in the bar plot of each disease state in each tissue. Each row represents a significant GO biological process which is colored according to the -log10(p.adjust). |
| Page: 1 2 3 4 5 6 7 8 9 |
| GO ID | Tissue | Disease Stage | Description | Gene Ratio | Bg Ratio | pvalue | p.adjust | Count |
| GO:0051098111 | Esophagus | ESCC | regulation of binding | 251/8552 | 363/18723 | 6.73e-20 | 8.46e-18 | 251 |
| GO:0006417111 | Esophagus | ESCC | regulation of translation | 304/8552 | 468/18723 | 1.53e-17 | 1.33e-15 | 304 |
| GO:0048732111 | Esophagus | ESCC | gland development | 269/8552 | 436/18723 | 7.81e-12 | 2.95e-10 | 269 |
| GO:0031667111 | Esophagus | ESCC | response to nutrient levels | 289/8552 | 474/18723 | 9.25e-12 | 3.47e-10 | 289 |
| GO:0051099111 | Esophagus | ESCC | positive regulation of binding | 122/8552 | 173/18723 | 2.79e-11 | 9.45e-10 | 122 |
| GO:0030522110 | Esophagus | ESCC | intracellular receptor signaling pathway | 170/8552 | 265/18723 | 8.58e-10 | 2.09e-08 | 170 |
| GO:004578710 | Esophagus | ESCC | positive regulation of cell cycle | 196/8552 | 313/18723 | 9.27e-10 | 2.24e-08 | 196 |
| GO:0030099111 | Esophagus | ESCC | myeloid cell differentiation | 232/8552 | 381/18723 | 1.22e-09 | 2.90e-08 | 232 |
| GO:000184115 | Esophagus | ESCC | neural tube formation | 75/8552 | 102/18723 | 9.68e-09 | 1.95e-07 | 75 |
| GO:000184314 | Esophagus | ESCC | neural tube closure | 66/8552 | 88/18723 | 1.98e-08 | 3.82e-07 | 66 |
| GO:001402014 | Esophagus | ESCC | primary neural tube formation | 69/8552 | 94/18723 | 4.22e-08 | 7.76e-07 | 69 |
| GO:006060614 | Esophagus | ESCC | tube closure | 66/8552 | 89/18723 | 4.24e-08 | 7.76e-07 | 66 |
| GO:004578527 | Esophagus | ESCC | positive regulation of cell adhesion | 255/8552 | 437/18723 | 5.07e-08 | 9.11e-07 | 255 |
| GO:000758410 | Esophagus | ESCC | response to nutrient | 114/8552 | 174/18723 | 9.43e-08 | 1.56e-06 | 114 |
| GO:00219159 | Esophagus | ESCC | neural tube development | 101/8552 | 152/18723 | 1.78e-07 | 2.79e-06 | 101 |
| GO:00163316 | Esophagus | ESCC | morphogenesis of embryonic epithelium | 98/8552 | 147/18723 | 2.12e-07 | 3.27e-06 | 98 |
| GO:0061458110 | Esophagus | ESCC | reproductive system development | 247/8552 | 427/18723 | 2.24e-07 | 3.42e-06 | 247 |
| GO:000183814 | Esophagus | ESCC | embryonic epithelial tube formation | 83/8552 | 121/18723 | 2.78e-07 | 4.08e-06 | 83 |
| GO:004860818 | Esophagus | ESCC | reproductive structure development | 245/8552 | 424/18723 | 2.82e-07 | 4.14e-06 | 245 |
| GO:0061008110 | Esophagus | ESCC | hepaticobiliary system development | 98/8552 | 150/18723 | 8.91e-07 | 1.15e-05 | 98 |
| Page: 1 2 3 4 5 6 7 |
| Pathway ID | Tissue | Disease Stage | Description | Gene Ratio | Bg Ratio | pvalue | p.adjust | qvalue | Count |
| hsa052215 | Esophagus | ESCC | Acute myeloid leukemia | 49/4205 | 67/8465 | 7.43e-05 | 3.07e-04 | 1.57e-04 | 49 |
| hsa052028 | Esophagus | ESCC | Transcriptional misregulation in cancer | 116/4205 | 193/8465 | 2.08e-03 | 5.95e-03 | 3.05e-03 | 116 |
| hsa046599 | Esophagus | ESCC | Th17 cell differentiation | 68/4205 | 108/8465 | 3.53e-03 | 9.30e-03 | 4.76e-03 | 68 |
| hsa0522113 | Esophagus | ESCC | Acute myeloid leukemia | 49/4205 | 67/8465 | 7.43e-05 | 3.07e-04 | 1.57e-04 | 49 |
| hsa0520213 | Esophagus | ESCC | Transcriptional misregulation in cancer | 116/4205 | 193/8465 | 2.08e-03 | 5.95e-03 | 3.05e-03 | 116 |
| hsa0465914 | Esophagus | ESCC | Th17 cell differentiation | 68/4205 | 108/8465 | 3.53e-03 | 9.30e-03 | 4.76e-03 | 68 |
| hsa05221 | Liver | HCC | Acute myeloid leukemia | 41/4020 | 67/8465 | 1.64e-02 | 3.90e-02 | 2.17e-02 | 41 |
| hsa052211 | Liver | HCC | Acute myeloid leukemia | 41/4020 | 67/8465 | 1.64e-02 | 3.90e-02 | 2.17e-02 | 41 |
| Page: 1 |
Top |
Cell-cell communication analysis |
| Identification of potential cell-cell interactions between two cell types and their ligand-receptor pairs for different disease states |
| Ligand | Receptor | LRpair | Pathway | Tissue | Disease Stage |
| Page: 1 |
Top |
Single-cell gene regulatory network inference analysis |
| Find out the significant the regulons (TFs) and the target genes of each regulon across cell types for different disease states |
| TF | Cell Type | Tissue | Disease Stage | Target Gene | RSS | Regulon Activity |
| RARA | MON | Breast | Healthy | FCGR1B,ALDH3B1,PID1, etc. | 9.62e-02 |  |
| RARA | DC | Colorectum | AD | PFKFB3,SLC2A3,FLNA, etc. | 9.20e-02 |  |
| RARA | DC | Colorectum | CRC | PFKFB3,SLC2A3,FLNA, etc. | 6.10e-02 |  |
| RARA | MAST | Colorectum | CRC | PFKFB3,SLC2A3,FLNA, etc. | 2.70e-02 | |
| RARA | DC | Colorectum | FAP | PFKFB3,SLC2A3,FLNA, etc. | 8.58e-02 |  |
| RARA | DC | Colorectum | SER | PFKFB3,SLC2A3,FLNA, etc. | 5.28e-02 |  |
| RARA | MAST | Endometrium | ADJ | RAP1GAP2,AC005920.2,S100A9, etc. | 2.21e-01 |  |
| RARA | MAST | Endometrium | AEH | RAP1GAP2,AC005920.2,S100A9, etc. | 7.07e-02 |  |
| RARA | MAST | Endometrium | EEC | RAP1GAP2,AC005920.2,S100A9, etc. | 1.41e-01 |  |
| RARA | KER | Esophagus | HGIN | HOXC13,ARHGAP29,NR1D1, etc. | 2.75e-01 |  |
| ∗The dot plots of a searched regulon are shown for all cell subpopulations in each disease state of each tissue based on the regulon specific score inferred using pySCENIC and by calculating the average expression. |
| Page: 1 2 3 4 |
Top |
Somatic mutation of malignant transformation related genes |
| Annotation of somatic variants for genes involved in malignant transformation |
| Hugo Symbol | Variant Class | Variant Classification | dbSNP RS | HGVSc | HGVSp | HGVSp Short | SWISSPROT | BIOTYPE | SIFT | PolyPhen | Tumor Sample Barcode | Tissue | Histology | Sex | Age | Stage | Therapy Types | Drugs | Outcome |
| RARA | SNV | Missense_Mutation | novel | c.1190N>T | p.Thr397Met | p.T397M | P10276 | protein_coding | deleterious(0.02) | probably_damaging(0.993) | TCGA-A2-A0CP-01 | Breast | breast invasive carcinoma | Female | <65 | I/II | Chemotherapy | cytoxan | SD |
| RARA | SNV | Missense_Mutation | c.857N>C | p.Phe286Ser | p.F286S | P10276 | protein_coding | deleterious(0) | probably_damaging(0.998) | TCGA-D8-A1Y2-01 | Breast | breast invasive carcinoma | Female | >=65 | I/II | Hormone Therapy | tamoxiphen | SD | |
| RARA | insertion | Frame_Shift_Ins | novel | c.584_585insC | p.Gln196ProfsTer28 | p.Q196Pfs*28 | P10276 | protein_coding | TCGA-B6-A1KN-01 | Breast | breast invasive carcinoma | Female | <65 | III/IV | Unknown | Unknown | SD | ||
| RARA | SNV | Missense_Mutation | c.650N>A | p.Arg217His | p.R217H | P10276 | protein_coding | deleterious(0.04) | probably_damaging(0.999) | TCGA-DG-A2KJ-01 | Cervix | cervical & endocervical cancer | Female | <65 | III/IV | Chemotherapy | cisplatin | SD | |
| RARA | SNV | Missense_Mutation | novel | c.272G>A | p.Cys91Tyr | p.C91Y | P10276 | protein_coding | deleterious(0) | possibly_damaging(0.806) | TCGA-5M-AAT6-01 | Colorectum | colon adenocarcinoma | Female | <65 | III/IV | Unknown | Unknown | PD |
| RARA | SNV | Missense_Mutation | c.656N>A | p.Ser219Tyr | p.S219Y | P10276 | protein_coding | deleterious(0.01) | probably_damaging(0.935) | TCGA-AA-A02R-01 | Colorectum | colon adenocarcinoma | Female | >=65 | I/II | Unknown | Unknown | PD | |
| RARA | SNV | Missense_Mutation | c.838G>A | p.Glu280Lys | p.E280K | P10276 | protein_coding | deleterious(0.03) | possibly_damaging(0.647) | TCGA-AD-A5EJ-01 | Colorectum | colon adenocarcinoma | Female | >=65 | I/II | Unknown | Unknown | SD | |
| RARA | SNV | Missense_Mutation | c.814N>T | p.Arg272Trp | p.R272W | P10276 | protein_coding | deleterious(0) | probably_damaging(1) | TCGA-AZ-6601-01 | Colorectum | colon adenocarcinoma | Male | >=65 | I/II | Unknown | Unknown | PD | |
| RARA | SNV | Missense_Mutation | c.952C>T | p.Pro318Ser | p.P318S | P10276 | protein_coding | tolerated(0.19) | probably_damaging(0.999) | TCGA-CK-5913-01 | Colorectum | colon adenocarcinoma | Female | <65 | I/II | Unknown | Unknown | SD | |
| RARA | SNV | Missense_Mutation | rs754292583 | c.575N>A | p.Arg192His | p.R192H | P10276 | protein_coding | tolerated(0.38) | possibly_damaging(0.527) | TCGA-EI-6507-01 | Colorectum | rectum adenocarcinoma | Male | <65 | I/II | Unknown | Unknown | SD |
| Page: 1 2 3 4 5 6 |
Top |
Related drugs of malignant transformation related genes |
| Identification of chemicals and drugs interact with genes involved in malignant transfromation |
| (DGIdb 4.0) |
| Entrez ID | Symbol | Category | Interaction Types | Drug Claim Name | Drug Name | PMIDs |
| 5914 | RARA | TRANSCRIPTION FACTOR COMPLEX, NUCLEAR HORMONE RECEPTOR, CELL SURFACE, CLINICALLY ACTIONABLE, DRUGGABLE GENOME | agonist | 135650006 | ||
| 5914 | RARA | TRANSCRIPTION FACTOR COMPLEX, NUCLEAR HORMONE RECEPTOR, CELL SURFACE, CLINICALLY ACTIONABLE, DRUGGABLE GENOME | SOY PROTEIN ISOLATE | 17182792 | ||
| 5914 | RARA | TRANSCRIPTION FACTOR COMPLEX, NUCLEAR HORMONE RECEPTOR, CELL SURFACE, CLINICALLY ACTIONABLE, DRUGGABLE GENOME | PMID27336223-Compound-4 | |||
| 5914 | RARA | TRANSCRIPTION FACTOR COMPLEX, NUCLEAR HORMONE RECEPTOR, CELL SURFACE, CLINICALLY ACTIONABLE, DRUGGABLE GENOME | SY-1425 | |||
| 5914 | RARA | TRANSCRIPTION FACTOR COMPLEX, NUCLEAR HORMONE RECEPTOR, CELL SURFACE, CLINICALLY ACTIONABLE, DRUGGABLE GENOME | ALITRETINOIN | ALITRETINOIN | 7807131 | |
| 5914 | RARA | TRANSCRIPTION FACTOR COMPLEX, NUCLEAR HORMONE RECEPTOR, CELL SURFACE, CLINICALLY ACTIONABLE, DRUGGABLE GENOME | GERONTOXANTHONE A | GERONTOXANTHONE A | 25838141 | |
| 5914 | RARA | TRANSCRIPTION FACTOR COMPLEX, NUCLEAR HORMONE RECEPTOR, CELL SURFACE, CLINICALLY ACTIONABLE, DRUGGABLE GENOME | CAROTENOIDS | 11237167 | ||
| 5914 | RARA | TRANSCRIPTION FACTOR COMPLEX, NUCLEAR HORMONE RECEPTOR, CELL SURFACE, CLINICALLY ACTIONABLE, DRUGGABLE GENOME | DMSO | DIMETHYL SULFOXIDE | 9067579 | |
| 5914 | RARA | TRANSCRIPTION FACTOR COMPLEX, NUCLEAR HORMONE RECEPTOR, CELL SURFACE, CLINICALLY ACTIONABLE, DRUGGABLE GENOME | FENRETINIDE | FENRETINIDE | ||
| 5914 | RARA | TRANSCRIPTION FACTOR COMPLEX, NUCLEAR HORMONE RECEPTOR, CELL SURFACE, CLINICALLY ACTIONABLE, DRUGGABLE GENOME | TAMIBAROTENE | TAMIBAROTENE |
| Page: 1 2 3 4 5 6 7 8 9 |

Copyright 2023-Present -The University of Texas Health Science Center at Houston |