
|
|||||
|
 | |
| |
| |
| |
| |
| |
|
Gene: RAPSN |
Gene summary for RAPSN |
| Gene information | Species | Human | Gene symbol | RAPSN | Gene ID | 5913 |
| Gene name | receptor associated protein of the synapse | |
| Gene Alias | CMS11 | |
| Cytomap | 11p11.2 | |
| Gene Type | protein-coding | GO ID | GO:0001941 | UniProtAcc | A0A0S2Z4F8 |
Top |
Malignant transformation analysis |
| Identification of the aberrant gene expression in precancerous and cancerous lesions by comparing the gene expression of stem-like cells in diseased tissues with normal stem cells |
| Entrez ID | Symbol | Replicates | Species | Organ | Tissue | Adj P-value | Log2FC | Malignancy |
| 5913 | RAPSN | C06 | Human | Oral cavity | OSCC | 2.11e-03 | 3.32e-01 | 0.2699 |
| 5913 | RAPSN | C07 | Human | Oral cavity | OSCC | 4.20e-02 | 4.50e-01 | 0.2491 |
| 5913 | RAPSN | SYSMH5 | Human | Oral cavity | OSCC | 8.75e-05 | 1.82e-01 | 0.0647 |
| Page: 1 |
| Tissue | Expression Dynamics | Abbreviation |
| Oral Cavity | 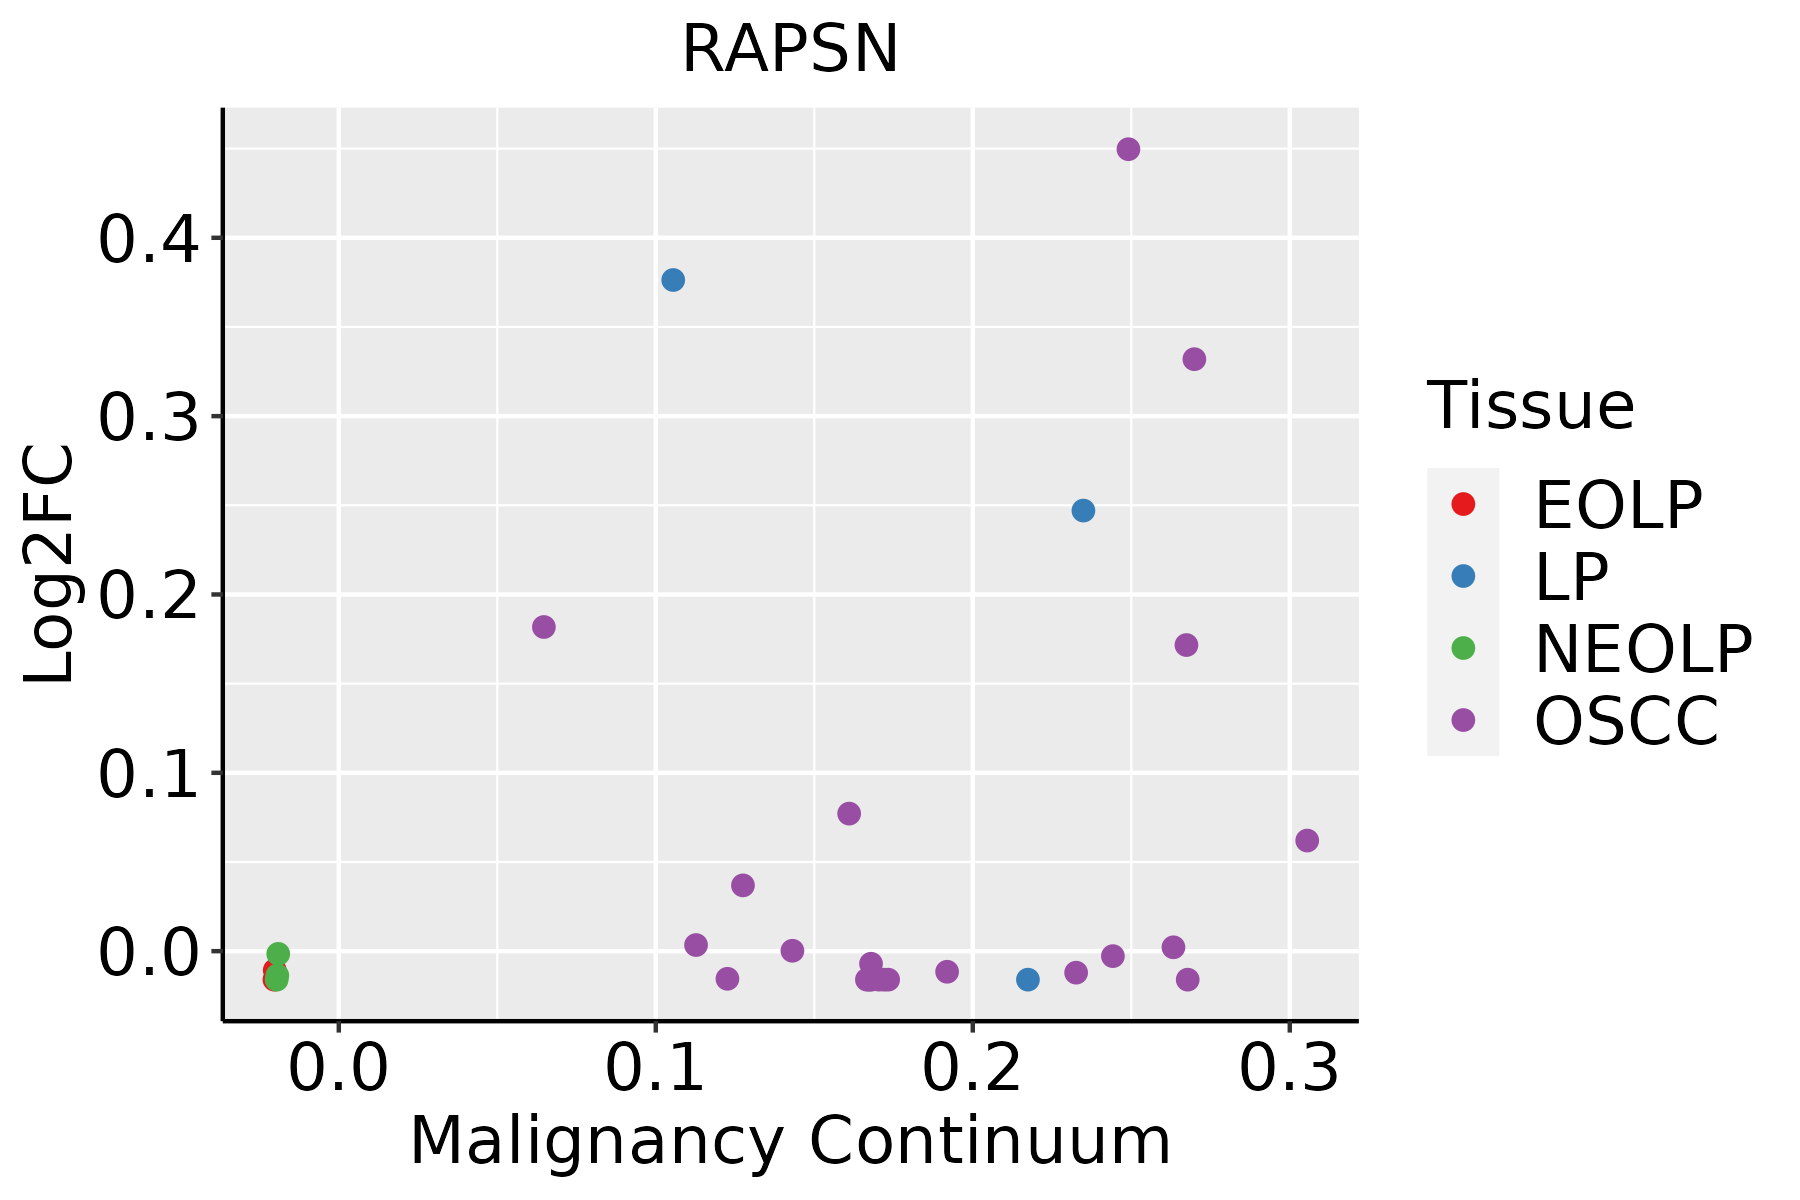 | EOLP: Erosive Oral lichen planus |
| LP: leukoplakia | ||
| NEOLP: Non-erosive oral lichen planus | ||
| OSCC: Oral squamous cell carcinoma |
| ∗log2FC in expression of this searched gene in stem-like cells from each diseased tissue sample relative to stem-like cells in normal samples in each tissue plotted against the malignancy continuum. Samples are colored based on if they are from different disease stage. |
Top |
Malignant transformation related pathway analysis |
| Find out the enriched GO biological processes and KEGG pathways involved in transition from healthy to precancer to cancer |
| Tissue | Disease Stage | Enriched GO biological Processes |
| Colorectum | AD |  |
| Colorectum | SER |  |
| Colorectum | MSS |  |
| Colorectum | MSI-H |  |
| Colorectum | FAP |  |
| ∗Top 15 enriched GO BP terms are showed in the bar plot of each disease state in each tissue. Each row represents a significant GO biological process which is colored according to the -log10(p.adjust). |
| Page: 1 2 3 4 5 6 7 8 9 |
| GO ID | Tissue | Disease Stage | Description | Gene Ratio | Bg Ratio | pvalue | p.adjust | Count |
| GO:009015018 | Oral cavity | OSCC | establishment of protein localization to membrane | 163/7305 | 260/18723 | 7.13e-15 | 4.47e-13 | 163 |
| GO:199077816 | Oral cavity | OSCC | protein localization to cell periphery | 190/7305 | 333/18723 | 1.46e-11 | 5.13e-10 | 190 |
| GO:007099720 | Oral cavity | OSCC | neuron death | 202/7305 | 361/18723 | 3.75e-11 | 1.23e-09 | 202 |
| GO:190121420 | Oral cavity | OSCC | regulation of neuron death | 174/7305 | 319/18723 | 1.09e-08 | 2.23e-07 | 174 |
| GO:190121620 | Oral cavity | OSCC | positive regulation of neuron death | 63/7305 | 97/18723 | 2.02e-07 | 3.25e-06 | 63 |
| GO:005140217 | Oral cavity | OSCC | neuron apoptotic process | 134/7305 | 246/18723 | 5.65e-07 | 8.19e-06 | 134 |
| GO:004352310 | Oral cavity | OSCC | regulation of neuron apoptotic process | 111/7305 | 212/18723 | 5.12e-05 | 4.27e-04 | 111 |
| GO:004352518 | Oral cavity | OSCC | positive regulation of neuron apoptotic process | 37/7305 | 58/18723 | 1.15e-04 | 8.35e-04 | 37 |
| Page: 1 |
| Pathway ID | Tissue | Disease Stage | Description | Gene Ratio | Bg Ratio | pvalue | p.adjust | qvalue | Count |
| Page: 1 |
Top |
Cell-cell communication analysis |
| Identification of potential cell-cell interactions between two cell types and their ligand-receptor pairs for different disease states |
| Ligand | Receptor | LRpair | Pathway | Tissue | Disease Stage |
| Page: 1 |
Top |
Single-cell gene regulatory network inference analysis |
| Find out the significant the regulons (TFs) and the target genes of each regulon across cell types for different disease states |
| TF | Cell Type | Tissue | Disease Stage | Target Gene | RSS | Regulon Activity |
| ∗The dot plots of a searched regulon are shown for all cell subpopulations in each disease state of each tissue based on the regulon specific score inferred using pySCENIC and by calculating the average expression. |
| Page: 1 |
Top |
Somatic mutation of malignant transformation related genes |
| Annotation of somatic variants for genes involved in malignant transformation |
| Hugo Symbol | Variant Class | Variant Classification | dbSNP RS | HGVSc | HGVSp | HGVSp Short | SWISSPROT | BIOTYPE | SIFT | PolyPhen | Tumor Sample Barcode | Tissue | Histology | Sex | Age | Stage | Therapy Types | Drugs | Outcome |
| RAPSN | SNV | Missense_Mutation | rs200695559 | c.793N>A | p.Ala265Thr | p.A265T | Q13702 | protein_coding | deleterious(0.01) | probably_damaging(0.965) | TCGA-A7-A6VX-01 | Breast | breast invasive carcinoma | Female | >=65 | I/II | Chemotherapy | docetaxel | CR |
| RAPSN | SNV | Missense_Mutation | novel | c.972N>G | p.Ser324Arg | p.S324R | Q13702 | protein_coding | tolerated(0.59) | benign(0.001) | TCGA-AN-A04A-01 | Breast | breast invasive carcinoma | Female | <65 | III/IV | Unknown | Unknown | SD |
| RAPSN | SNV | Missense_Mutation | c.202N>C | p.Val68Leu | p.V68L | Q13702 | protein_coding | tolerated(0.3) | benign(0.049) | TCGA-D8-A13Y-01 | Breast | breast invasive carcinoma | Female | <65 | I/II | Chemotherapy | doxorubicin | SD | |
| RAPSN | insertion | Frame_Shift_Ins | novel | c.1169_1170insTCACAGTTCTGGAGGCTGGGAAGTCCAAGATCAAGGCA | p.Leu391HisfsTer30 | p.L391Hfs*30 | Q13702 | protein_coding | TCGA-A8-A07R-01 | Breast | breast invasive carcinoma | Female | >=65 | III/IV | Ancillary | zoledronic | SD | ||
| RAPSN | insertion | Nonsense_Mutation | novel | c.972_973insTAGATTAAGGA | p.Gln325Ter | p.Q325* | Q13702 | protein_coding | TCGA-AN-A04A-01 | Breast | breast invasive carcinoma | Female | <65 | III/IV | Unknown | Unknown | SD | ||
| RAPSN | SNV | Missense_Mutation | novel | c.902C>A | p.Ala301Glu | p.A301E | Q13702 | protein_coding | tolerated(1) | benign(0) | TCGA-VS-A94Z-01 | Cervix | cervical & endocervical cancer | Female | <65 | I/II | Chemotherapy | cisplatin | CR |
| RAPSN | insertion | Frame_Shift_Ins | novel | c.511_512insTAGAA | p.Ser171IlefsTer34 | p.S171Ifs*34 | Q13702 | protein_coding | TCGA-C5-A1MF-01 | Cervix | cervical & endocervical cancer | Female | <65 | I/II | Unknown | Unknown | SD | ||
| RAPSN | SNV | Missense_Mutation | rs201197735 | c.124N>T | p.Arg42Cys | p.R42C | Q13702 | protein_coding | deleterious(0) | probably_damaging(0.97) | TCGA-AA-3950-01 | Colorectum | colon adenocarcinoma | Female | >=65 | I/II | Unknown | Unknown | SD |
| RAPSN | SNV | Missense_Mutation | c.350N>T | p.Ala117Val | p.A117V | Q13702 | protein_coding | tolerated(0.42) | benign(0) | TCGA-AA-A010-01 | Colorectum | colon adenocarcinoma | Female | <65 | I/II | Chemotherapy | folinic | CR | |
| RAPSN | SNV | Missense_Mutation | novel | c.448N>A | p.Leu150Met | p.L150M | Q13702 | protein_coding | tolerated(0.14) | possibly_damaging(0.832) | TCGA-AD-5900-01 | Colorectum | colon adenocarcinoma | Male | >=65 | I/II | Unknown | Unknown | SD |
| Page: 1 2 3 4 |
Top |
Related drugs of malignant transformation related genes |
| Identification of chemicals and drugs interact with genes involved in malignant transfromation |
| (DGIdb 4.0) |
| Entrez ID | Symbol | Category | Interaction Types | Drug Claim Name | Drug Name | PMIDs |
| Page: 1 |

Copyright 2023-Present -The University of Texas Health Science Center at Houston |