
|
|||||
|
 | |
| |
| |
| |
| |
| |
|
Gene: RAPH1 |
Gene summary for RAPH1 |
| Gene information | Species | Human | Gene symbol | RAPH1 | Gene ID | 65059 |
| Gene name | Ras association (RalGDS/AF-6) and pleckstrin homology domains 1 | |
| Gene Alias | ALS2CR18 | |
| Cytomap | 2q33.2 | |
| Gene Type | protein-coding | GO ID | GO:0000902 | UniProtAcc | Q70E73 |
Top |
Malignant transformation analysis |
| Identification of the aberrant gene expression in precancerous and cancerous lesions by comparing the gene expression of stem-like cells in diseased tissues with normal stem cells |
| Entrez ID | Symbol | Replicates | Species | Organ | Tissue | Adj P-value | Log2FC | Malignancy |
| 65059 | RAPH1 | CCI_2 | Human | Cervix | CC | 3.05e-15 | 1.24e+00 | 0.5249 |
| 65059 | RAPH1 | CCI_3 | Human | Cervix | CC | 9.26e-07 | 4.71e-01 | 0.516 |
| 65059 | RAPH1 | T3 | Human | Cervix | CC | 4.21e-03 | 2.21e-01 | 0.1389 |
| 65059 | RAPH1 | AEH-subject1 | Human | Endometrium | AEH | 5.73e-08 | 3.21e-01 | -0.3059 |
| 65059 | RAPH1 | AEH-subject4 | Human | Endometrium | AEH | 4.07e-02 | 3.12e-01 | -0.2657 |
| 65059 | RAPH1 | AEH-subject5 | Human | Endometrium | AEH | 7.51e-18 | 5.63e-01 | -0.2953 |
| 65059 | RAPH1 | EEC-subject1 | Human | Endometrium | EEC | 4.49e-08 | 3.79e-01 | -0.2682 |
| 65059 | RAPH1 | EEC-subject3 | Human | Endometrium | EEC | 8.16e-05 | 3.54e-01 | -0.2525 |
| 65059 | RAPH1 | EEC-subject4 | Human | Endometrium | EEC | 1.76e-02 | 2.20e-01 | -0.2571 |
| 65059 | RAPH1 | EEC-subject5 | Human | Endometrium | EEC | 1.01e-02 | 2.09e-01 | -0.249 |
| 65059 | RAPH1 | LZE4T | Human | Esophagus | ESCC | 2.04e-08 | 1.19e-01 | 0.0811 |
| 65059 | RAPH1 | LZE5T | Human | Esophagus | ESCC | 1.71e-02 | 8.06e-02 | 0.0514 |
| 65059 | RAPH1 | LZE20T | Human | Esophagus | ESCC | 2.69e-03 | 3.37e-02 | 0.0662 |
| 65059 | RAPH1 | LZE24T | Human | Esophagus | ESCC | 9.56e-08 | 2.01e-01 | 0.0596 |
| 65059 | RAPH1 | P2T-E | Human | Esophagus | ESCC | 1.78e-11 | 1.06e-01 | 0.1177 |
| 65059 | RAPH1 | P4T-E | Human | Esophagus | ESCC | 5.46e-14 | 2.56e-01 | 0.1323 |
| 65059 | RAPH1 | P5T-E | Human | Esophagus | ESCC | 3.83e-07 | 1.10e-01 | 0.1327 |
| 65059 | RAPH1 | P8T-E | Human | Esophagus | ESCC | 5.32e-11 | 1.87e-01 | 0.0889 |
| 65059 | RAPH1 | P9T-E | Human | Esophagus | ESCC | 1.19e-12 | 2.02e-01 | 0.1131 |
| 65059 | RAPH1 | P10T-E | Human | Esophagus | ESCC | 9.06e-04 | -9.60e-03 | 0.116 |
| Page: 1 2 3 4 5 6 |
| Tissue | Expression Dynamics | Abbreviation |
| Cervix | 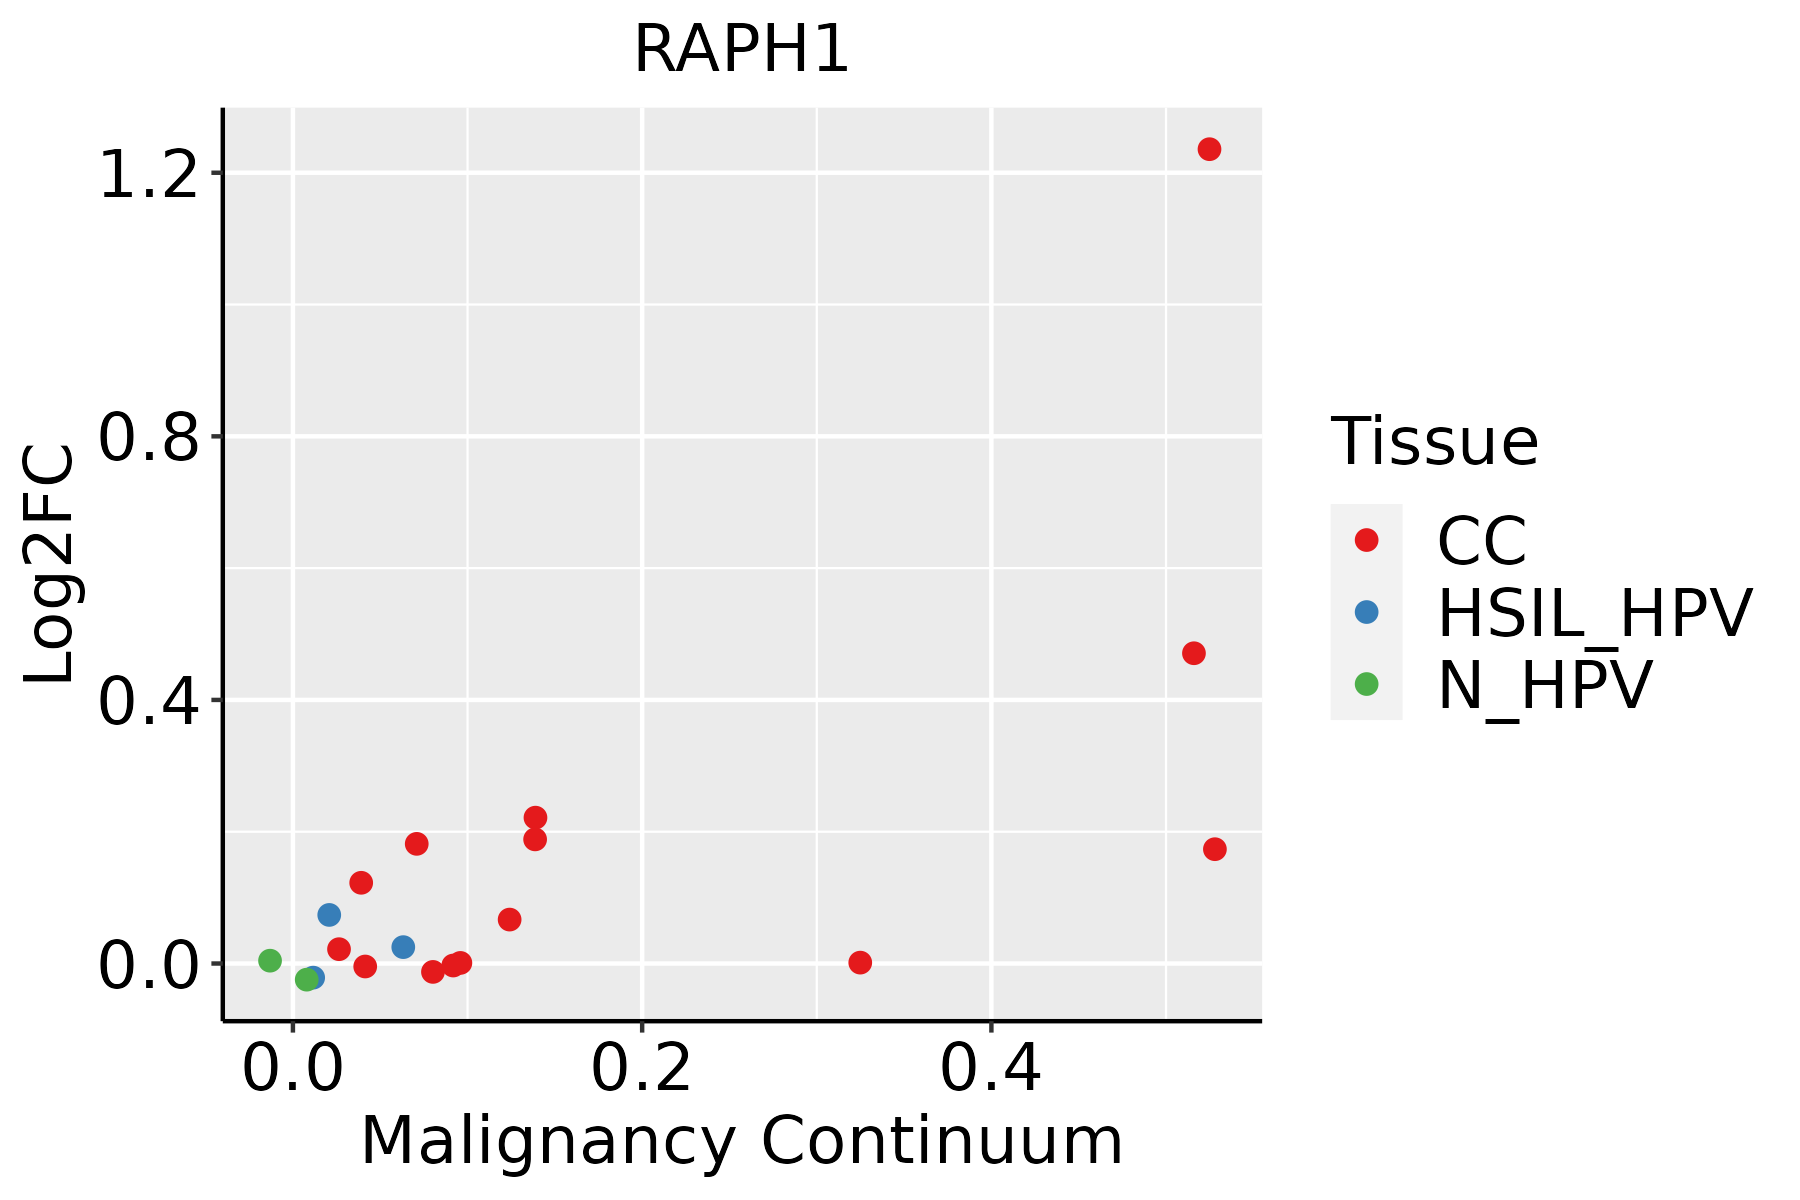 | CC: Cervix cancer |
| HSIL_HPV: HPV-infected high-grade squamous intraepithelial lesions | ||
| N_HPV: HPV-infected normal cervix | ||
| Endometrium | 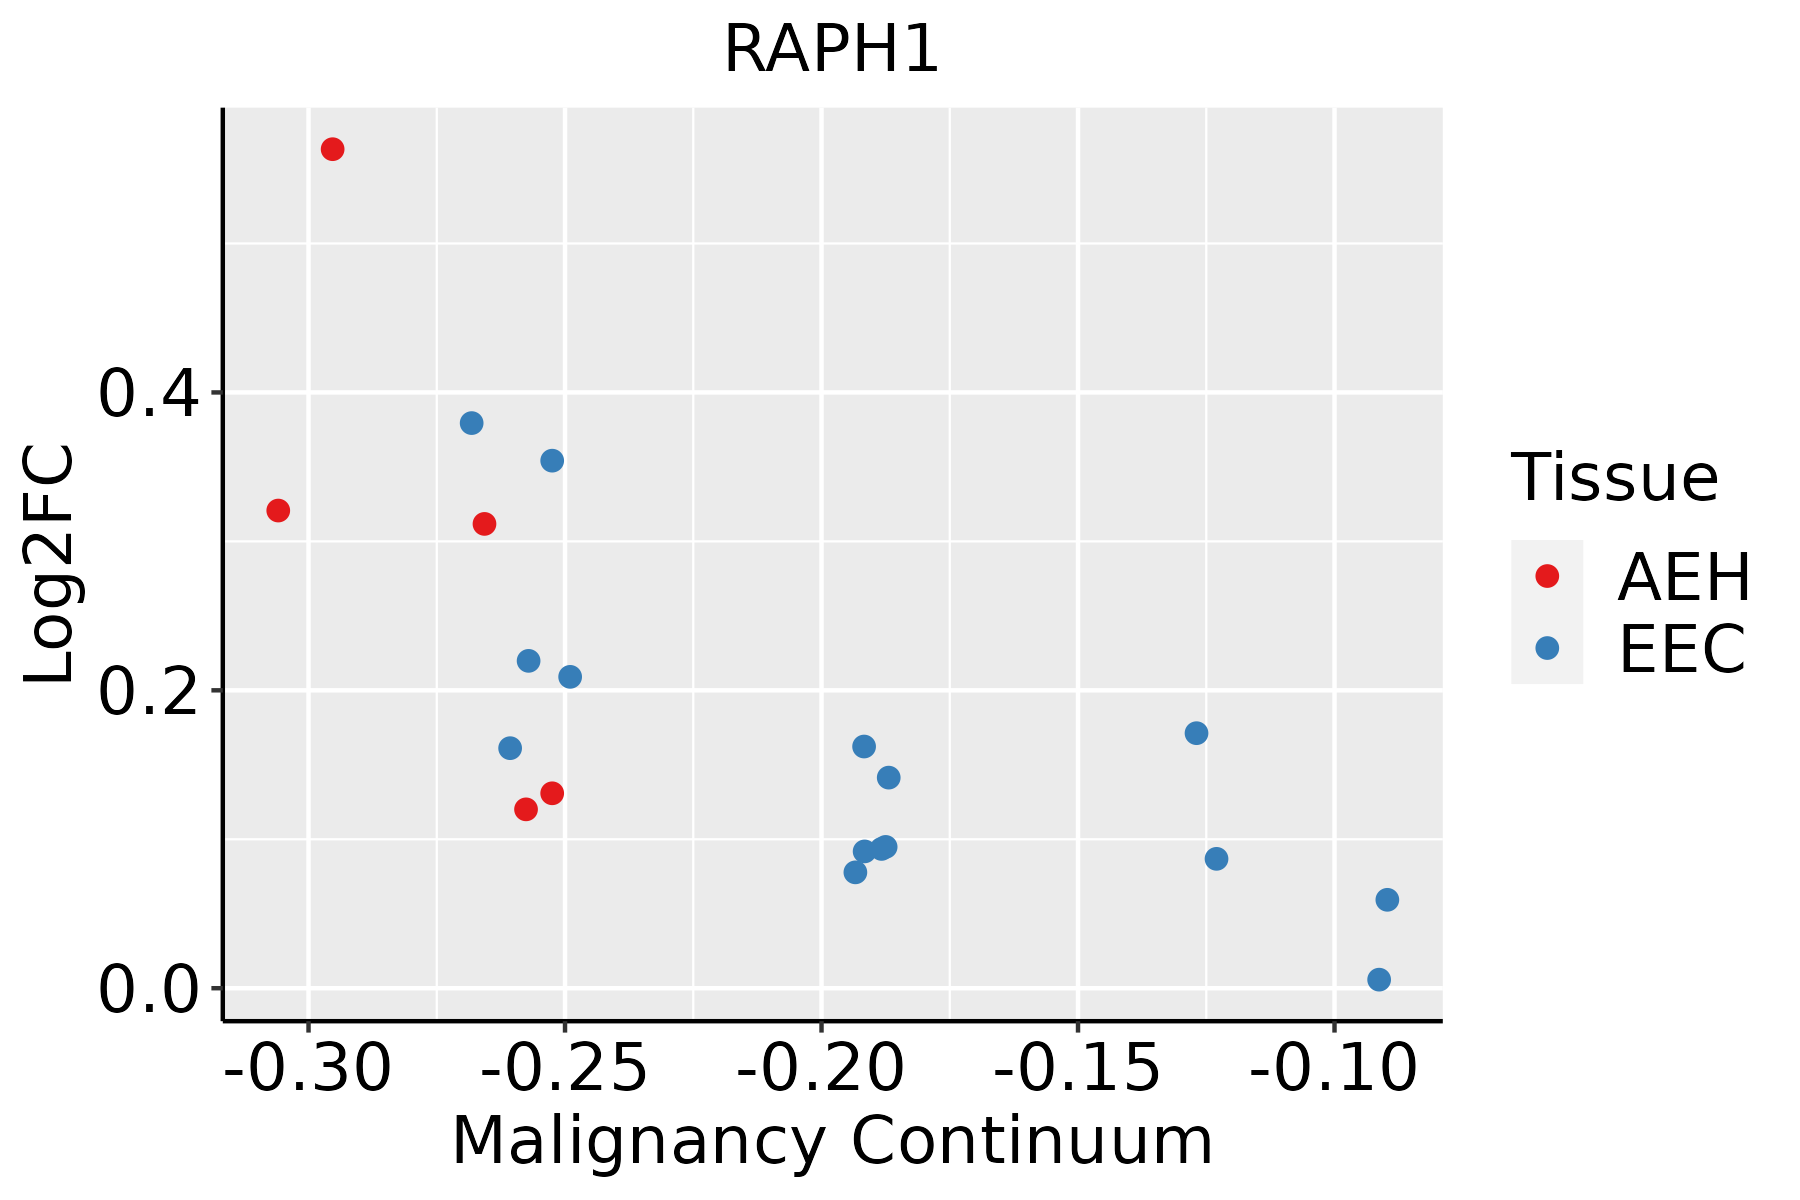 | AEH: Atypical endometrial hyperplasia |
| EEC: Endometrioid Cancer | ||
| Esophagus | 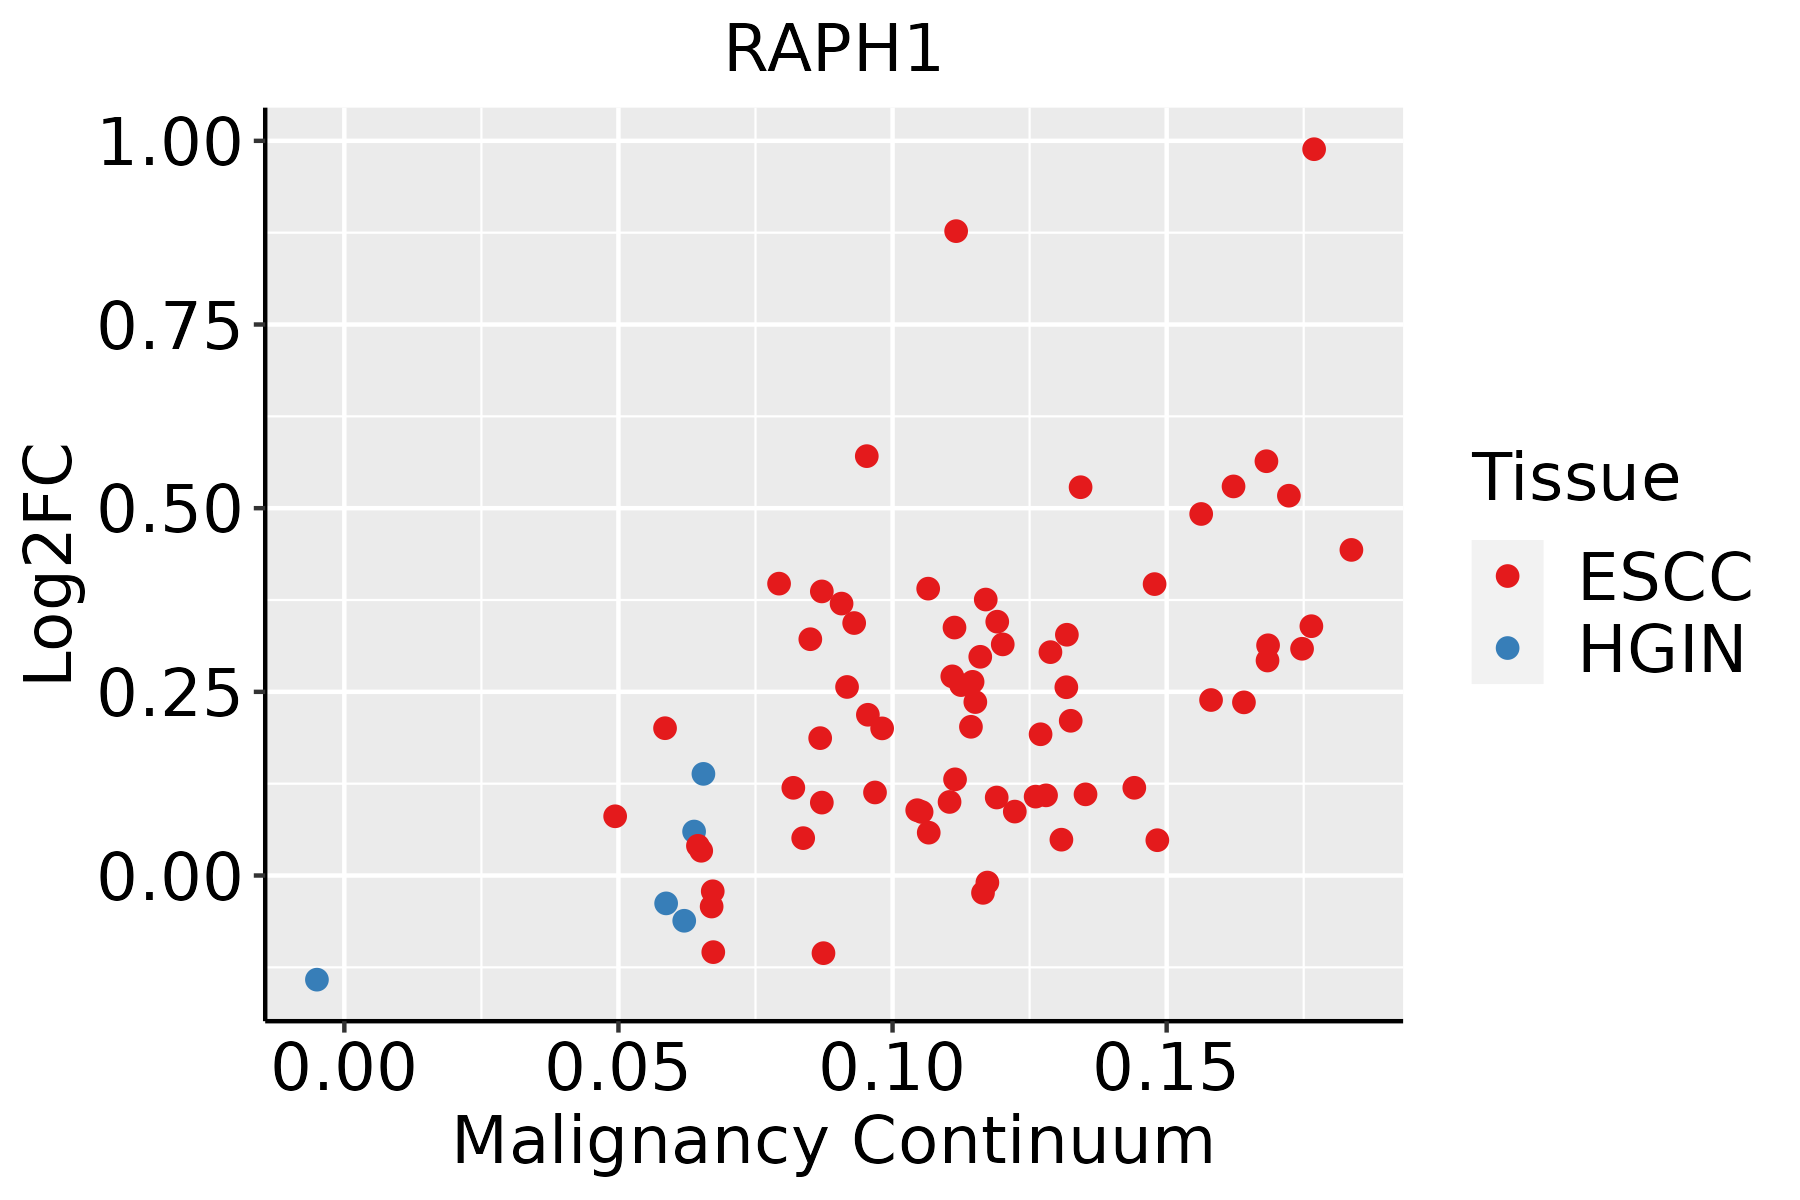 | ESCC: Esophageal squamous cell carcinoma |
| HGIN: High-grade intraepithelial neoplasias | ||
| LGIN: Low-grade intraepithelial neoplasias | ||
| Liver | 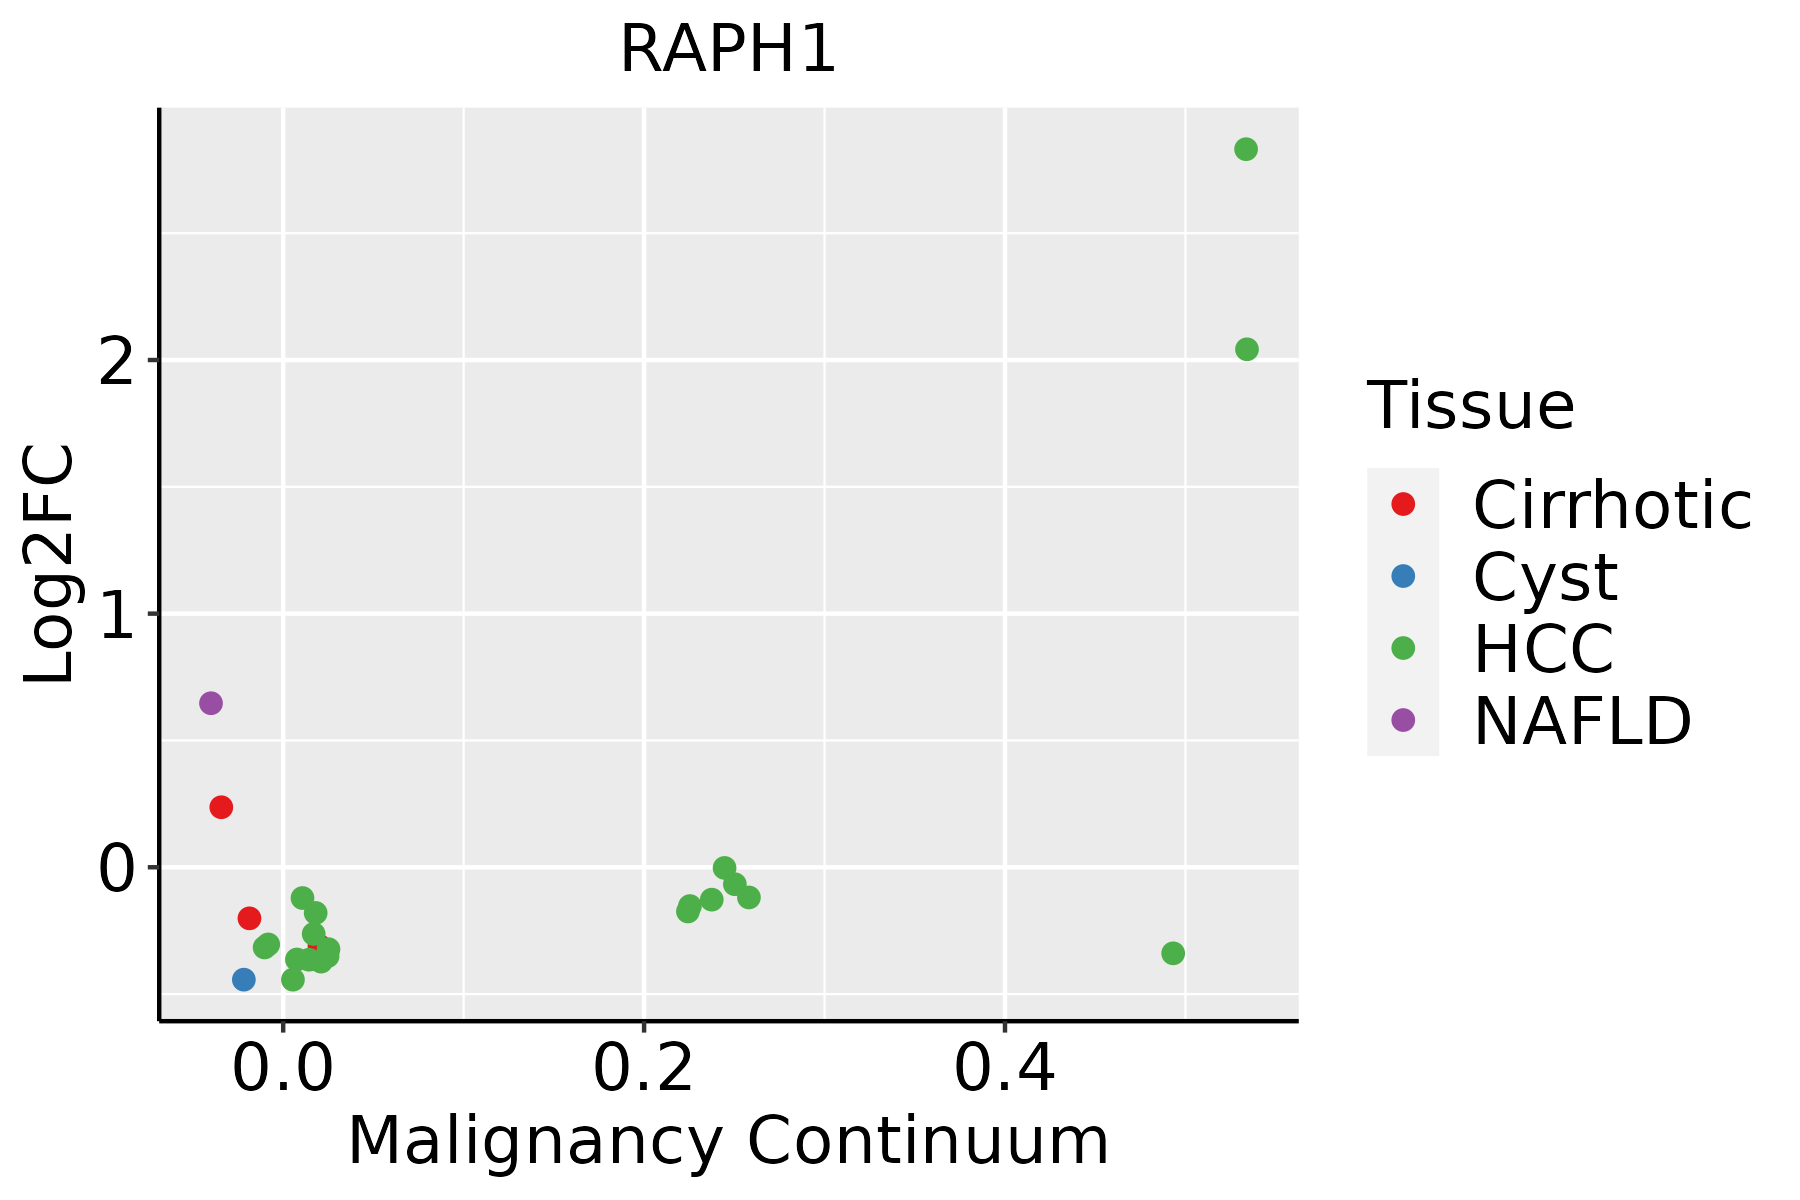 | HCC: Hepatocellular carcinoma |
| NAFLD: Non-alcoholic fatty liver disease | ||
| Lung | 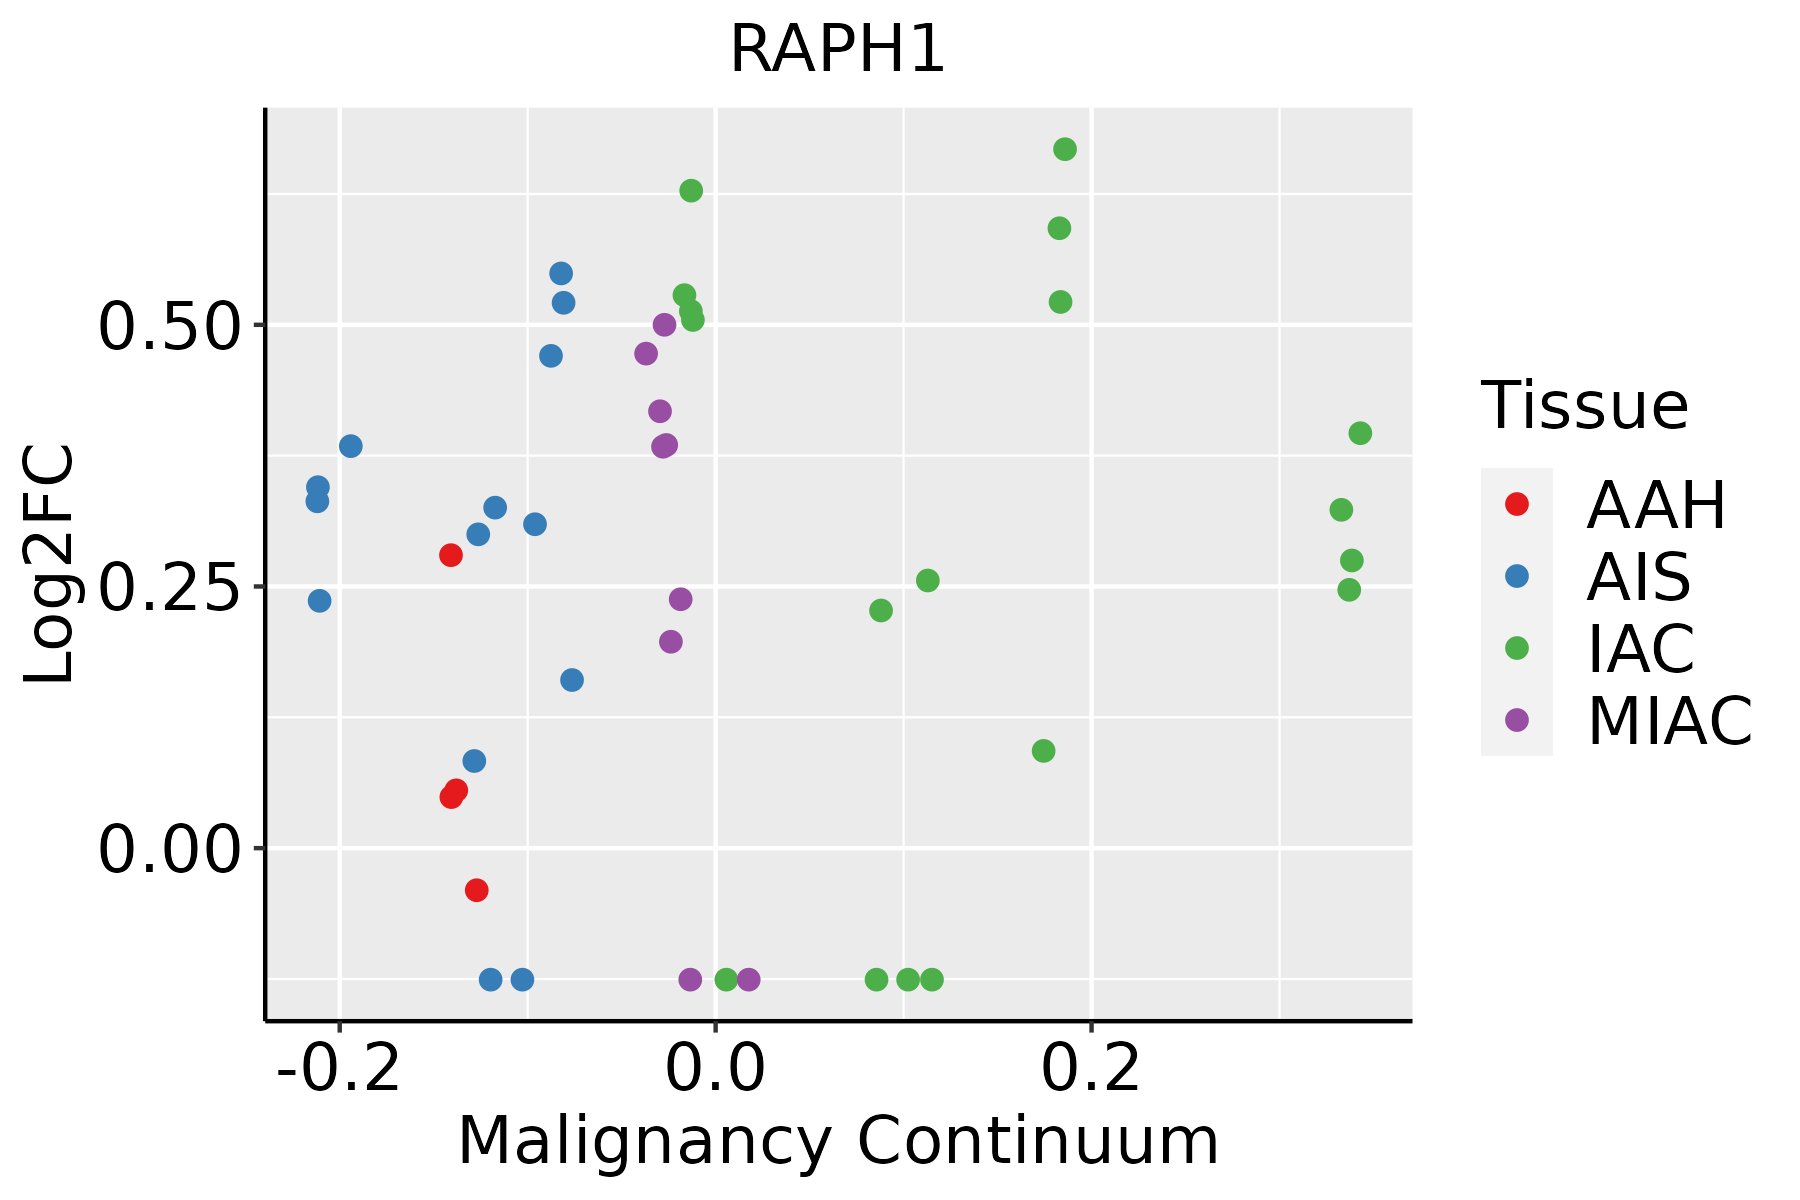 | AAH: Atypical adenomatous hyperplasia |
| AIS: Adenocarcinoma in situ | ||
| IAC: Invasive lung adenocarcinoma | ||
| MIA: Minimally invasive adenocarcinoma | ||
| Prostate | 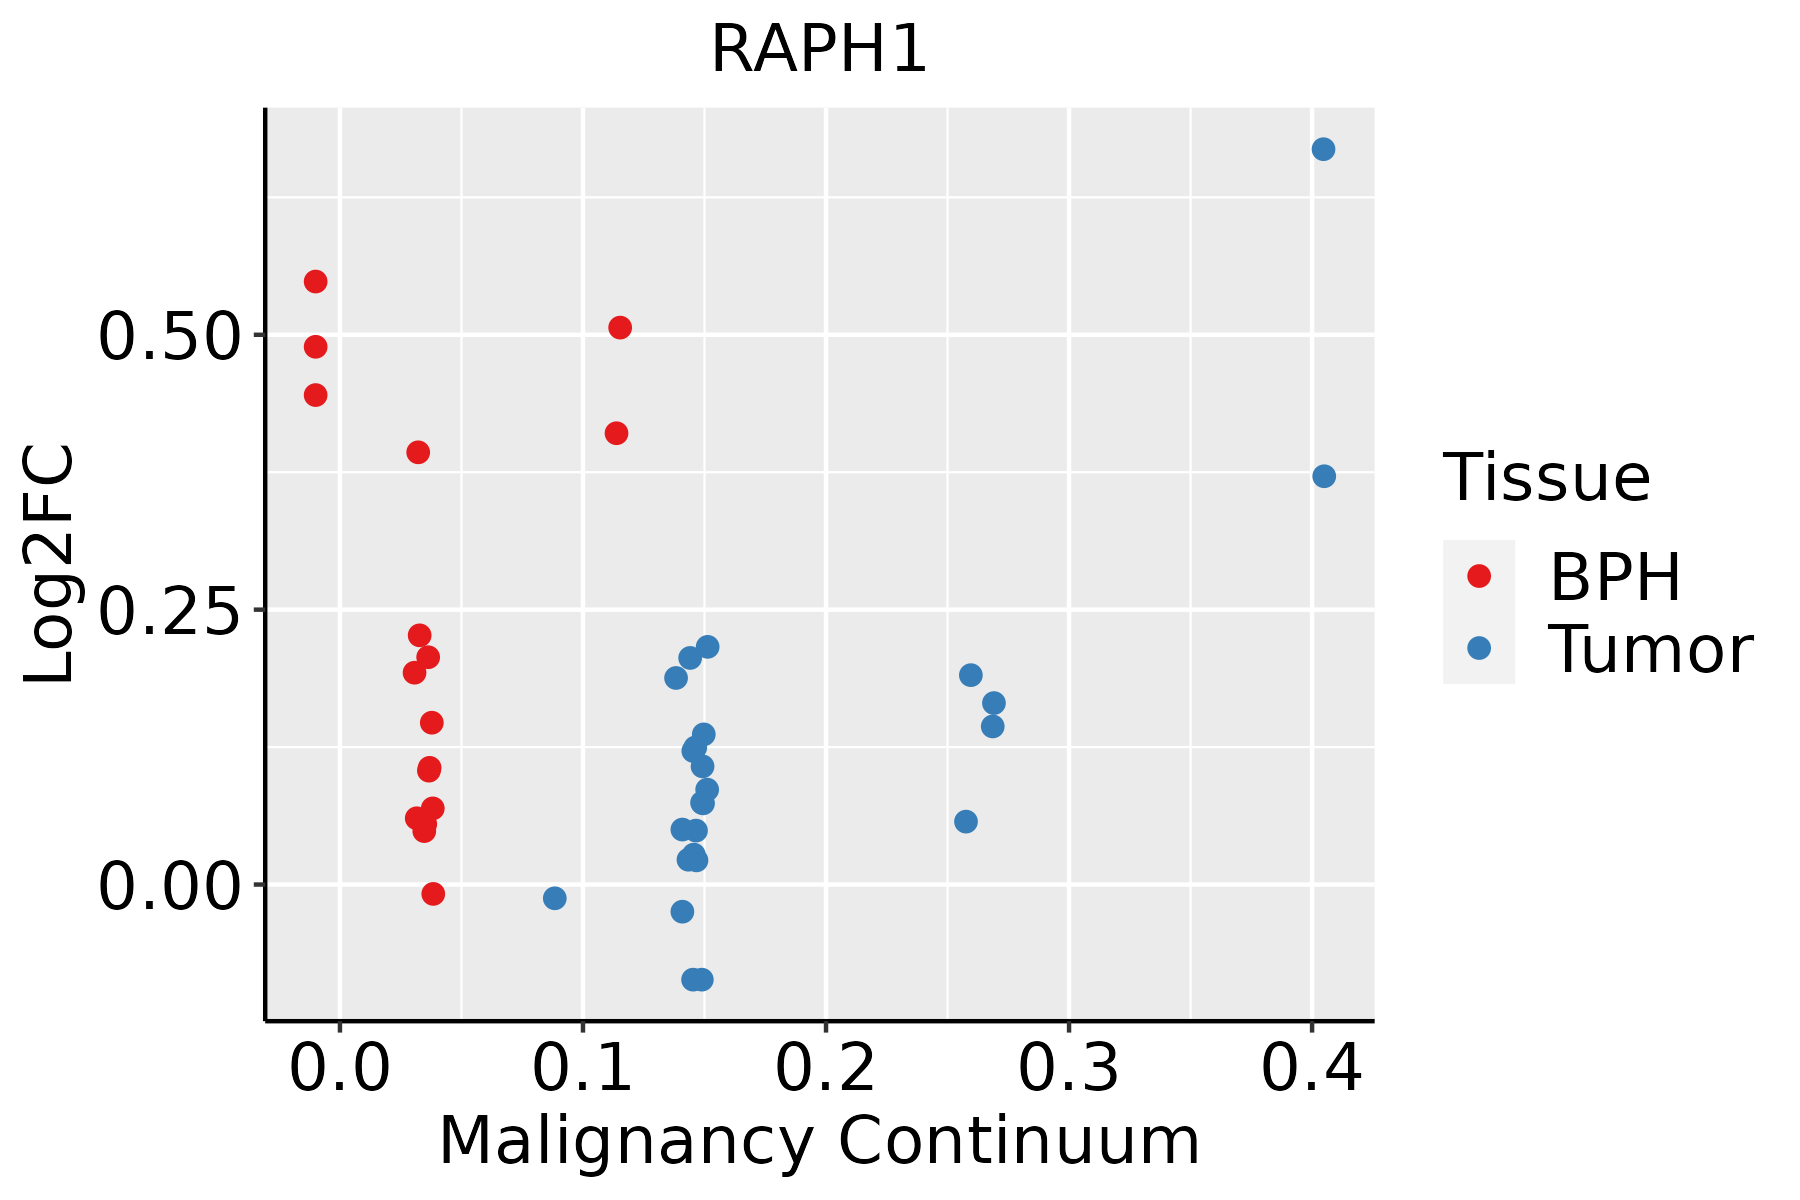 | BPH: Benign Prostatic Hyperplasia |
| Thyroid | 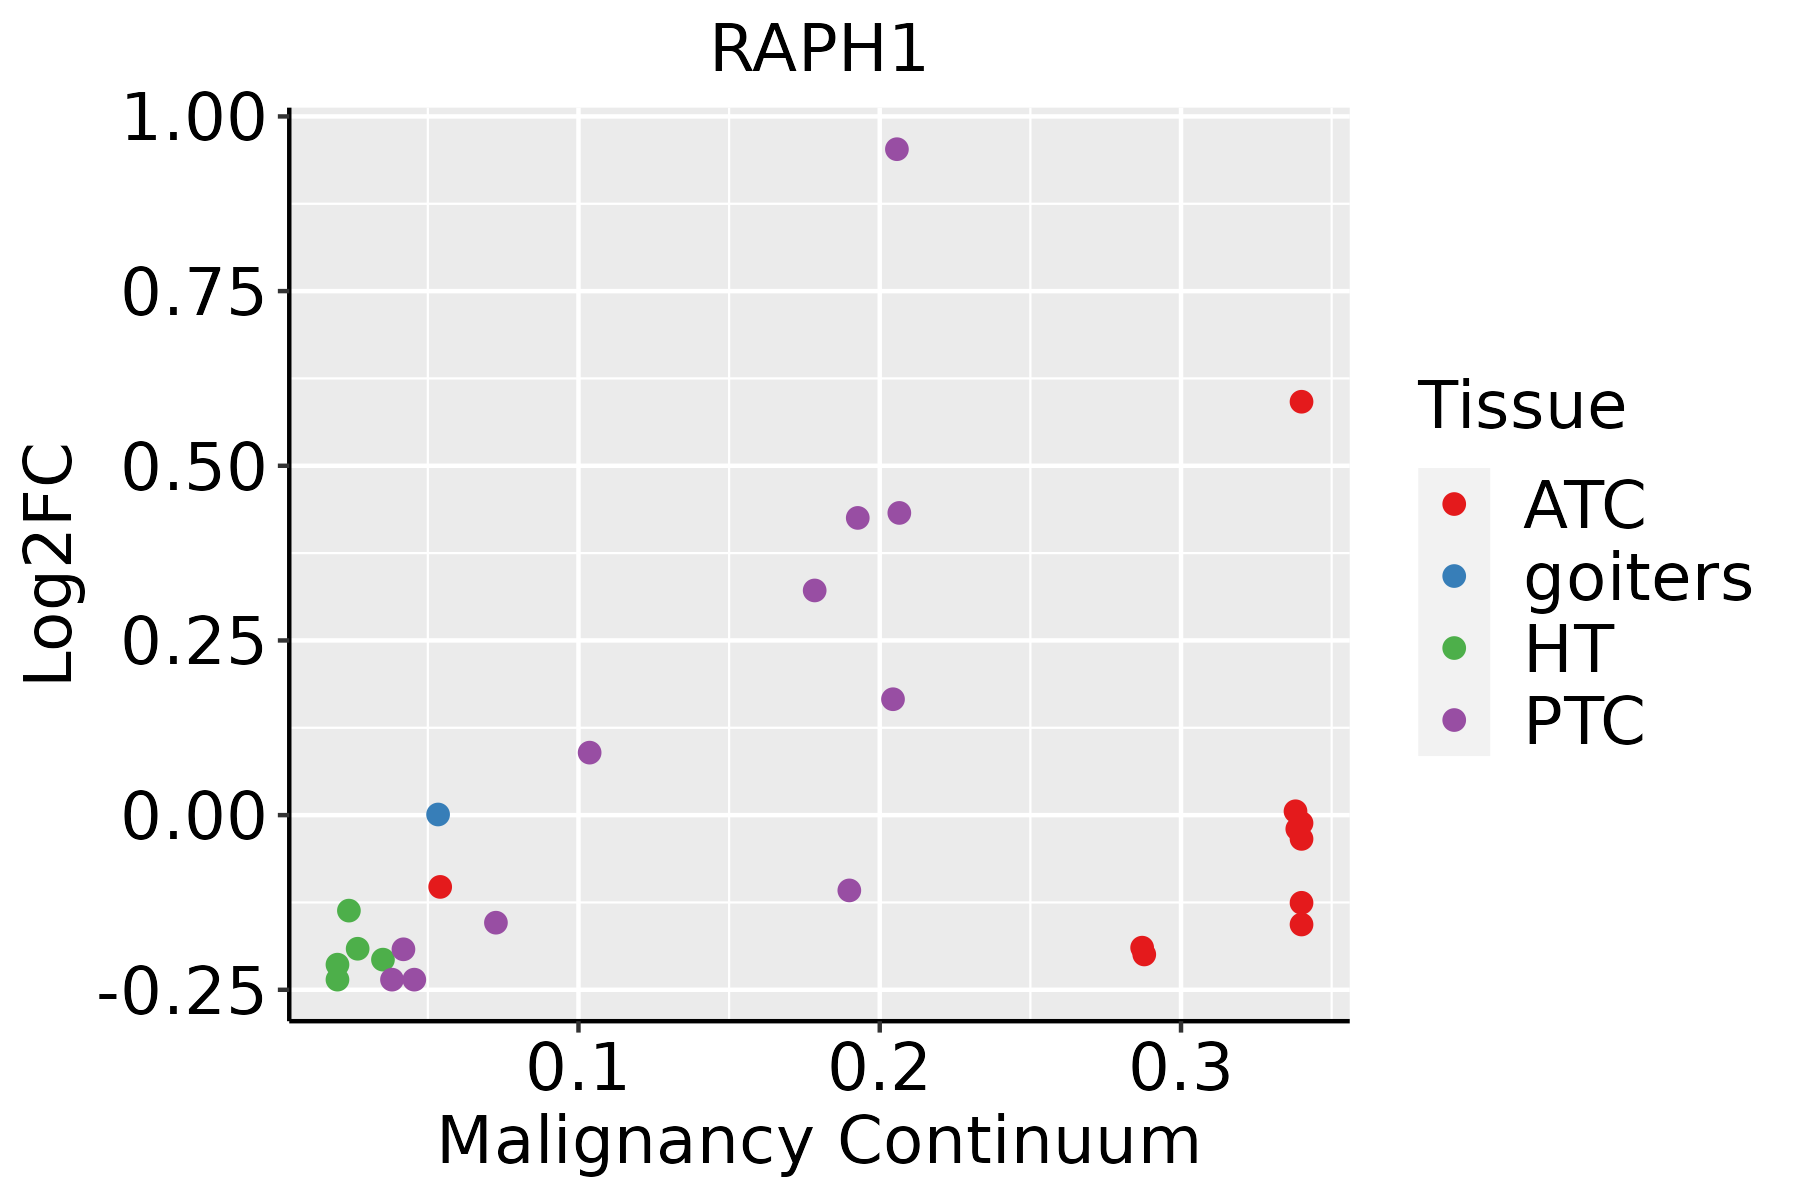 | ATC: Anaplastic thyroid cancer |
| HT: Hashimoto's thyroiditis | ||
| PTC: Papillary thyroid cancer |
| ∗log2FC in expression of this searched gene in stem-like cells from each diseased tissue sample relative to stem-like cells in normal samples in each tissue plotted against the malignancy continuum. Samples are colored based on if they are from different disease stage. |
Top |
Malignant transformation related pathway analysis |
| Find out the enriched GO biological processes and KEGG pathways involved in transition from healthy to precancer to cancer |
| Tissue | Disease Stage | Enriched GO biological Processes |
| Colorectum | AD |  |
| Colorectum | SER |  |
| Colorectum | MSS |  |
| Colorectum | MSI-H |  |
| Colorectum | FAP |  |
| ∗Top 15 enriched GO BP terms are showed in the bar plot of each disease state in each tissue. Each row represents a significant GO biological process which is colored according to the -log10(p.adjust). |
| Page: 1 2 3 4 5 6 7 8 9 |
| GO ID | Tissue | Disease Stage | Description | Gene Ratio | Bg Ratio | pvalue | p.adjust | Count |
| GO:00160498 | Cervix | CC | cell growth | 92/2311 | 482/18723 | 1.16e-05 | 2.49e-04 | 92 |
| GO:00615647 | Cervix | CC | axon development | 89/2311 | 467/18723 | 1.71e-05 | 3.27e-04 | 89 |
| GO:00074097 | Cervix | CC | axonogenesis | 78/2311 | 418/18723 | 1.14e-04 | 1.43e-03 | 78 |
| GO:00605606 | Cervix | CC | developmental growth involved in morphogenesis | 46/2311 | 234/18723 | 8.82e-04 | 7.63e-03 | 46 |
| GO:00486756 | Cervix | CC | axon extension | 26/2311 | 120/18723 | 2.80e-03 | 1.87e-02 | 26 |
| GO:19901385 | Cervix | CC | neuron projection extension | 34/2311 | 172/18723 | 3.52e-03 | 2.27e-02 | 34 |
| GO:00485886 | Cervix | CC | developmental cell growth | 42/2311 | 234/18723 | 7.88e-03 | 4.15e-02 | 42 |
| GO:00160499 | Endometrium | AEH | cell growth | 93/2100 | 482/18723 | 1.00e-07 | 4.99e-06 | 93 |
| GO:00605607 | Endometrium | AEH | developmental growth involved in morphogenesis | 53/2100 | 234/18723 | 4.02e-07 | 1.67e-05 | 53 |
| GO:00074098 | Endometrium | AEH | axonogenesis | 81/2100 | 418/18723 | 5.54e-07 | 2.12e-05 | 81 |
| GO:00615648 | Endometrium | AEH | axon development | 88/2100 | 467/18723 | 6.39e-07 | 2.38e-05 | 88 |
| GO:00486757 | Endometrium | AEH | axon extension | 31/2100 | 120/18723 | 6.13e-06 | 1.50e-04 | 31 |
| GO:00485887 | Endometrium | AEH | developmental cell growth | 48/2100 | 234/18723 | 2.39e-05 | 4.53e-04 | 48 |
| GO:19901386 | Endometrium | AEH | neuron projection extension | 38/2100 | 172/18723 | 3.03e-05 | 5.56e-04 | 38 |
| GO:006156412 | Endometrium | EEC | axon development | 93/2168 | 467/18723 | 9.60e-08 | 4.69e-06 | 93 |
| GO:001604915 | Endometrium | EEC | cell growth | 95/2168 | 482/18723 | 1.16e-07 | 5.54e-06 | 95 |
| GO:006056013 | Endometrium | EEC | developmental growth involved in morphogenesis | 54/2168 | 234/18723 | 4.60e-07 | 1.78e-05 | 54 |
| GO:000740912 | Endometrium | EEC | axonogenesis | 82/2168 | 418/18723 | 1.03e-06 | 3.49e-05 | 82 |
| GO:004867513 | Endometrium | EEC | axon extension | 31/2168 | 120/18723 | 1.17e-05 | 2.43e-04 | 31 |
| GO:004858813 | Endometrium | EEC | developmental cell growth | 49/2168 | 234/18723 | 2.59e-05 | 4.56e-04 | 49 |
| Page: 1 2 3 4 5 |
| Pathway ID | Tissue | Disease Stage | Description | Gene Ratio | Bg Ratio | pvalue | p.adjust | qvalue | Count |
| Page: 1 |
Top |
Cell-cell communication analysis |
| Identification of potential cell-cell interactions between two cell types and their ligand-receptor pairs for different disease states |
| Ligand | Receptor | LRpair | Pathway | Tissue | Disease Stage |
| Page: 1 |
Top |
Single-cell gene regulatory network inference analysis |
| Find out the significant the regulons (TFs) and the target genes of each regulon across cell types for different disease states |
| TF | Cell Type | Tissue | Disease Stage | Target Gene | RSS | Regulon Activity |
| ∗The dot plots of a searched regulon are shown for all cell subpopulations in each disease state of each tissue based on the regulon specific score inferred using pySCENIC and by calculating the average expression. |
| Page: 1 |
Top |
Somatic mutation of malignant transformation related genes |
| Annotation of somatic variants for genes involved in malignant transformation |
| Hugo Symbol | Variant Class | Variant Classification | dbSNP RS | HGVSc | HGVSp | HGVSp Short | SWISSPROT | BIOTYPE | SIFT | PolyPhen | Tumor Sample Barcode | Tissue | Histology | Sex | Age | Stage | Therapy Types | Drugs | Outcome |
| RAPH1 | SNV | Missense_Mutation | novel | c.3486N>T | p.Gln1162His | p.Q1162H | Q70E73 | protein_coding | deleterious_low_confidence(0) | probably_damaging(0.993) | TCGA-A8-A07U-01 | Breast | breast invasive carcinoma | Female | >=65 | III/IV | Chemotherapy | 5-fluorouracil | SD |
| RAPH1 | SNV | Missense_Mutation | c.505N>A | p.Glu169Lys | p.E169K | Q70E73 | protein_coding | deleterious_low_confidence(0) | probably_damaging(0.994) | TCGA-AC-A23H-01 | Breast | breast invasive carcinoma | Female | >=65 | I/II | Unknown | Unknown | PD | |
| RAPH1 | SNV | Missense_Mutation | c.419N>T | p.Ser140Phe | p.S140F | Q70E73 | protein_coding | deleterious_low_confidence(0) | possibly_damaging(0.853) | TCGA-AO-A0JC-01 | Breast | breast invasive carcinoma | Female | <65 | I/II | Chemotherapy | fluorouracil | SD | |
| RAPH1 | SNV | Missense_Mutation | rs747909587 | c.1993G>A | p.Val665Ile | p.V665I | Q70E73 | protein_coding | tolerated_low_confidence(0.34) | benign(0.17) | TCGA-AR-A0TV-01 | Breast | breast invasive carcinoma | Female | >=65 | I/II | Unknown | Unknown | SD |
| RAPH1 | SNV | Missense_Mutation | rs370726530 | c.1702C>T | p.Arg568Cys | p.R568C | Q70E73 | protein_coding | deleterious(0.01) | probably_damaging(0.996) | TCGA-BH-A1EN-01 | Breast | breast invasive carcinoma | Female | >=65 | I/II | Unknown | Unknown | SD |
| RAPH1 | SNV | Missense_Mutation | novel | c.1255C>G | p.Leu419Val | p.L419V | Q70E73 | protein_coding | tolerated(0.2) | probably_damaging(0.998) | TCGA-E2-A14Y-01 | Breast | breast invasive carcinoma | Female | <65 | I/II | Chemotherapy | carboplatin | SD |
| RAPH1 | insertion | Nonsense_Mutation | novel | c.3343_3344insGATATTTATGAAGTGATCTTTAACACATCTG | p.Ser1115Ter | p.S1115* | Q70E73 | protein_coding | TCGA-A2-A0CQ-01 | Breast | breast invasive carcinoma | Female | <65 | I/II | Chemotherapy | adriamycin | SD | ||
| RAPH1 | insertion | Nonsense_Mutation | novel | c.3483_3484insATTCGTTAAATTTATTGTAACCTAATACCAAAAACTGCCGTTTTT | p.Val1161_Gln1162insIleArgTerIleTyrCysAsnLeuIleProLysThrAlaValPhe | p.V1161_Q1162insIR*IYCNLIPKTAVF | Q70E73 | protein_coding | TCGA-A8-A07U-01 | Breast | breast invasive carcinoma | Female | >=65 | III/IV | Chemotherapy | 5-fluorouracil | SD | ||
| RAPH1 | insertion | Frame_Shift_Ins | novel | c.2964_2965insGTAGTGACTTGCTTAATTAGTGA | p.His989ValfsTer20 | p.H989Vfs*20 | Q70E73 | protein_coding | TCGA-A8-A097-01 | Breast | breast invasive carcinoma | Female | >=65 | I/II | Hormone Therapy | tamoxiphen | SD | ||
| RAPH1 | insertion | Nonsense_Mutation | novel | c.2872_2873insTTTAGGATGTGCTGACAGATAAGCTCTTT | p.Lys958IlefsTer2 | p.K958Ifs*2 | Q70E73 | protein_coding | TCGA-A8-A09C-01 | Breast | breast invasive carcinoma | Female | >=65 | I/II | Unknown | Unknown | SD |
| Page: 1 2 3 4 5 6 7 8 9 10 11 |
Top |
Related drugs of malignant transformation related genes |
| Identification of chemicals and drugs interact with genes involved in malignant transfromation |
| (DGIdb 4.0) |
| Entrez ID | Symbol | Category | Interaction Types | Drug Claim Name | Drug Name | PMIDs |
| Page: 1 |

Copyright 2023-Present -The University of Texas Health Science Center at Houston |