
|
|||||
|
 | |
| |
| |
| |
| |
| |
|
Gene: RAPGEFL1 |
Gene summary for RAPGEFL1 |
| Gene information | Species | Human | Gene symbol | RAPGEFL1 | Gene ID | 51195 |
| Gene name | Rap guanine nucleotide exchange factor like 1 | |
| Gene Alias | Link-GEFII | |
| Cytomap | 17q21.1 | |
| Gene Type | protein-coding | GO ID | GO:0007154 | UniProtAcc | Q9UHV5 |
Top |
Malignant transformation analysis |
| Identification of the aberrant gene expression in precancerous and cancerous lesions by comparing the gene expression of stem-like cells in diseased tissues with normal stem cells |
| Entrez ID | Symbol | Replicates | Species | Organ | Tissue | Adj P-value | Log2FC | Malignancy |
| 51195 | RAPGEFL1 | CCI_1 | Human | Cervix | CC | 2.51e-04 | 5.37e-01 | 0.528 |
| 51195 | RAPGEFL1 | CCI_3 | Human | Cervix | CC | 1.43e-08 | 5.30e-01 | 0.516 |
| 51195 | RAPGEFL1 | Tumor | Human | Cervix | CC | 8.56e-05 | 2.51e-01 | 0.1241 |
| 51195 | RAPGEFL1 | sample3 | Human | Cervix | CC | 2.57e-11 | 2.90e-01 | 0.1387 |
| 51195 | RAPGEFL1 | T3 | Human | Cervix | CC | 1.79e-09 | 3.04e-01 | 0.1389 |
| 51195 | RAPGEFL1 | HTA11_347_2000001011 | Human | Colorectum | AD | 2.68e-11 | 5.31e-01 | -0.1954 |
| 51195 | RAPGEFL1 | HTA11_696_2000001011 | Human | Colorectum | AD | 2.08e-02 | 3.33e-01 | -0.1464 |
| 51195 | RAPGEFL1 | A002-C-010 | Human | Colorectum | FAP | 3.19e-04 | -2.91e-01 | 0.242 |
| 51195 | RAPGEFL1 | A001-C-207 | Human | Colorectum | FAP | 2.84e-03 | -2.45e-01 | 0.1278 |
| 51195 | RAPGEFL1 | A015-C-203 | Human | Colorectum | FAP | 1.03e-10 | -2.05e-01 | -0.1294 |
| 51195 | RAPGEFL1 | A002-C-201 | Human | Colorectum | FAP | 3.94e-06 | -2.40e-01 | 0.0324 |
| 51195 | RAPGEFL1 | A001-C-119 | Human | Colorectum | FAP | 2.17e-08 | -4.27e-01 | -0.1557 |
| 51195 | RAPGEFL1 | A001-C-108 | Human | Colorectum | FAP | 1.21e-10 | -3.35e-01 | -0.0272 |
| 51195 | RAPGEFL1 | A002-C-205 | Human | Colorectum | FAP | 1.57e-12 | -3.42e-01 | -0.1236 |
| 51195 | RAPGEFL1 | A001-C-104 | Human | Colorectum | FAP | 1.26e-02 | -2.62e-01 | 0.0184 |
| 51195 | RAPGEFL1 | A015-C-006 | Human | Colorectum | FAP | 4.72e-07 | -2.74e-02 | -0.0994 |
| 51195 | RAPGEFL1 | A015-C-106 | Human | Colorectum | FAP | 1.15e-05 | -2.05e-01 | -0.0511 |
| 51195 | RAPGEFL1 | A002-C-114 | Human | Colorectum | FAP | 2.85e-10 | -2.89e-01 | -0.1561 |
| 51195 | RAPGEFL1 | A015-C-104 | Human | Colorectum | FAP | 2.57e-14 | -2.82e-01 | -0.1899 |
| 51195 | RAPGEFL1 | A001-C-014 | Human | Colorectum | FAP | 2.44e-06 | -3.16e-01 | 0.0135 |
| Page: 1 2 3 4 5 |
| Tissue | Expression Dynamics | Abbreviation |
| Cervix | 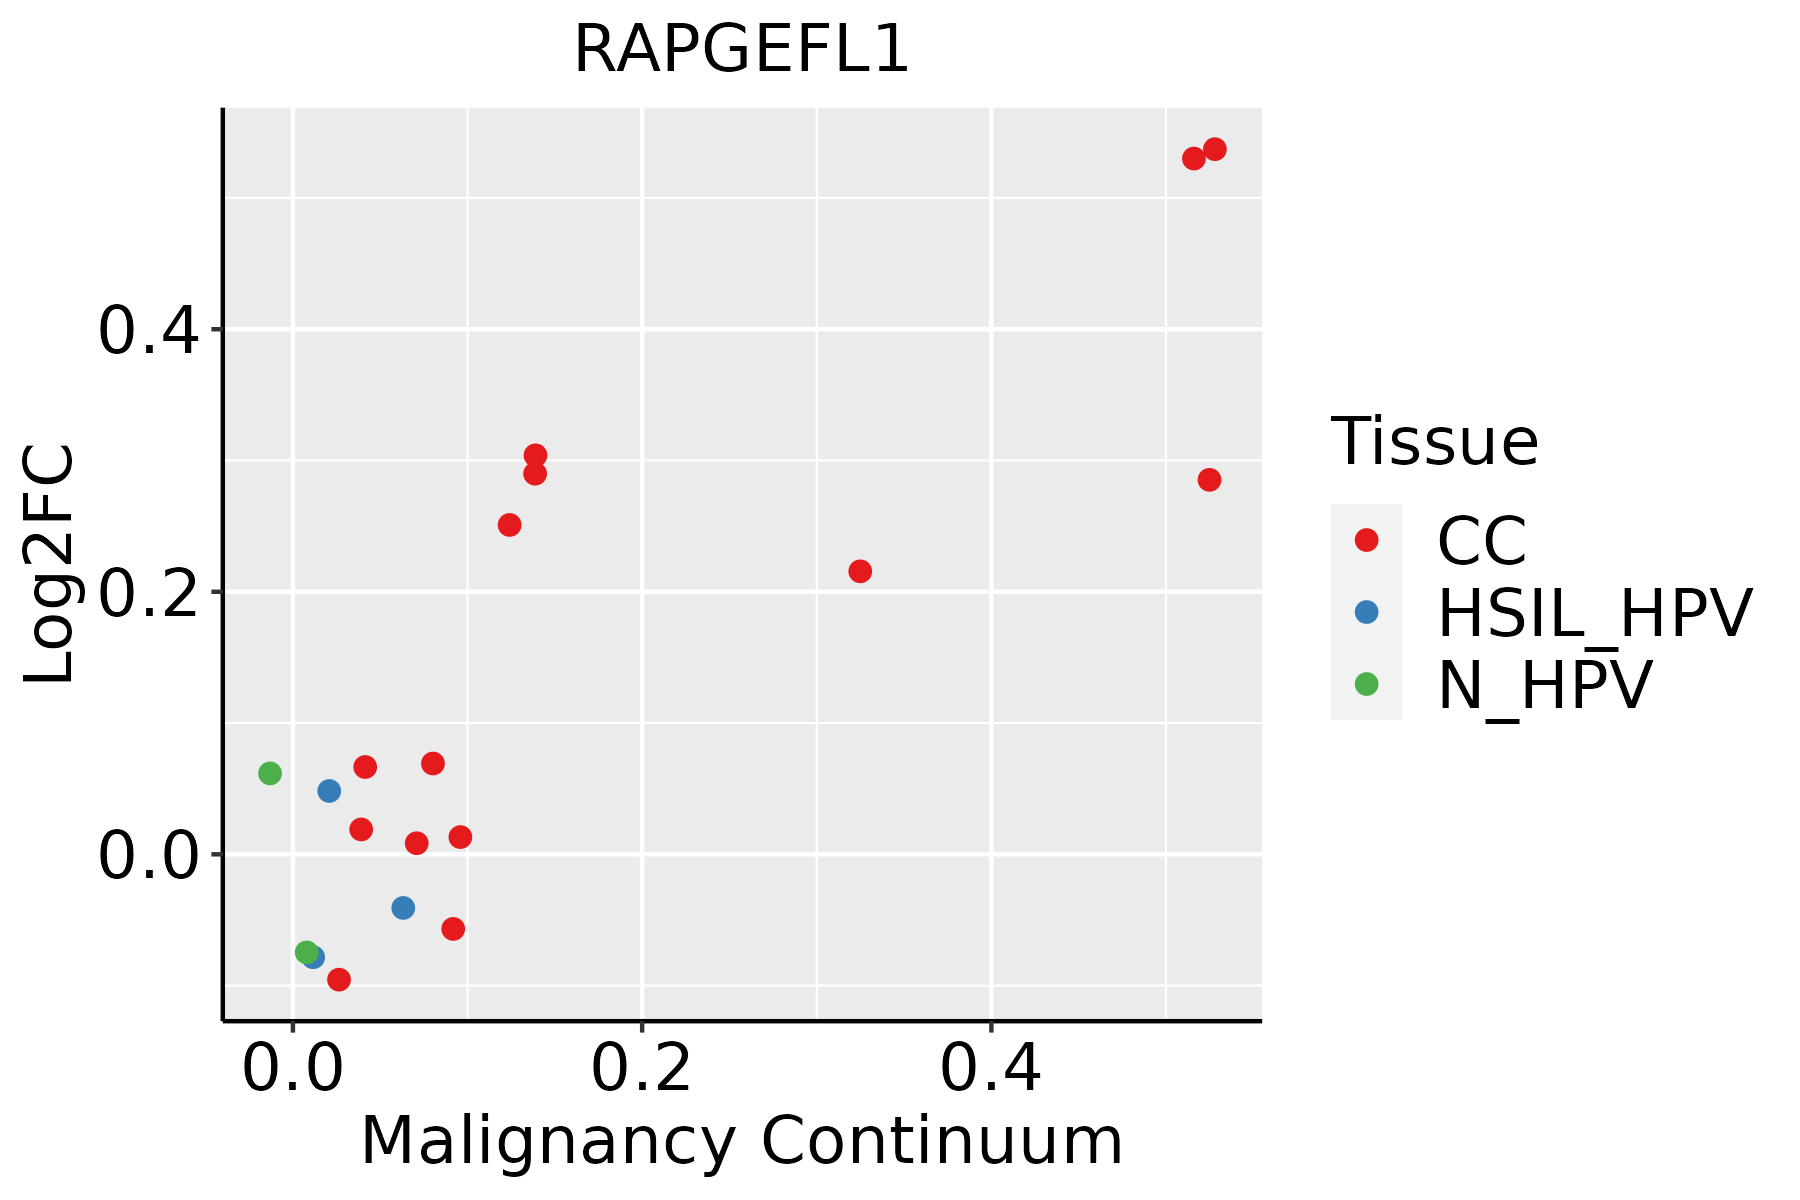 | CC: Cervix cancer |
| HSIL_HPV: HPV-infected high-grade squamous intraepithelial lesions | ||
| N_HPV: HPV-infected normal cervix | ||
| Colorectum (GSE201348) |  | FAP: Familial adenomatous polyposis |
| CRC: Colorectal cancer | ||
| Colorectum (HTA11) |  | AD: Adenomas |
| SER: Sessile serrated lesions | ||
| MSI-H: Microsatellite-high colorectal cancer | ||
| MSS: Microsatellite stable colorectal cancer | ||
| Esophagus | 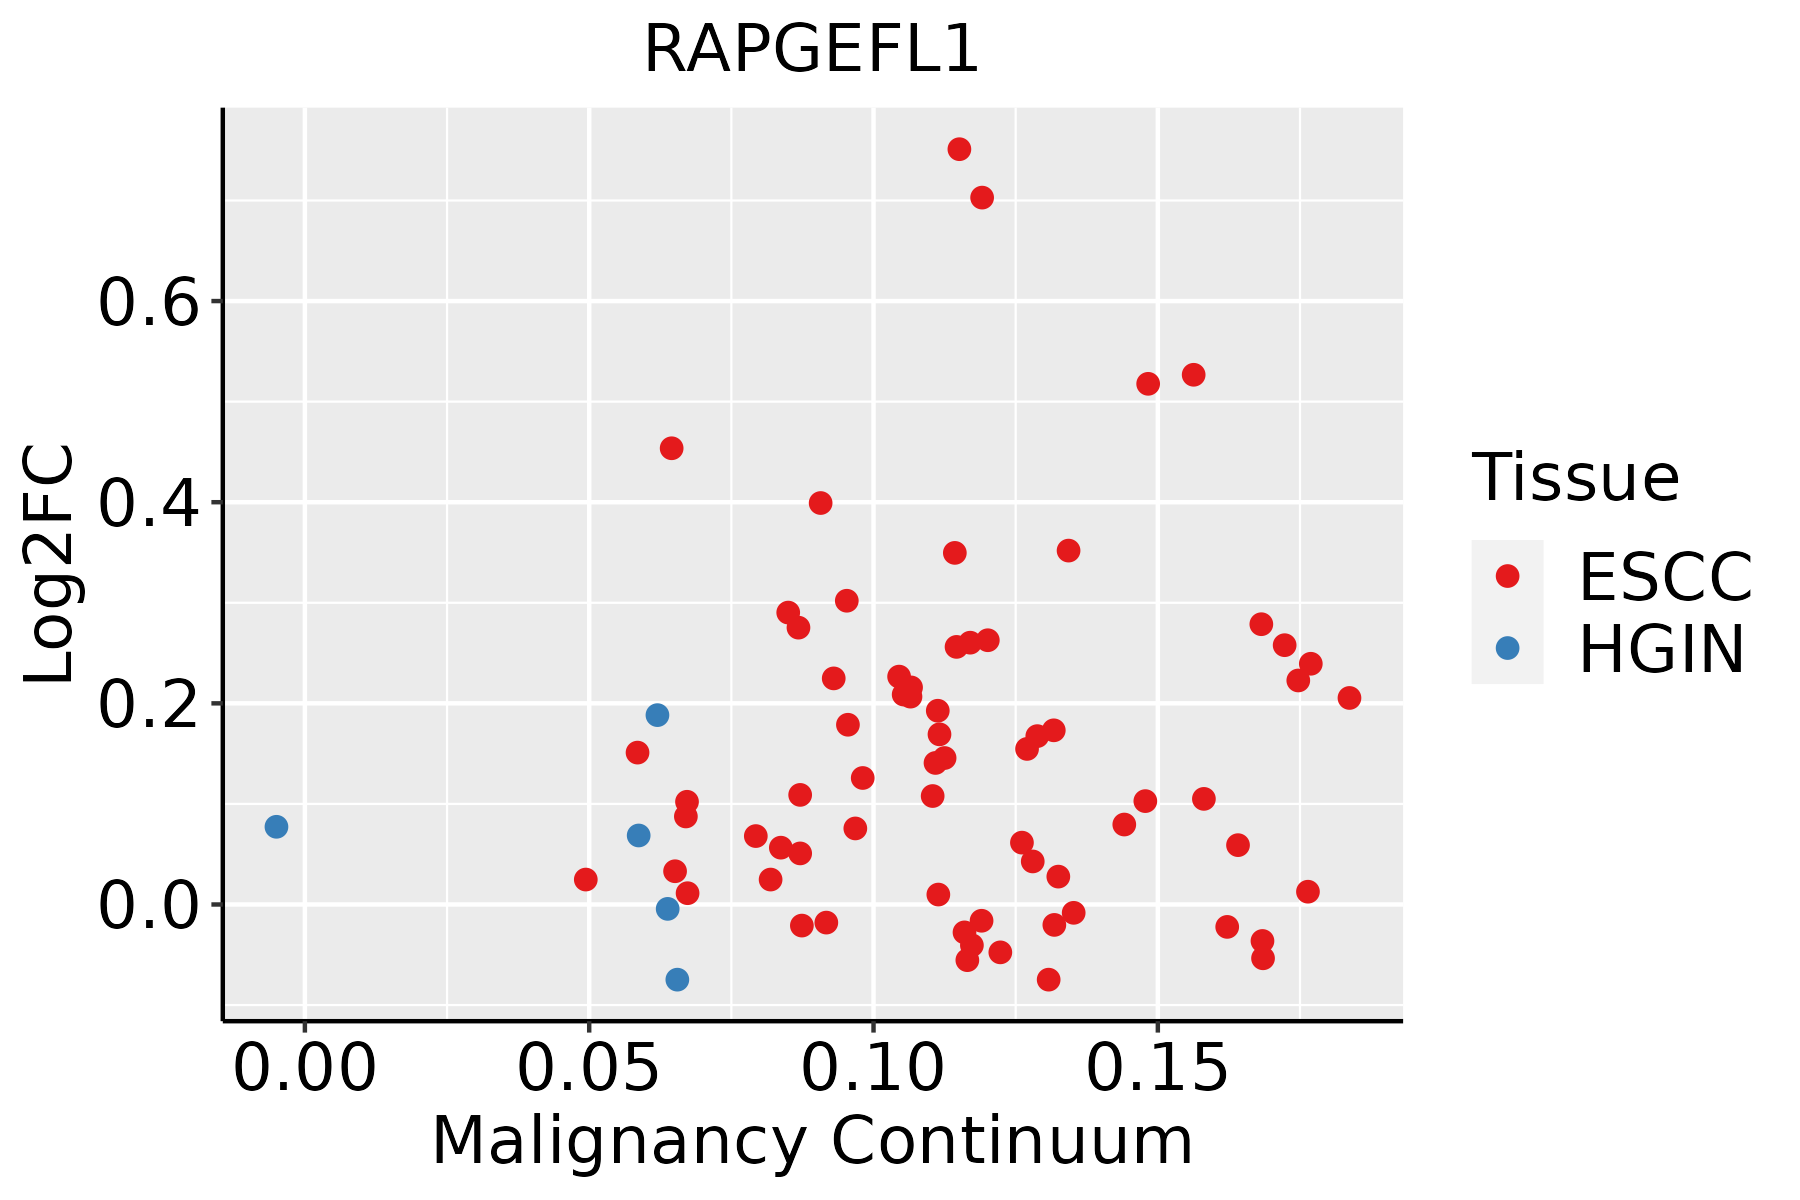 | ESCC: Esophageal squamous cell carcinoma |
| HGIN: High-grade intraepithelial neoplasias | ||
| LGIN: Low-grade intraepithelial neoplasias | ||
| Oral Cavity |  | EOLP: Erosive Oral lichen planus |
| LP: leukoplakia | ||
| NEOLP: Non-erosive oral lichen planus | ||
| OSCC: Oral squamous cell carcinoma |
| ∗log2FC in expression of this searched gene in stem-like cells from each diseased tissue sample relative to stem-like cells in normal samples in each tissue plotted against the malignancy continuum. Samples are colored based on if they are from different disease stage. |
Top |
Malignant transformation related pathway analysis |
| Find out the enriched GO biological processes and KEGG pathways involved in transition from healthy to precancer to cancer |
| Tissue | Disease Stage | Enriched GO biological Processes |
| Colorectum | AD |  |
| Colorectum | SER |  |
| Colorectum | MSS |  |
| Colorectum | MSI-H |  |
| Colorectum | FAP |  |
| ∗Top 15 enriched GO BP terms are showed in the bar plot of each disease state in each tissue. Each row represents a significant GO biological process which is colored according to the -log10(p.adjust). |
| Page: 1 2 3 4 5 6 7 8 9 |
| GO ID | Tissue | Disease Stage | Description | Gene Ratio | Bg Ratio | pvalue | p.adjust | Count |
| Page: 1 |
| Pathway ID | Tissue | Disease Stage | Description | Gene Ratio | Bg Ratio | pvalue | p.adjust | qvalue | Count |
| Page: 1 |
Top |
Cell-cell communication analysis |
| Identification of potential cell-cell interactions between two cell types and their ligand-receptor pairs for different disease states |
| Ligand | Receptor | LRpair | Pathway | Tissue | Disease Stage |
| Page: 1 |
Top |
Single-cell gene regulatory network inference analysis |
| Find out the significant the regulons (TFs) and the target genes of each regulon across cell types for different disease states |
| TF | Cell Type | Tissue | Disease Stage | Target Gene | RSS | Regulon Activity |
| ∗The dot plots of a searched regulon are shown for all cell subpopulations in each disease state of each tissue based on the regulon specific score inferred using pySCENIC and by calculating the average expression. |
| Page: 1 |
Top |
Somatic mutation of malignant transformation related genes |
| Annotation of somatic variants for genes involved in malignant transformation |
| Hugo Symbol | Variant Class | Variant Classification | dbSNP RS | HGVSc | HGVSp | HGVSp Short | SWISSPROT | BIOTYPE | SIFT | PolyPhen | Tumor Sample Barcode | Tissue | Histology | Sex | Age | Stage | Therapy Types | Drugs | Outcome |
| RAPGEFL1 | SNV | Missense_Mutation | novel | c.1313N>T | p.Gly438Val | p.G438V | Q9UHV5 | protein_coding | deleterious(0) | probably_damaging(0.954) | TCGA-UU-A93S-01 | Breast | breast invasive carcinoma | Female | <65 | III/IV | Unknown | Unknown | PD |
| RAPGEFL1 | insertion | Nonsense_Mutation | novel | c.645_646insTGTTGAAAGCCATTTTCCT | p.Val216CysfsTer2 | p.V216Cfs*2 | Q9UHV5 | protein_coding | TCGA-AN-A03Y-01 | Breast | breast invasive carcinoma | Female | >=65 | I/II | Unknown | Unknown | SD | ||
| RAPGEFL1 | insertion | Nonsense_Mutation | novel | c.421_422insTATCAACACCTCCTGCCTGGTATTAGAAGTAG | p.Pro141LeufsTer9 | p.P141Lfs*9 | Q9UHV5 | protein_coding | TCGA-AN-A0FX-01 | Breast | breast invasive carcinoma | Female | <65 | I/II | Unknown | Unknown | SD | ||
| RAPGEFL1 | SNV | Missense_Mutation | c.364G>A | p.Glu122Lys | p.E122K | Q9UHV5 | protein_coding | tolerated(0.41) | possibly_damaging(0.561) | TCGA-EK-A3GJ-01 | Cervix | cervical & endocervical cancer | Female | <65 | I/II | Unknown | Unknown | SD | |
| RAPGEFL1 | SNV | Missense_Mutation | rs751331577 | c.502C>T | p.Arg168Cys | p.R168C | Q9UHV5 | protein_coding | deleterious(0) | benign(0.203) | TCGA-5M-AAT6-01 | Colorectum | colon adenocarcinoma | Female | <65 | III/IV | Unknown | Unknown | PD |
| RAPGEFL1 | SNV | Missense_Mutation | novel | c.203N>A | p.Cys68Tyr | p.C68Y | Q9UHV5 | protein_coding | deleterious(0) | possibly_damaging(0.622) | TCGA-AJ-A3EK-01 | Endometrium | uterine corpus endometrioid carcinoma | Female | <65 | I/II | Chemotherapy | carboplatin | CR |
| RAPGEFL1 | SNV | Missense_Mutation | novel | c.443N>T | p.Arg148Leu | p.R148L | Q9UHV5 | protein_coding | tolerated(0.82) | benign(0.044) | TCGA-AP-A056-01 | Endometrium | uterine corpus endometrioid carcinoma | Female | <65 | I/II | Unknown | Unknown | SD |
| RAPGEFL1 | SNV | Missense_Mutation | novel | c.1166N>C | p.Lys389Thr | p.K389T | Q9UHV5 | protein_coding | deleterious(0) | probably_damaging(0.998) | TCGA-AP-A056-01 | Endometrium | uterine corpus endometrioid carcinoma | Female | <65 | I/II | Unknown | Unknown | SD |
| RAPGEFL1 | SNV | Missense_Mutation | novel | c.1343N>G | p.Asn448Ser | p.N448S | Q9UHV5 | protein_coding | deleterious(0) | probably_damaging(0.995) | TCGA-AP-A059-01 | Endometrium | uterine corpus endometrioid carcinoma | Female | >=65 | I/II | Unknown | Unknown | SD |
| RAPGEFL1 | SNV | Missense_Mutation | rs756596694 | c.466C>T | p.Arg156Trp | p.R156W | Q9UHV5 | protein_coding | deleterious(0) | probably_damaging(0.998) | TCGA-AX-A2HC-01 | Endometrium | uterine corpus endometrioid carcinoma | Female | <65 | III/IV | Chemotherapy | paclitaxel | PD |
| Page: 1 2 3 |
Top |
Related drugs of malignant transformation related genes |
| Identification of chemicals and drugs interact with genes involved in malignant transfromation |
| (DGIdb 4.0) |
| Entrez ID | Symbol | Category | Interaction Types | Drug Claim Name | Drug Name | PMIDs |
| Page: 1 |

Copyright 2023-Present -The University of Texas Health Science Center at Houston |