
|
|||||
|
 | |
| |
| |
| |
| |
| |
|
Gene: RAPGEF6 |
Gene summary for RAPGEF6 |
| Gene information | Species | Human | Gene symbol | RAPGEF6 | Gene ID | 51735 |
| Gene name | Rap guanine nucleotide exchange factor 6 | |
| Gene Alias | KIA001LB | |
| Cytomap | 5q31.1 | |
| Gene Type | protein-coding | GO ID | GO:0007154 | UniProtAcc | B2RTU6 |
Top |
Malignant transformation analysis |
| Identification of the aberrant gene expression in precancerous and cancerous lesions by comparing the gene expression of stem-like cells in diseased tissues with normal stem cells |
| Entrez ID | Symbol | Replicates | Species | Organ | Tissue | Adj P-value | Log2FC | Malignancy |
| 51735 | RAPGEF6 | AEH-subject1 | Human | Endometrium | AEH | 7.90e-19 | 4.11e-01 | -0.3059 |
| 51735 | RAPGEF6 | AEH-subject2 | Human | Endometrium | AEH | 8.80e-04 | 2.51e-01 | -0.2525 |
| 51735 | RAPGEF6 | AEH-subject3 | Human | Endometrium | AEH | 8.88e-06 | 2.88e-01 | -0.2576 |
| 51735 | RAPGEF6 | AEH-subject4 | Human | Endometrium | AEH | 1.24e-09 | 3.81e-01 | -0.2657 |
| 51735 | RAPGEF6 | AEH-subject5 | Human | Endometrium | AEH | 1.06e-19 | 5.40e-01 | -0.2953 |
| 51735 | RAPGEF6 | EEC-subject1 | Human | Endometrium | EEC | 1.44e-24 | 5.73e-01 | -0.2682 |
| 51735 | RAPGEF6 | EEC-subject2 | Human | Endometrium | EEC | 2.71e-14 | 3.88e-01 | -0.2607 |
| 51735 | RAPGEF6 | EEC-subject3 | Human | Endometrium | EEC | 1.71e-04 | 2.45e-01 | -0.2525 |
| 51735 | RAPGEF6 | EEC-subject4 | Human | Endometrium | EEC | 6.85e-10 | 3.30e-01 | -0.2571 |
| 51735 | RAPGEF6 | EEC-subject5 | Human | Endometrium | EEC | 3.23e-17 | 4.64e-01 | -0.249 |
| 51735 | RAPGEF6 | LZE2T | Human | Esophagus | ESCC | 2.26e-02 | 3.98e-01 | 0.082 |
| 51735 | RAPGEF6 | LZE4T | Human | Esophagus | ESCC | 1.36e-05 | 3.09e-01 | 0.0811 |
| 51735 | RAPGEF6 | LZE7T | Human | Esophagus | ESCC | 8.89e-03 | 3.00e-01 | 0.0667 |
| 51735 | RAPGEF6 | LZE8T | Human | Esophagus | ESCC | 6.75e-04 | 2.16e-01 | 0.067 |
| 51735 | RAPGEF6 | LZE22D1 | Human | Esophagus | HGIN | 1.09e-02 | 1.64e-01 | 0.0595 |
| 51735 | RAPGEF6 | LZE22T | Human | Esophagus | ESCC | 1.28e-02 | 2.05e-01 | 0.068 |
| 51735 | RAPGEF6 | LZE24T | Human | Esophagus | ESCC | 9.31e-15 | 3.56e-01 | 0.0596 |
| 51735 | RAPGEF6 | LZE6T | Human | Esophagus | ESCC | 2.23e-03 | 1.87e-01 | 0.0845 |
| 51735 | RAPGEF6 | P2T-E | Human | Esophagus | ESCC | 1.04e-15 | 2.87e-01 | 0.1177 |
| 51735 | RAPGEF6 | P4T-E | Human | Esophagus | ESCC | 3.34e-09 | 1.12e-01 | 0.1323 |
| Page: 1 2 3 4 5 |
| Tissue | Expression Dynamics | Abbreviation |
| Endometrium | 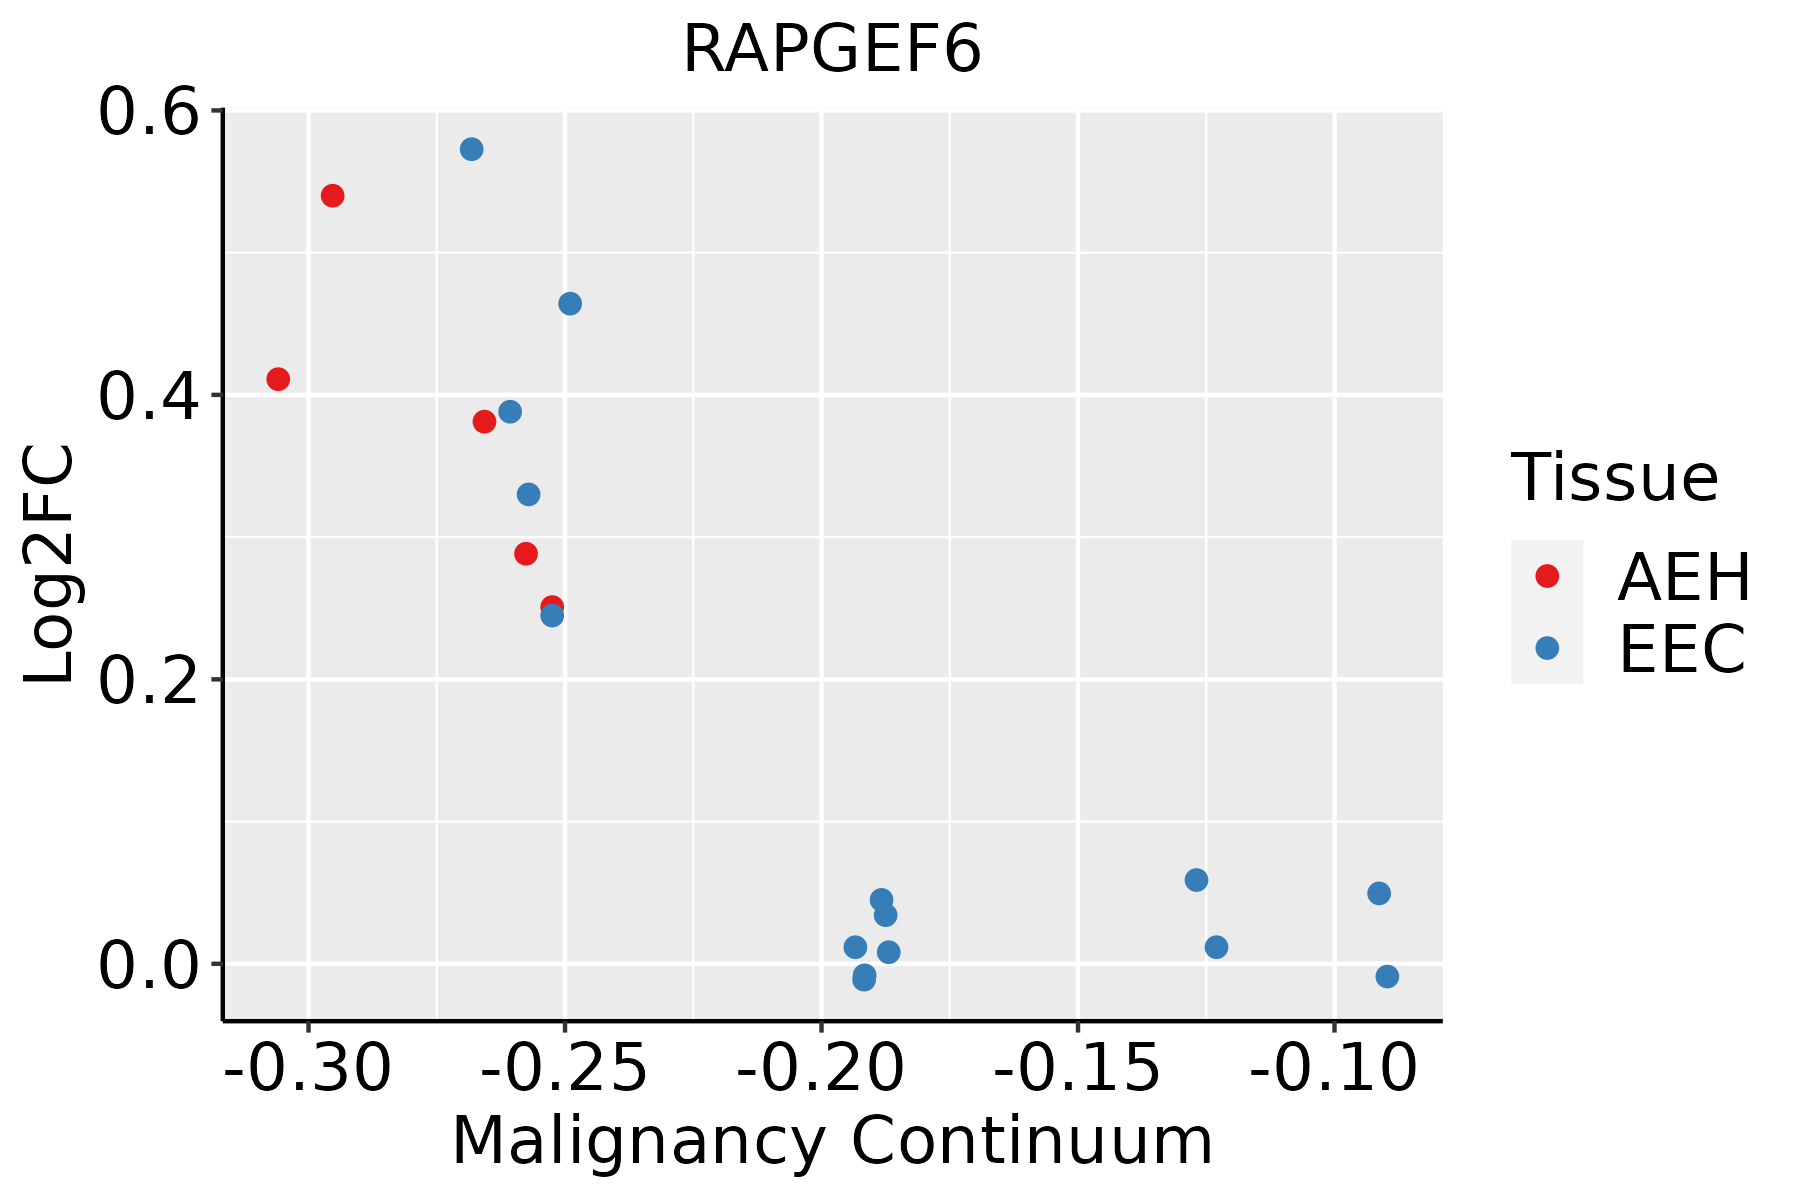 | AEH: Atypical endometrial hyperplasia |
| EEC: Endometrioid Cancer | ||
| Esophagus |  | ESCC: Esophageal squamous cell carcinoma |
| HGIN: High-grade intraepithelial neoplasias | ||
| LGIN: Low-grade intraepithelial neoplasias | ||
| Lung | 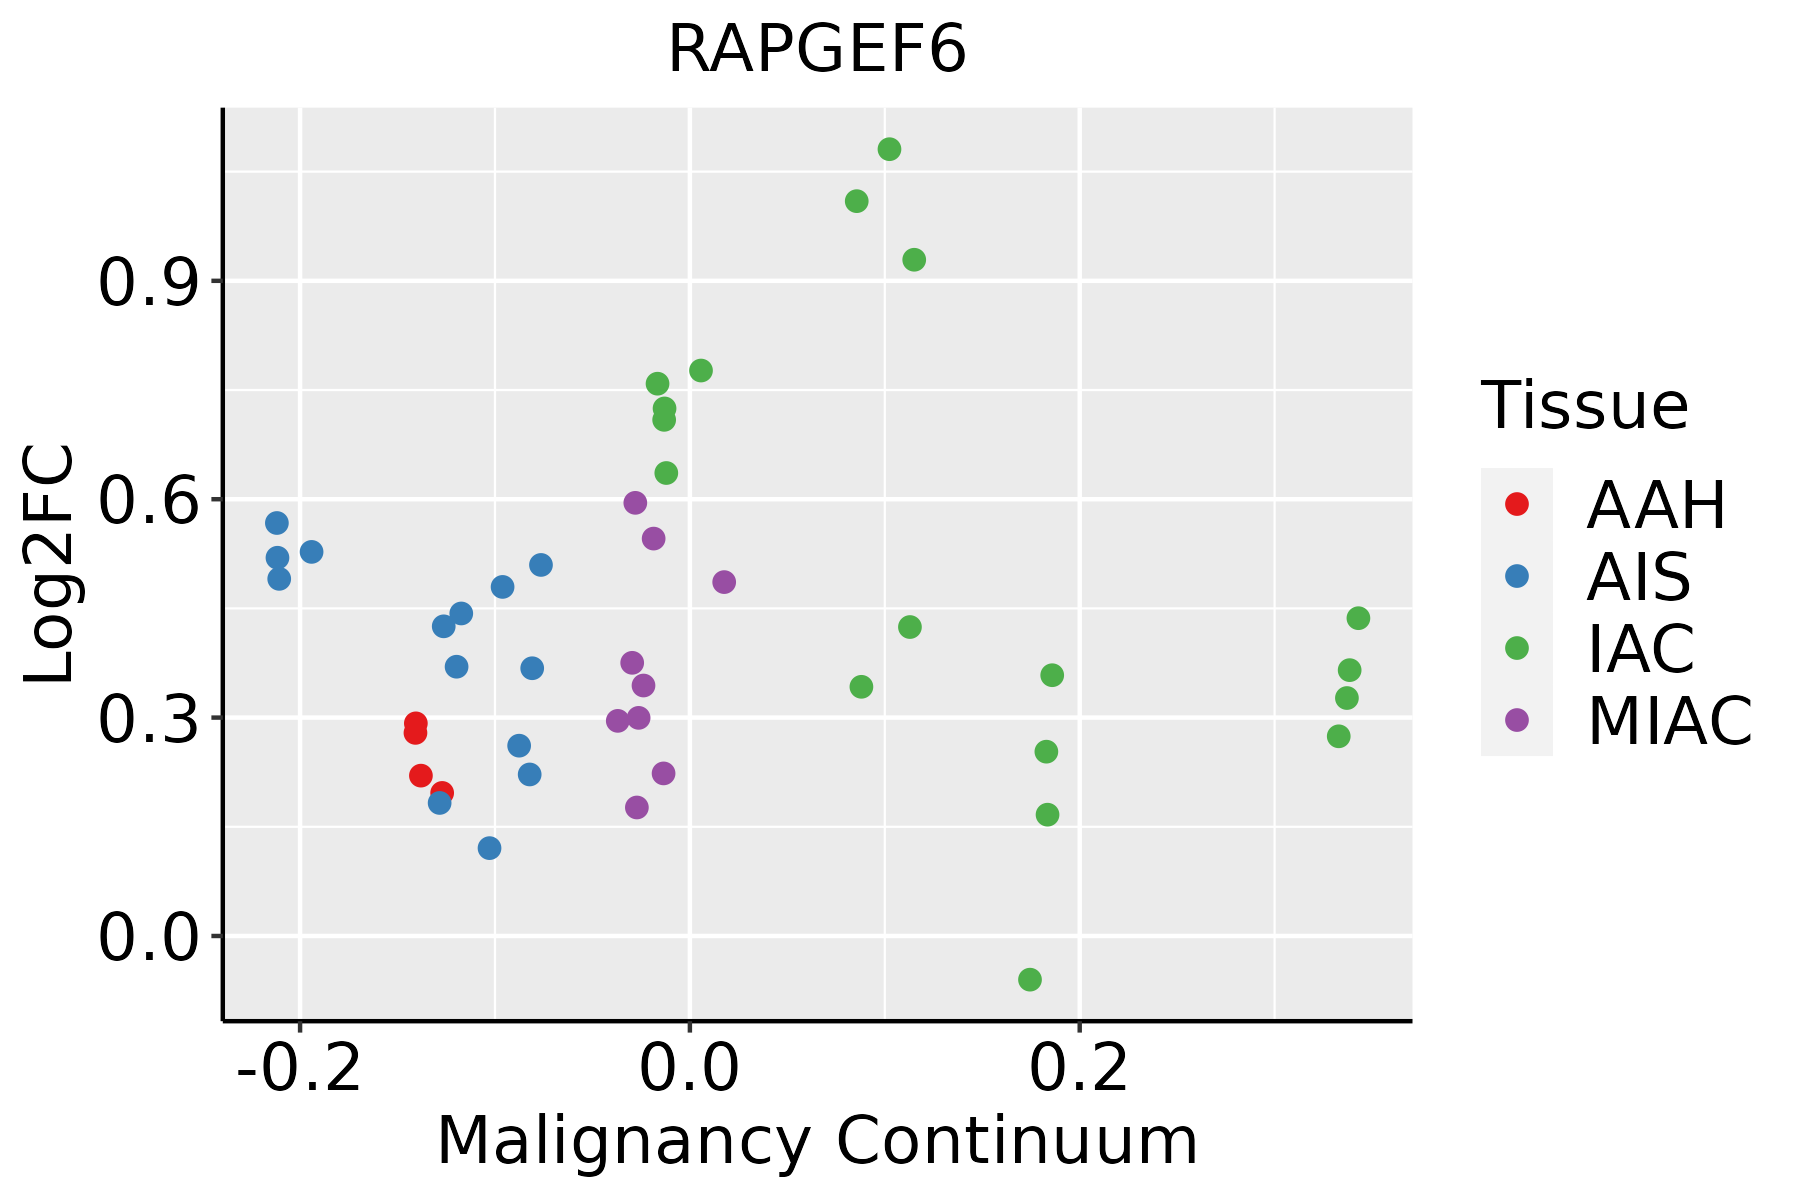 | AAH: Atypical adenomatous hyperplasia |
| AIS: Adenocarcinoma in situ | ||
| IAC: Invasive lung adenocarcinoma | ||
| MIA: Minimally invasive adenocarcinoma | ||
| Prostate | 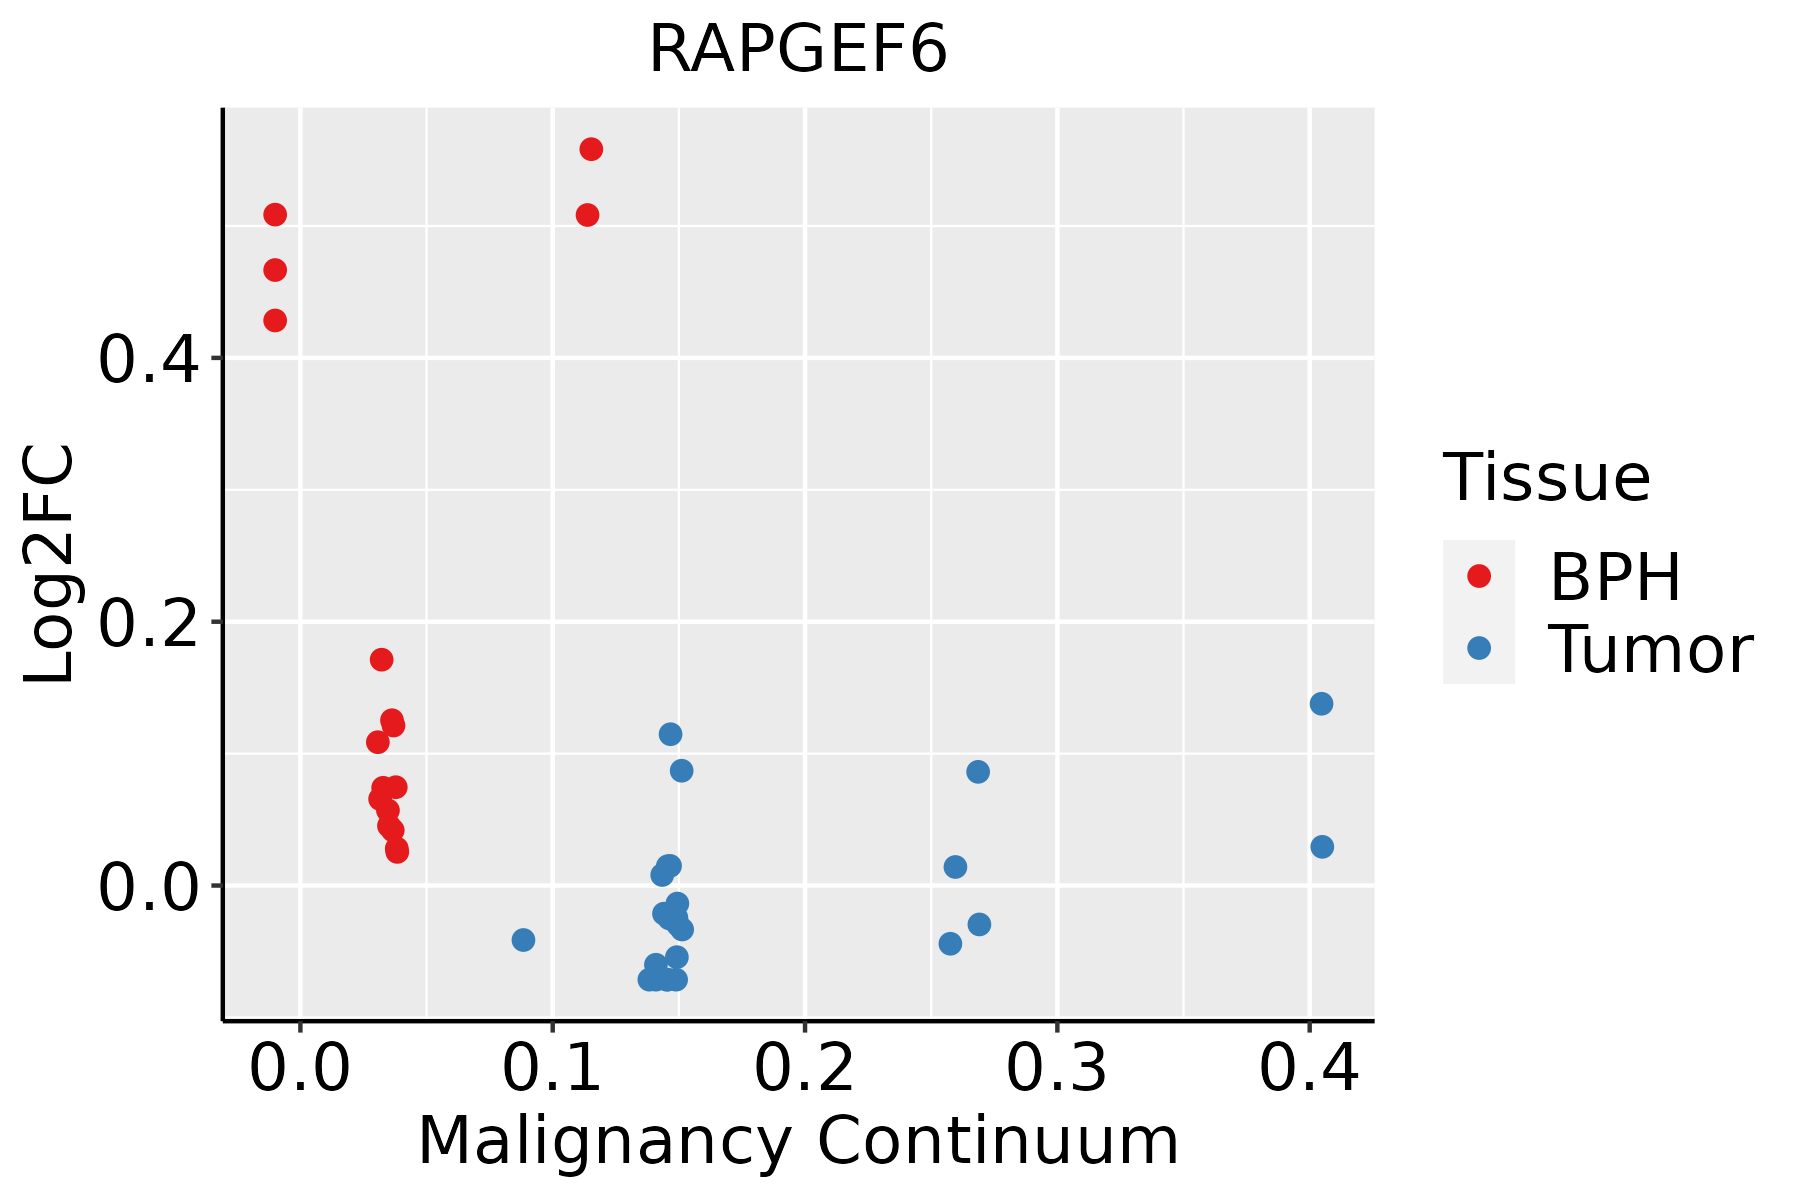 | BPH: Benign Prostatic Hyperplasia |
| ∗log2FC in expression of this searched gene in stem-like cells from each diseased tissue sample relative to stem-like cells in normal samples in each tissue plotted against the malignancy continuum. Samples are colored based on if they are from different disease stage. |
Top |
Malignant transformation related pathway analysis |
| Find out the enriched GO biological processes and KEGG pathways involved in transition from healthy to precancer to cancer |
| Tissue | Disease Stage | Enriched GO biological Processes |
| Colorectum | AD |  |
| Colorectum | SER |  |
| Colorectum | MSS |  |
| Colorectum | MSI-H |  |
| Colorectum | FAP |  |
| ∗Top 15 enriched GO BP terms are showed in the bar plot of each disease state in each tissue. Each row represents a significant GO biological process which is colored according to the -log10(p.adjust). |
| Page: 1 2 3 4 5 6 7 8 9 |
| GO ID | Tissue | Disease Stage | Description | Gene Ratio | Bg Ratio | pvalue | p.adjust | Count |
| GO:007265914 | Endometrium | AEH | protein localization to plasma membrane | 63/2100 | 284/18723 | 7.58e-08 | 3.92e-06 | 63 |
| GO:19907789 | Endometrium | AEH | protein localization to cell periphery | 68/2100 | 333/18723 | 6.38e-07 | 2.38e-05 | 68 |
| GO:00430878 | Endometrium | AEH | regulation of GTPase activity | 66/2100 | 348/18723 | 1.26e-05 | 2.77e-04 | 66 |
| GO:00072657 | Endometrium | AEH | Ras protein signal transduction | 63/2100 | 337/18723 | 3.09e-05 | 5.66e-04 | 63 |
| GO:00435477 | Endometrium | AEH | positive regulation of GTPase activity | 48/2100 | 255/18723 | 2.18e-04 | 2.67e-03 | 48 |
| GO:007265915 | Endometrium | EEC | protein localization to plasma membrane | 64/2168 | 284/18723 | 1.05e-07 | 5.05e-06 | 64 |
| GO:199077814 | Endometrium | EEC | protein localization to cell periphery | 69/2168 | 333/18723 | 9.71e-07 | 3.31e-05 | 69 |
| GO:004308712 | Endometrium | EEC | regulation of GTPase activity | 67/2168 | 348/18723 | 1.84e-05 | 3.43e-04 | 67 |
| GO:000726513 | Endometrium | EEC | Ras protein signal transduction | 64/2168 | 337/18723 | 4.31e-05 | 7.10e-04 | 64 |
| GO:004354712 | Endometrium | EEC | positive regulation of GTPase activity | 50/2168 | 255/18723 | 1.26e-04 | 1.66e-03 | 50 |
| GO:007265920 | Esophagus | HGIN | protein localization to plasma membrane | 66/2587 | 284/18723 | 1.11e-05 | 3.18e-04 | 66 |
| GO:199077818 | Esophagus | HGIN | protein localization to cell periphery | 71/2587 | 333/18723 | 1.05e-04 | 2.24e-03 | 71 |
| GO:0072659110 | Esophagus | ESCC | protein localization to plasma membrane | 193/8552 | 284/18723 | 1.95e-14 | 1.03e-12 | 193 |
| GO:199077819 | Esophagus | ESCC | protein localization to cell periphery | 217/8552 | 333/18723 | 4.08e-13 | 1.88e-11 | 217 |
| GO:000726510 | Esophagus | ESCC | Ras protein signal transduction | 201/8552 | 337/18723 | 1.44e-07 | 2.30e-06 | 201 |
| GO:00300339 | Esophagus | ESCC | microvillus assembly | 13/8552 | 16/18723 | 4.05e-03 | 1.62e-02 | 13 |
| GO:004308715 | Esophagus | ESCC | regulation of GTPase activity | 183/8552 | 348/18723 | 5.34e-03 | 2.00e-02 | 183 |
| GO:00726598 | Lung | IAC | protein localization to plasma membrane | 60/2061 | 284/18723 | 4.74e-07 | 3.10e-05 | 60 |
| GO:19907787 | Lung | IAC | protein localization to cell periphery | 66/2061 | 333/18723 | 1.44e-06 | 7.22e-05 | 66 |
| GO:00430876 | Lung | IAC | regulation of GTPase activity | 67/2061 | 348/18723 | 3.43e-06 | 1.44e-04 | 67 |
| Page: 1 2 |
| Pathway ID | Tissue | Disease Stage | Description | Gene Ratio | Bg Ratio | pvalue | p.adjust | qvalue | Count |
| hsa0453026 | Endometrium | AEH | Tight junction | 54/1197 | 169/8465 | 1.99e-09 | 3.80e-08 | 2.78e-08 | 54 |
| hsa0401514 | Endometrium | AEH | Rap1 signaling pathway | 49/1197 | 210/8465 | 2.03e-04 | 1.78e-03 | 1.30e-03 | 49 |
| hsa04530112 | Endometrium | AEH | Tight junction | 54/1197 | 169/8465 | 1.99e-09 | 3.80e-08 | 2.78e-08 | 54 |
| hsa0401515 | Endometrium | AEH | Rap1 signaling pathway | 49/1197 | 210/8465 | 2.03e-04 | 1.78e-03 | 1.30e-03 | 49 |
| hsa0453027 | Endometrium | EEC | Tight junction | 54/1237 | 169/8465 | 6.56e-09 | 1.27e-07 | 9.46e-08 | 54 |
| hsa0401522 | Endometrium | EEC | Rap1 signaling pathway | 49/1237 | 210/8465 | 4.45e-04 | 3.47e-03 | 2.59e-03 | 49 |
| hsa0453036 | Endometrium | EEC | Tight junction | 54/1237 | 169/8465 | 6.56e-09 | 1.27e-07 | 9.46e-08 | 54 |
| hsa0401532 | Endometrium | EEC | Rap1 signaling pathway | 49/1237 | 210/8465 | 4.45e-04 | 3.47e-03 | 2.59e-03 | 49 |
| hsa0453039 | Esophagus | HGIN | Tight junction | 40/1383 | 169/8465 | 8.18e-03 | 4.71e-02 | 3.74e-02 | 40 |
| hsa04530115 | Esophagus | HGIN | Tight junction | 40/1383 | 169/8465 | 8.18e-03 | 4.71e-02 | 3.74e-02 | 40 |
| hsa04530211 | Esophagus | ESCC | Tight junction | 105/4205 | 169/8465 | 6.73e-04 | 2.23e-03 | 1.14e-03 | 105 |
| hsa04530310 | Esophagus | ESCC | Tight junction | 105/4205 | 169/8465 | 6.73e-04 | 2.23e-03 | 1.14e-03 | 105 |
| hsa0453016 | Lung | IAC | Tight junction | 43/1053 | 169/8465 | 2.44e-06 | 8.81e-05 | 5.85e-05 | 43 |
| hsa0401510 | Lung | IAC | Rap1 signaling pathway | 41/1053 | 210/8465 | 2.01e-03 | 1.07e-02 | 7.10e-03 | 41 |
| hsa0453017 | Lung | IAC | Tight junction | 43/1053 | 169/8465 | 2.44e-06 | 8.81e-05 | 5.85e-05 | 43 |
| hsa0401511 | Lung | IAC | Rap1 signaling pathway | 41/1053 | 210/8465 | 2.01e-03 | 1.07e-02 | 7.10e-03 | 41 |
| hsa0453023 | Lung | AIS | Tight junction | 46/961 | 169/8465 | 7.79e-09 | 4.33e-07 | 2.77e-07 | 46 |
| hsa0401521 | Lung | AIS | Rap1 signaling pathway | 41/961 | 210/8465 | 3.23e-04 | 3.38e-03 | 2.16e-03 | 41 |
| hsa0453033 | Lung | AIS | Tight junction | 46/961 | 169/8465 | 7.79e-09 | 4.33e-07 | 2.77e-07 | 46 |
| hsa0401531 | Lung | AIS | Rap1 signaling pathway | 41/961 | 210/8465 | 3.23e-04 | 3.38e-03 | 2.16e-03 | 41 |
| Page: 1 2 |
Top |
Cell-cell communication analysis |
| Identification of potential cell-cell interactions between two cell types and their ligand-receptor pairs for different disease states |
| Ligand | Receptor | LRpair | Pathway | Tissue | Disease Stage |
| Page: 1 |
Top |
Single-cell gene regulatory network inference analysis |
| Find out the significant the regulons (TFs) and the target genes of each regulon across cell types for different disease states |
| TF | Cell Type | Tissue | Disease Stage | Target Gene | RSS | Regulon Activity |
| ∗The dot plots of a searched regulon are shown for all cell subpopulations in each disease state of each tissue based on the regulon specific score inferred using pySCENIC and by calculating the average expression. |
| Page: 1 |
Top |
Somatic mutation of malignant transformation related genes |
| Annotation of somatic variants for genes involved in malignant transformation |
| Hugo Symbol | Variant Class | Variant Classification | dbSNP RS | HGVSc | HGVSp | HGVSp Short | SWISSPROT | BIOTYPE | SIFT | PolyPhen | Tumor Sample Barcode | Tissue | Histology | Sex | Age | Stage | Therapy Types | Drugs | Outcome |
| RAPGEF6 | SNV | Missense_Mutation | c.3202N>C | p.Lys1068Gln | p.K1068Q | Q8TEU7 | protein_coding | tolerated(0.21) | benign(0.046) | TCGA-A2-A04R-01 | Breast | breast invasive carcinoma | Female | <65 | I/II | Chemotherapy | taxol | SD | |
| RAPGEF6 | SNV | Missense_Mutation | novel | c.2732C>T | p.Thr911Ile | p.T911I | Q8TEU7 | protein_coding | deleterious(0.01) | possibly_damaging(0.515) | TCGA-A7-A6VY-01 | Breast | breast invasive carcinoma | Female | <65 | I/II | Chemotherapy | cyclophosphamide | CR |
| RAPGEF6 | SNV | Missense_Mutation | novel | c.2237C>T | p.Ser746Leu | p.S746L | Q8TEU7 | protein_coding | tolerated(0.26) | benign(0.018) | TCGA-A8-A08L-01 | Breast | breast invasive carcinoma | Female | >=65 | III/IV | Unknown | Unknown | SD |
| RAPGEF6 | SNV | Missense_Mutation | c.3700G>A | p.Asp1234Asn | p.D1234N | Q8TEU7 | protein_coding | deleterious_low_confidence(0) | probably_damaging(0.928) | TCGA-A8-A09C-01 | Breast | breast invasive carcinoma | Female | >=65 | I/II | Unknown | Unknown | SD | |
| RAPGEF6 | SNV | Missense_Mutation | rs761250497 | c.2629N>T | p.Arg877Cys | p.R877C | Q8TEU7 | protein_coding | tolerated(0.09) | benign(0.055) | TCGA-A8-A09I-01 | Breast | breast invasive carcinoma | Female | >=65 | I/II | Hormone Therapy | anastrozole | SD |
| RAPGEF6 | SNV | Missense_Mutation | c.979N>A | p.Glu327Lys | p.E327K | Q8TEU7 | protein_coding | deleterious(0) | probably_damaging(0.979) | TCGA-AO-A0J9-01 | Breast | breast invasive carcinoma | Female | <65 | III/IV | Chemotherapy | cyclophosphamide | PD | |
| RAPGEF6 | SNV | Missense_Mutation | c.94C>G | p.Leu32Val | p.L32V | Q8TEU7 | protein_coding | deleterious(0.03) | benign(0.338) | TCGA-AR-A1AJ-01 | Breast | breast invasive carcinoma | Female | >=65 | I/II | Unknown | Unknown | SD | |
| RAPGEF6 | SNV | Missense_Mutation | novel | c.1771N>G | p.Phe591Val | p.F591V | Q8TEU7 | protein_coding | tolerated(0.28) | benign(0.005) | TCGA-AR-A2LL-01 | Breast | breast invasive carcinoma | Female | >=65 | I/II | Hormone Therapy | tamoxiphen | SD |
| RAPGEF6 | SNV | Missense_Mutation | c.67G>A | p.Glu23Lys | p.E23K | Q8TEU7 | protein_coding | deleterious(0.02) | benign(0.007) | TCGA-BH-A18M-01 | Breast | breast invasive carcinoma | Female | <65 | III/IV | Unknown | Unknown | SD | |
| RAPGEF6 | SNV | Missense_Mutation | c.563C>G | p.Ser188Cys | p.S188C | Q8TEU7 | protein_coding | deleterious(0) | probably_damaging(0.91) | TCGA-BH-A1FU-01 | Breast | breast invasive carcinoma | Female | <65 | I/II | Unknown | Unknown | PD |
| Page: 1 2 3 4 5 6 7 8 9 10 11 12 13 14 15 16 |
Top |
Related drugs of malignant transformation related genes |
| Identification of chemicals and drugs interact with genes involved in malignant transfromation |
| (DGIdb 4.0) |
| Entrez ID | Symbol | Category | Interaction Types | Drug Claim Name | Drug Name | PMIDs |
| Page: 1 |

Copyright 2023-Present -The University of Texas Health Science Center at Houston |