
|
|||||
|
 | |
| |
| |
| |
| |
| |
|
Gene: RAPGEF2 |
Gene summary for RAPGEF2 |
| Gene information | Species | Human | Gene symbol | RAPGEF2 | Gene ID | 9693 |
| Gene name | Rap guanine nucleotide exchange factor 2 | |
| Gene Alias | CNrasGEF | |
| Cytomap | 4q32.1 | |
| Gene Type | protein-coding | GO ID | GO:0000165 | UniProtAcc | Q9Y4G8 |
Top |
Malignant transformation analysis |
| Identification of the aberrant gene expression in precancerous and cancerous lesions by comparing the gene expression of stem-like cells in diseased tissues with normal stem cells |
| Entrez ID | Symbol | Replicates | Species | Organ | Tissue | Adj P-value | Log2FC | Malignancy |
| 9693 | RAPGEF2 | CCI_1 | Human | Cervix | CC | 7.12e-04 | 9.88e-01 | 0.528 |
| 9693 | RAPGEF2 | CCI_2 | Human | Cervix | CC | 2.02e-08 | 1.21e+00 | 0.5249 |
| 9693 | RAPGEF2 | CCI_3 | Human | Cervix | CC | 1.12e-05 | 6.73e-01 | 0.516 |
| 9693 | RAPGEF2 | Tumor | Human | Cervix | CC | 4.71e-04 | -1.49e-01 | 0.1241 |
| 9693 | RAPGEF2 | sample3 | Human | Cervix | CC | 6.56e-03 | -1.26e-01 | 0.1387 |
| 9693 | RAPGEF2 | HTA11_3410_2000001011 | Human | Colorectum | AD | 1.96e-21 | -6.71e-01 | 0.0155 |
| 9693 | RAPGEF2 | HTA11_3361_2000001011 | Human | Colorectum | AD | 1.57e-03 | -4.06e-01 | -0.1207 |
| 9693 | RAPGEF2 | HTA11_83_2000001011 | Human | Colorectum | SER | 2.02e-03 | -4.80e-01 | -0.1526 |
| 9693 | RAPGEF2 | HTA11_696_2000001011 | Human | Colorectum | AD | 4.73e-15 | -3.81e-01 | -0.1464 |
| 9693 | RAPGEF2 | HTA11_866_2000001011 | Human | Colorectum | AD | 8.92e-13 | -4.63e-01 | -0.1001 |
| 9693 | RAPGEF2 | HTA11_5212_2000001011 | Human | Colorectum | AD | 1.20e-03 | -7.29e-01 | -0.2061 |
| 9693 | RAPGEF2 | HTA11_546_2000001011 | Human | Colorectum | AD | 3.01e-03 | -5.38e-01 | -0.0842 |
| 9693 | RAPGEF2 | HTA11_9341_2000001011 | Human | Colorectum | SER | 3.31e-02 | -8.53e-01 | -0.00410000000000005 |
| 9693 | RAPGEF2 | HTA11_7862_2000001011 | Human | Colorectum | AD | 9.90e-03 | -6.11e-01 | -0.0179 |
| 9693 | RAPGEF2 | HTA11_866_3004761011 | Human | Colorectum | AD | 2.35e-07 | -5.33e-01 | 0.096 |
| 9693 | RAPGEF2 | HTA11_8622_2000001021 | Human | Colorectum | SER | 1.79e-02 | -6.32e-01 | 0.0528 |
| 9693 | RAPGEF2 | HTA11_10623_2000001011 | Human | Colorectum | AD | 2.56e-02 | -5.29e-01 | -0.0177 |
| 9693 | RAPGEF2 | HTA11_10711_2000001011 | Human | Colorectum | AD | 2.48e-05 | -5.36e-01 | 0.0338 |
| 9693 | RAPGEF2 | HTA11_7696_3000711011 | Human | Colorectum | AD | 7.94e-13 | -4.94e-01 | 0.0674 |
| 9693 | RAPGEF2 | HTA11_6818_2000001011 | Human | Colorectum | AD | 3.02e-04 | -6.25e-01 | 0.0112 |
| Page: 1 2 3 4 5 6 7 |
| Tissue | Expression Dynamics | Abbreviation |
| Cervix |  | CC: Cervix cancer |
| HSIL_HPV: HPV-infected high-grade squamous intraepithelial lesions | ||
| N_HPV: HPV-infected normal cervix | ||
| Colorectum (GSE201348) |  | FAP: Familial adenomatous polyposis |
| CRC: Colorectal cancer | ||
| Colorectum (HTA11) |  | AD: Adenomas |
| SER: Sessile serrated lesions | ||
| MSI-H: Microsatellite-high colorectal cancer | ||
| MSS: Microsatellite stable colorectal cancer | ||
| Endometrium | 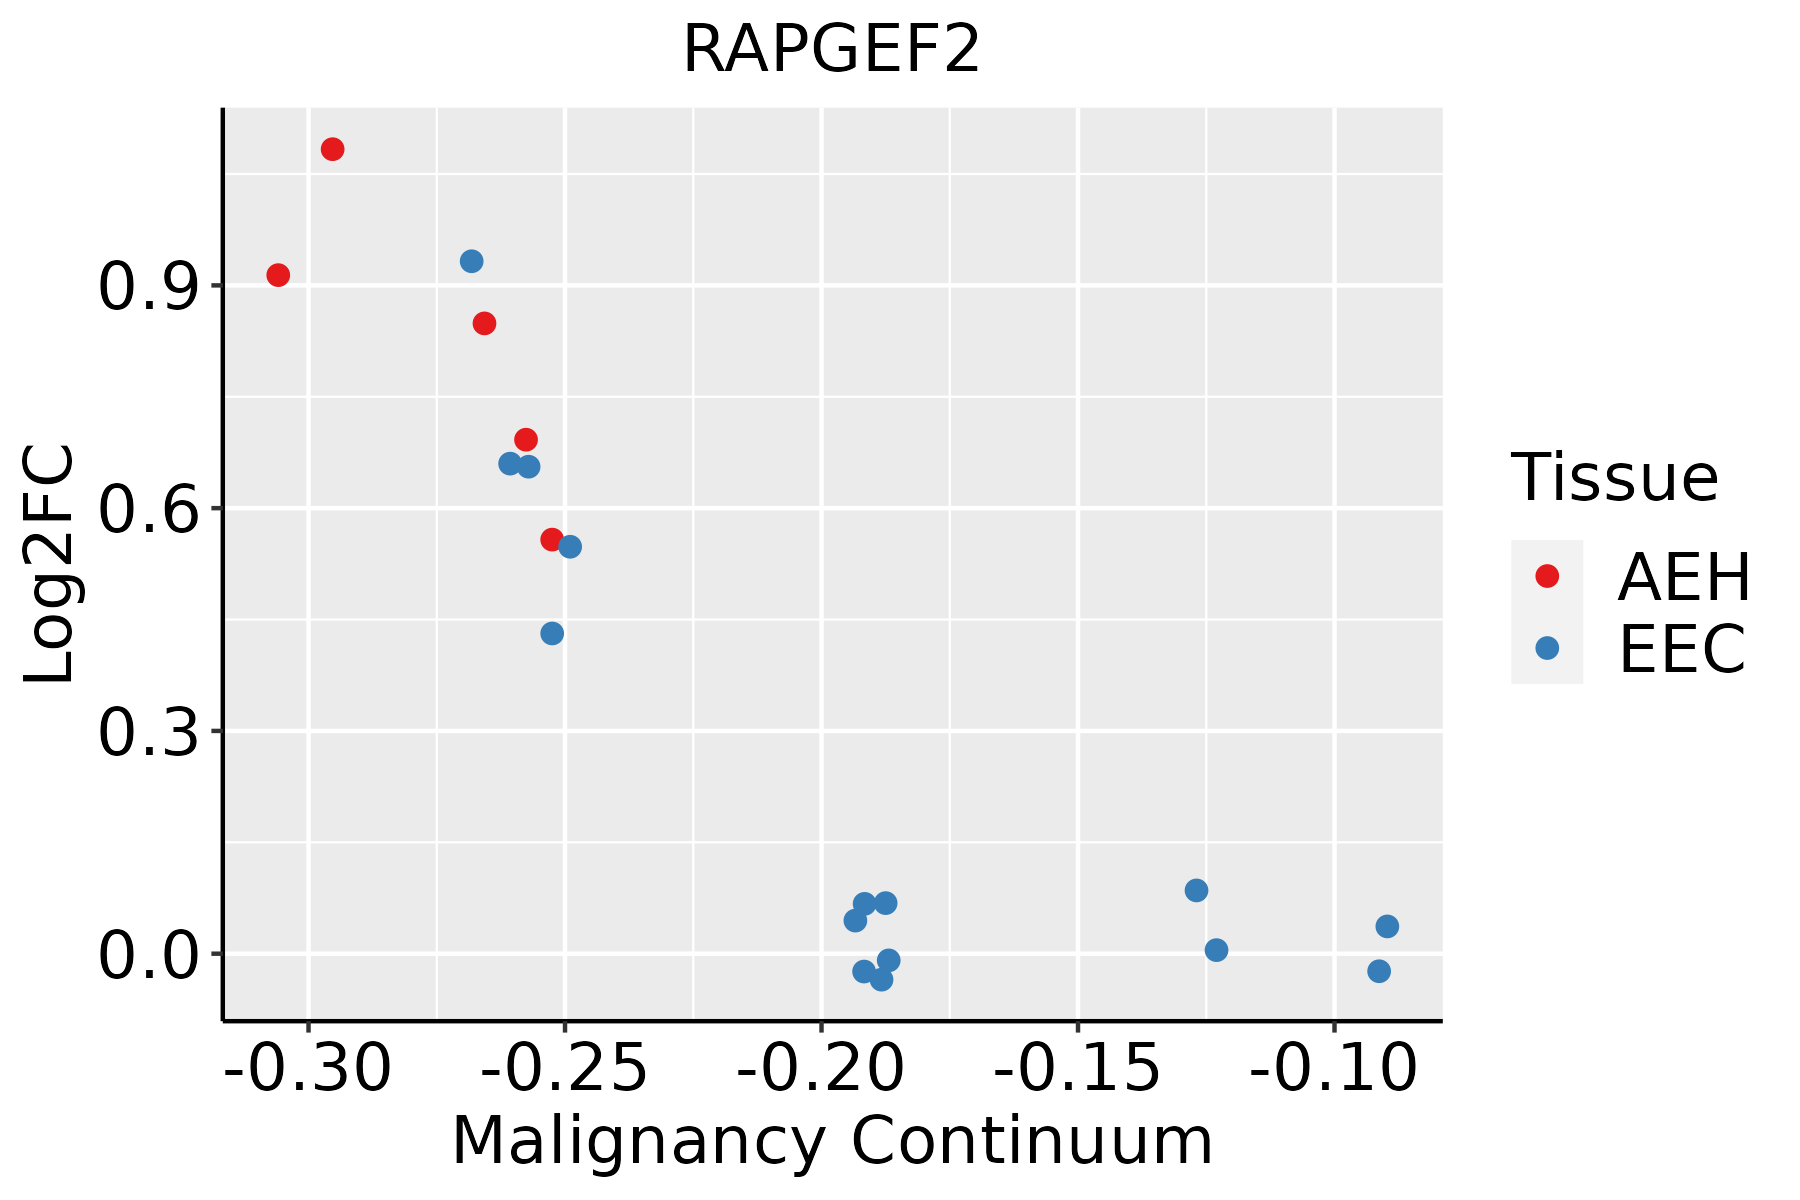 | AEH: Atypical endometrial hyperplasia |
| EEC: Endometrioid Cancer | ||
| Liver | 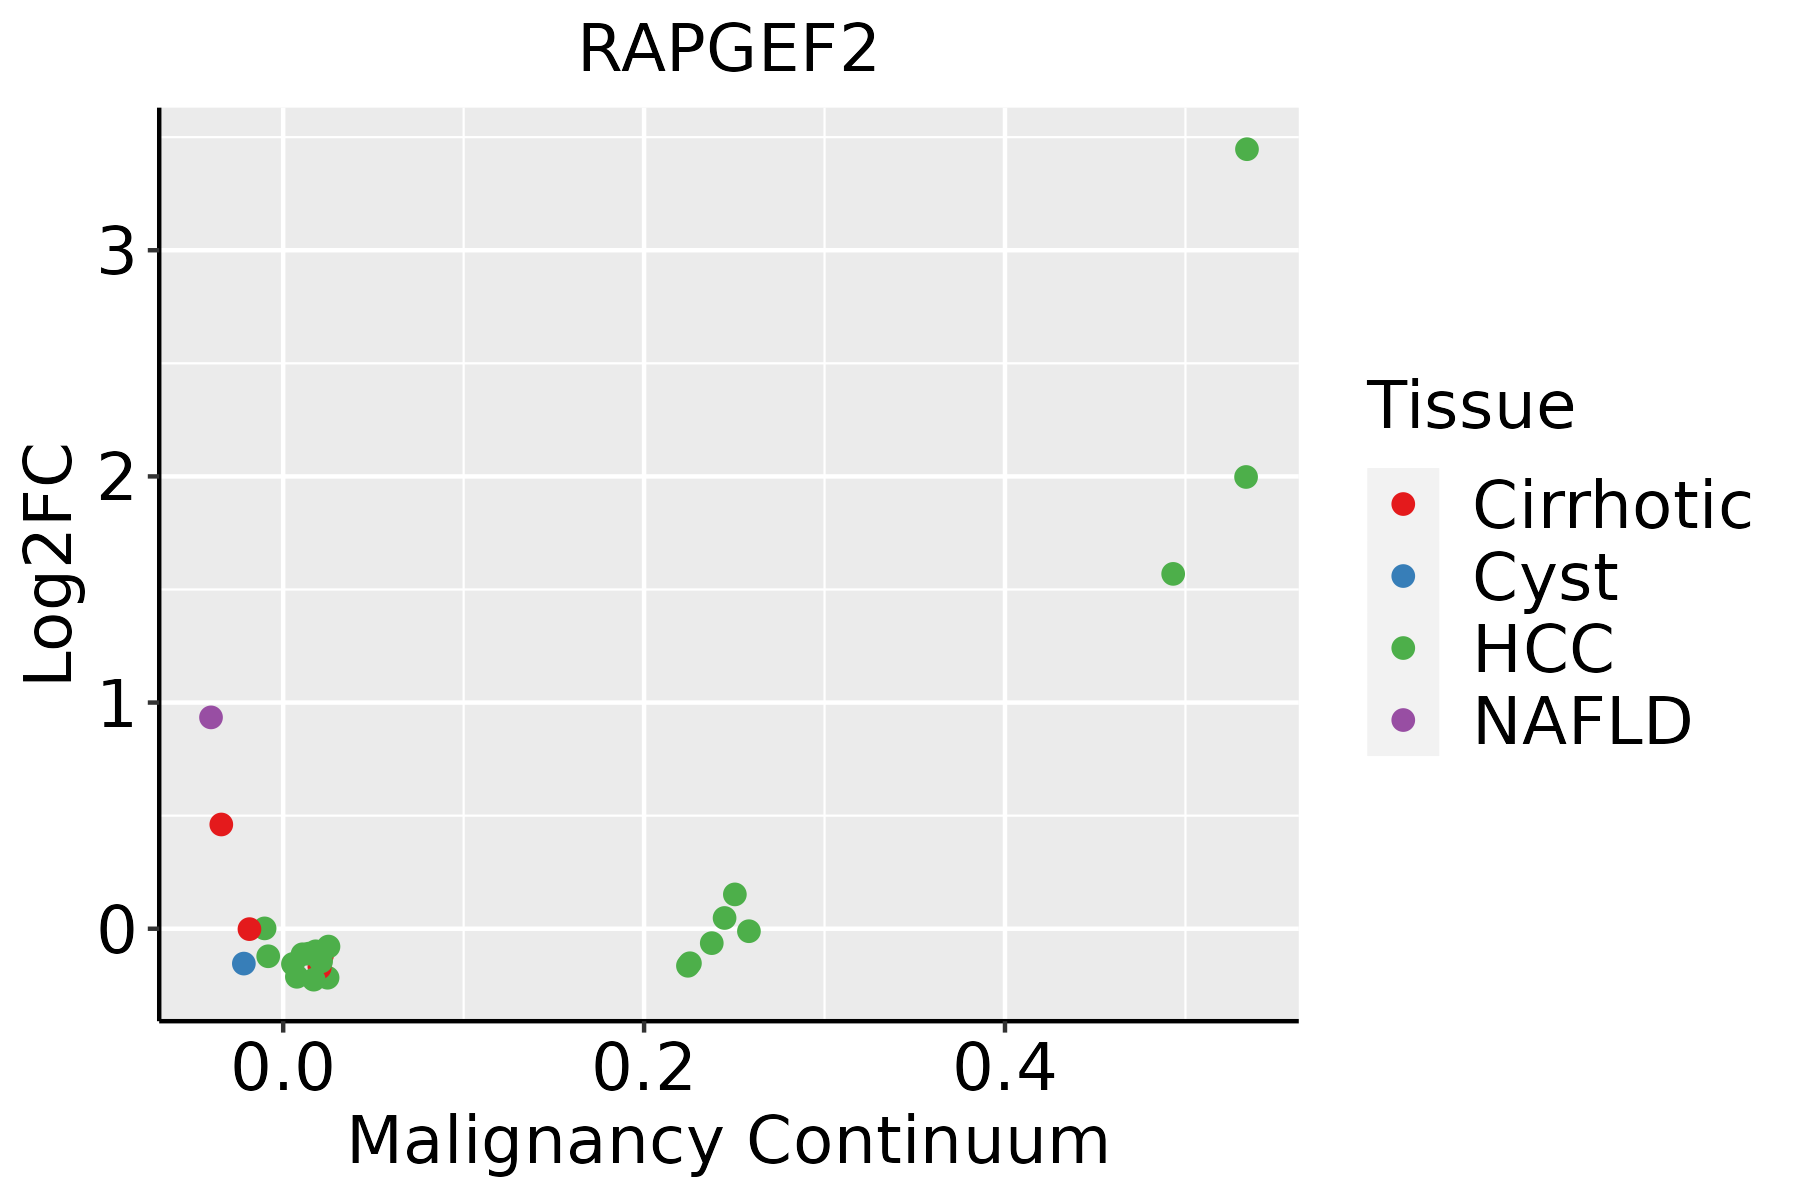 | HCC: Hepatocellular carcinoma |
| NAFLD: Non-alcoholic fatty liver disease | ||
| Lung | 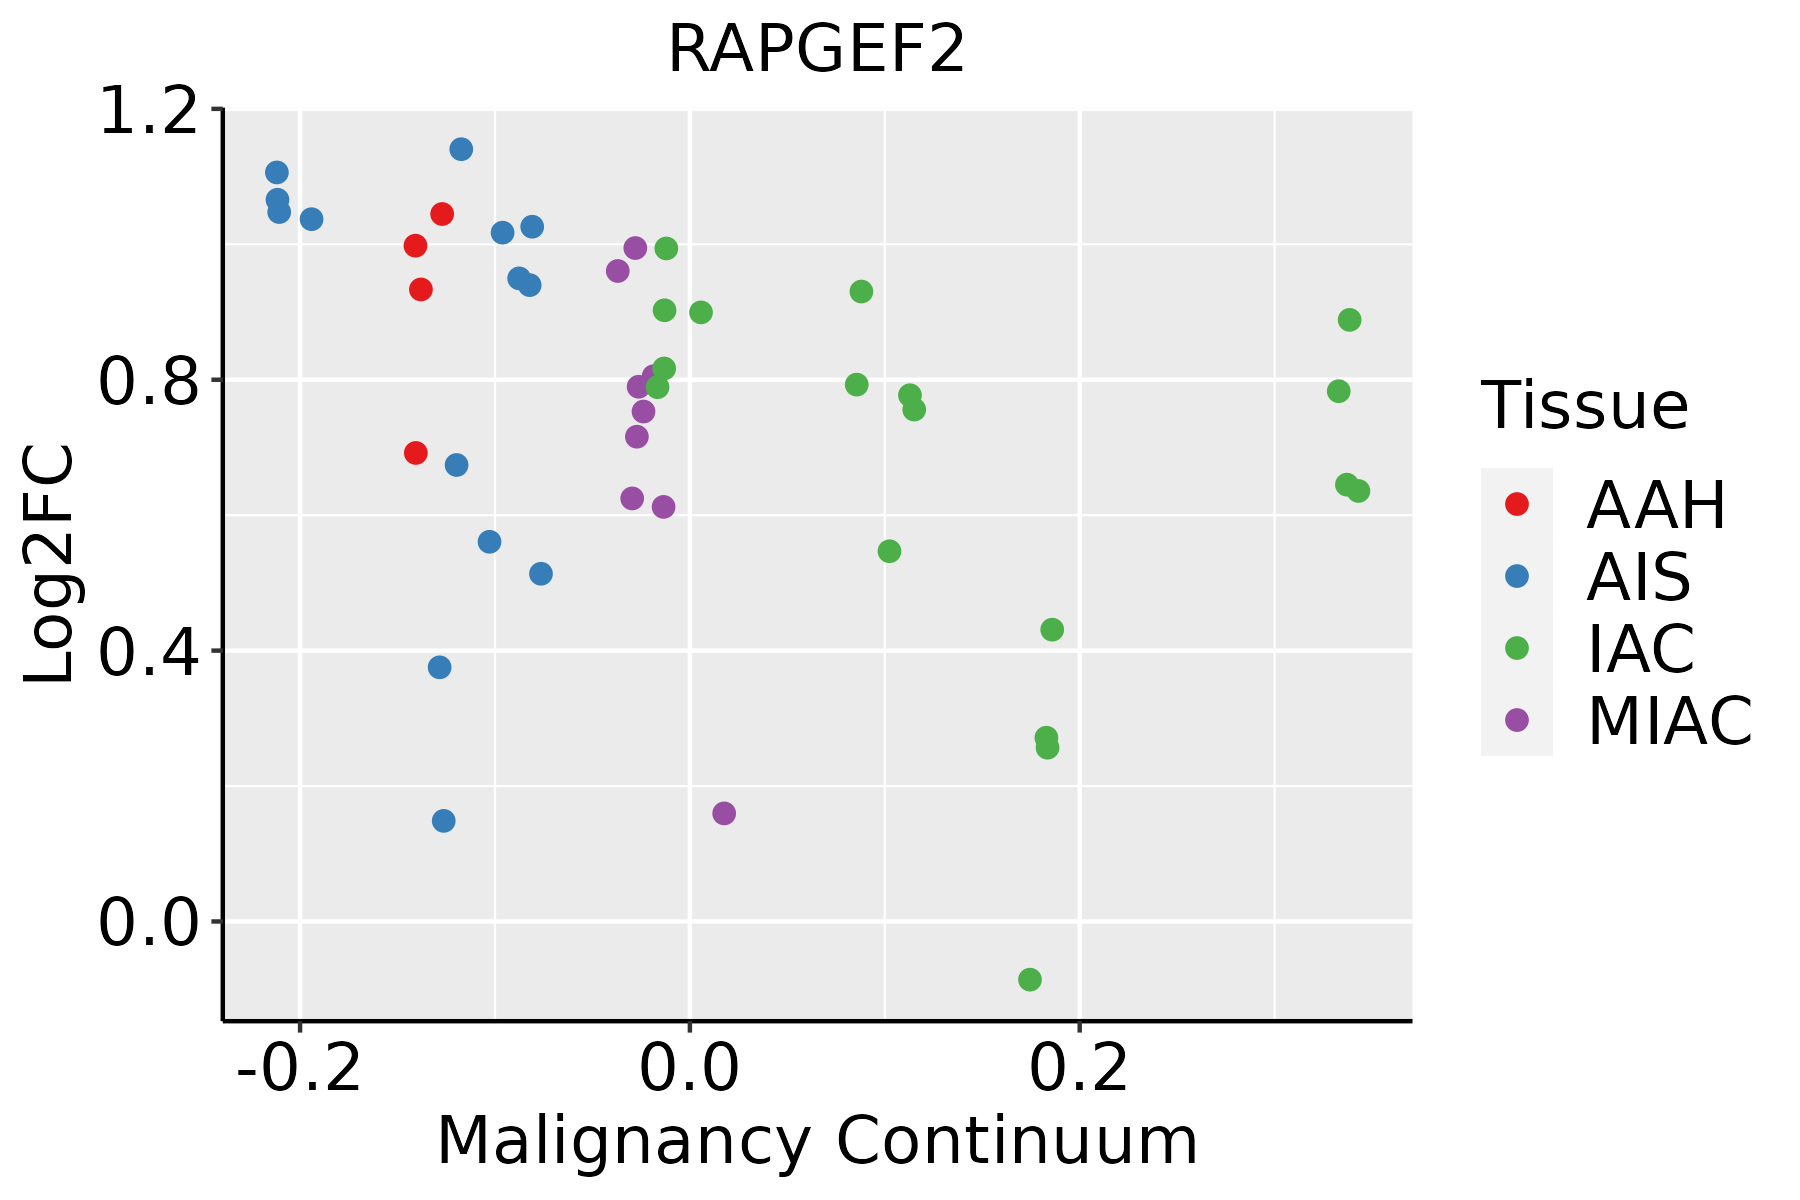 | AAH: Atypical adenomatous hyperplasia |
| AIS: Adenocarcinoma in situ | ||
| IAC: Invasive lung adenocarcinoma | ||
| MIA: Minimally invasive adenocarcinoma | ||
| Oral Cavity | 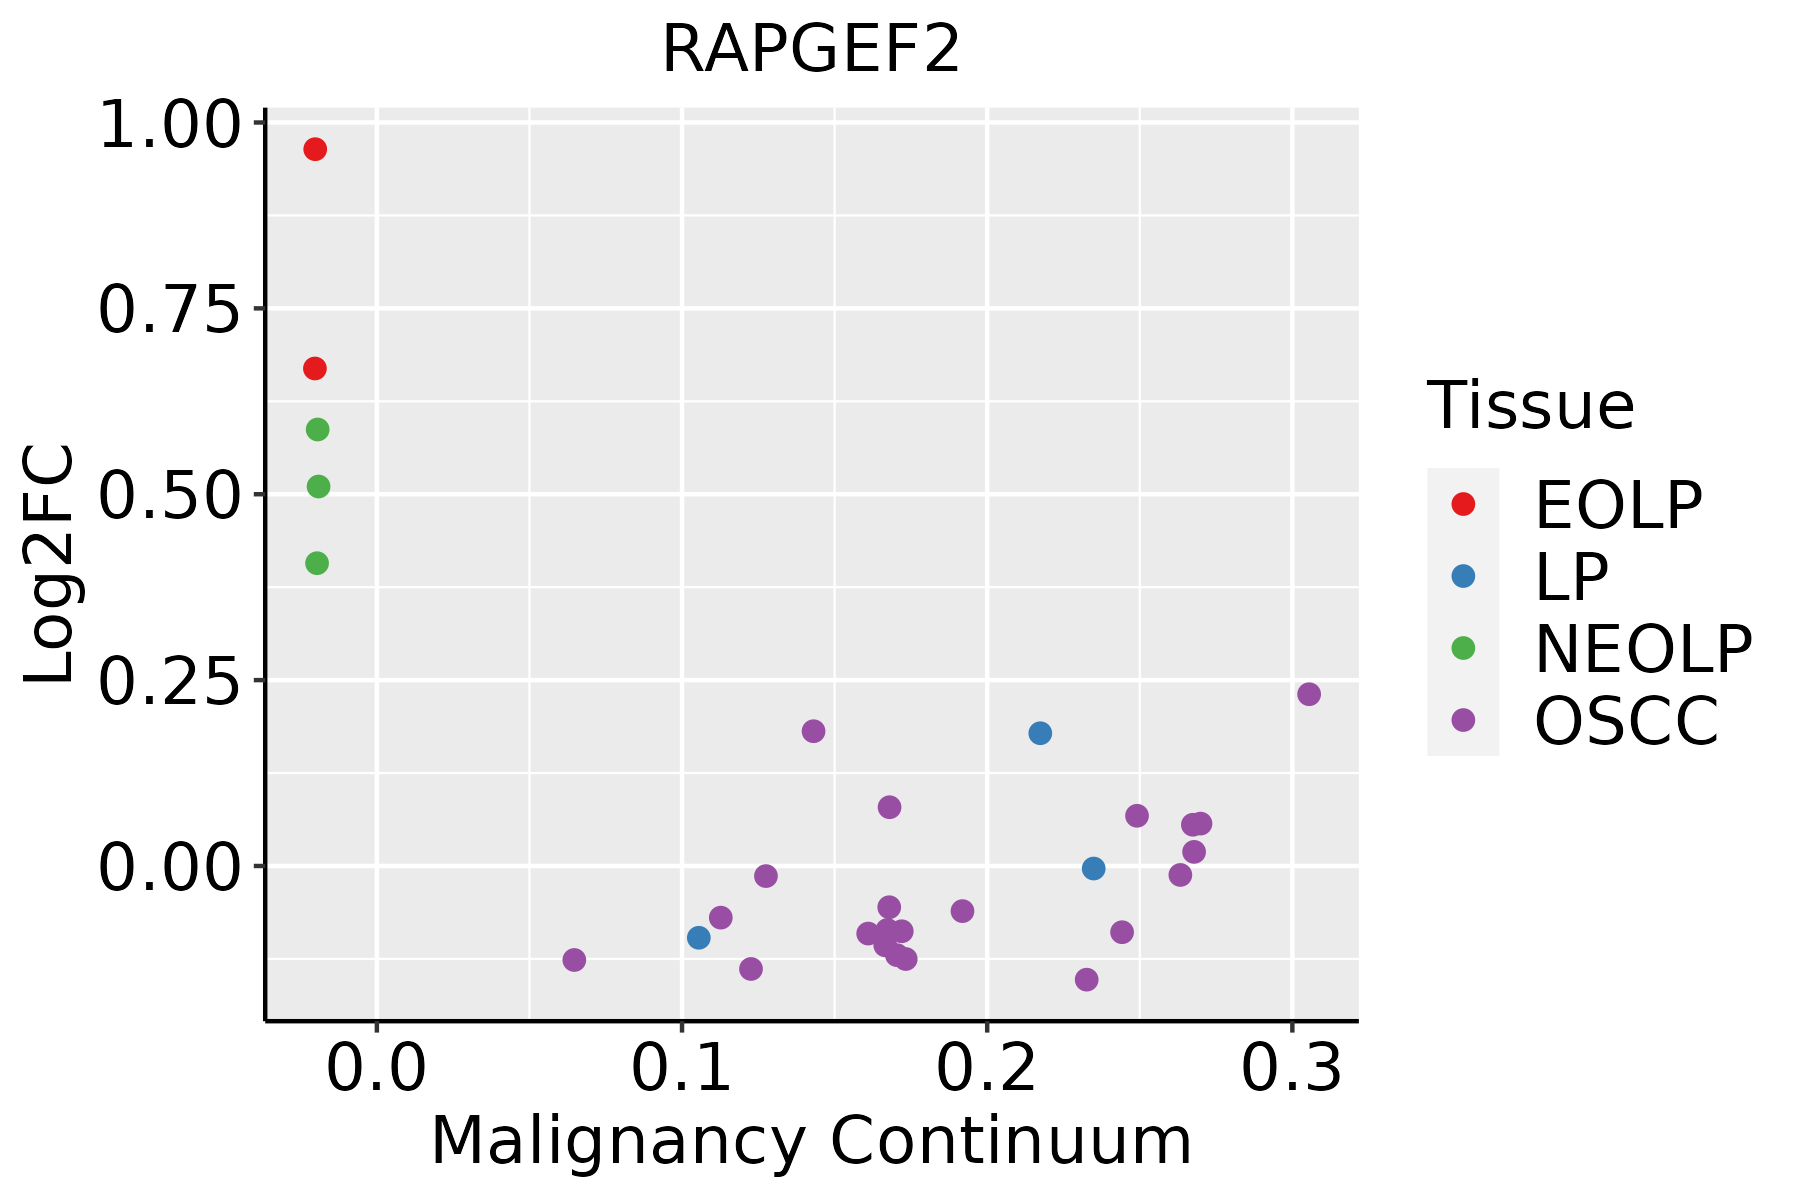 | EOLP: Erosive Oral lichen planus |
| LP: leukoplakia | ||
| NEOLP: Non-erosive oral lichen planus | ||
| OSCC: Oral squamous cell carcinoma | ||
| Prostate |  | BPH: Benign Prostatic Hyperplasia |
| Skin | 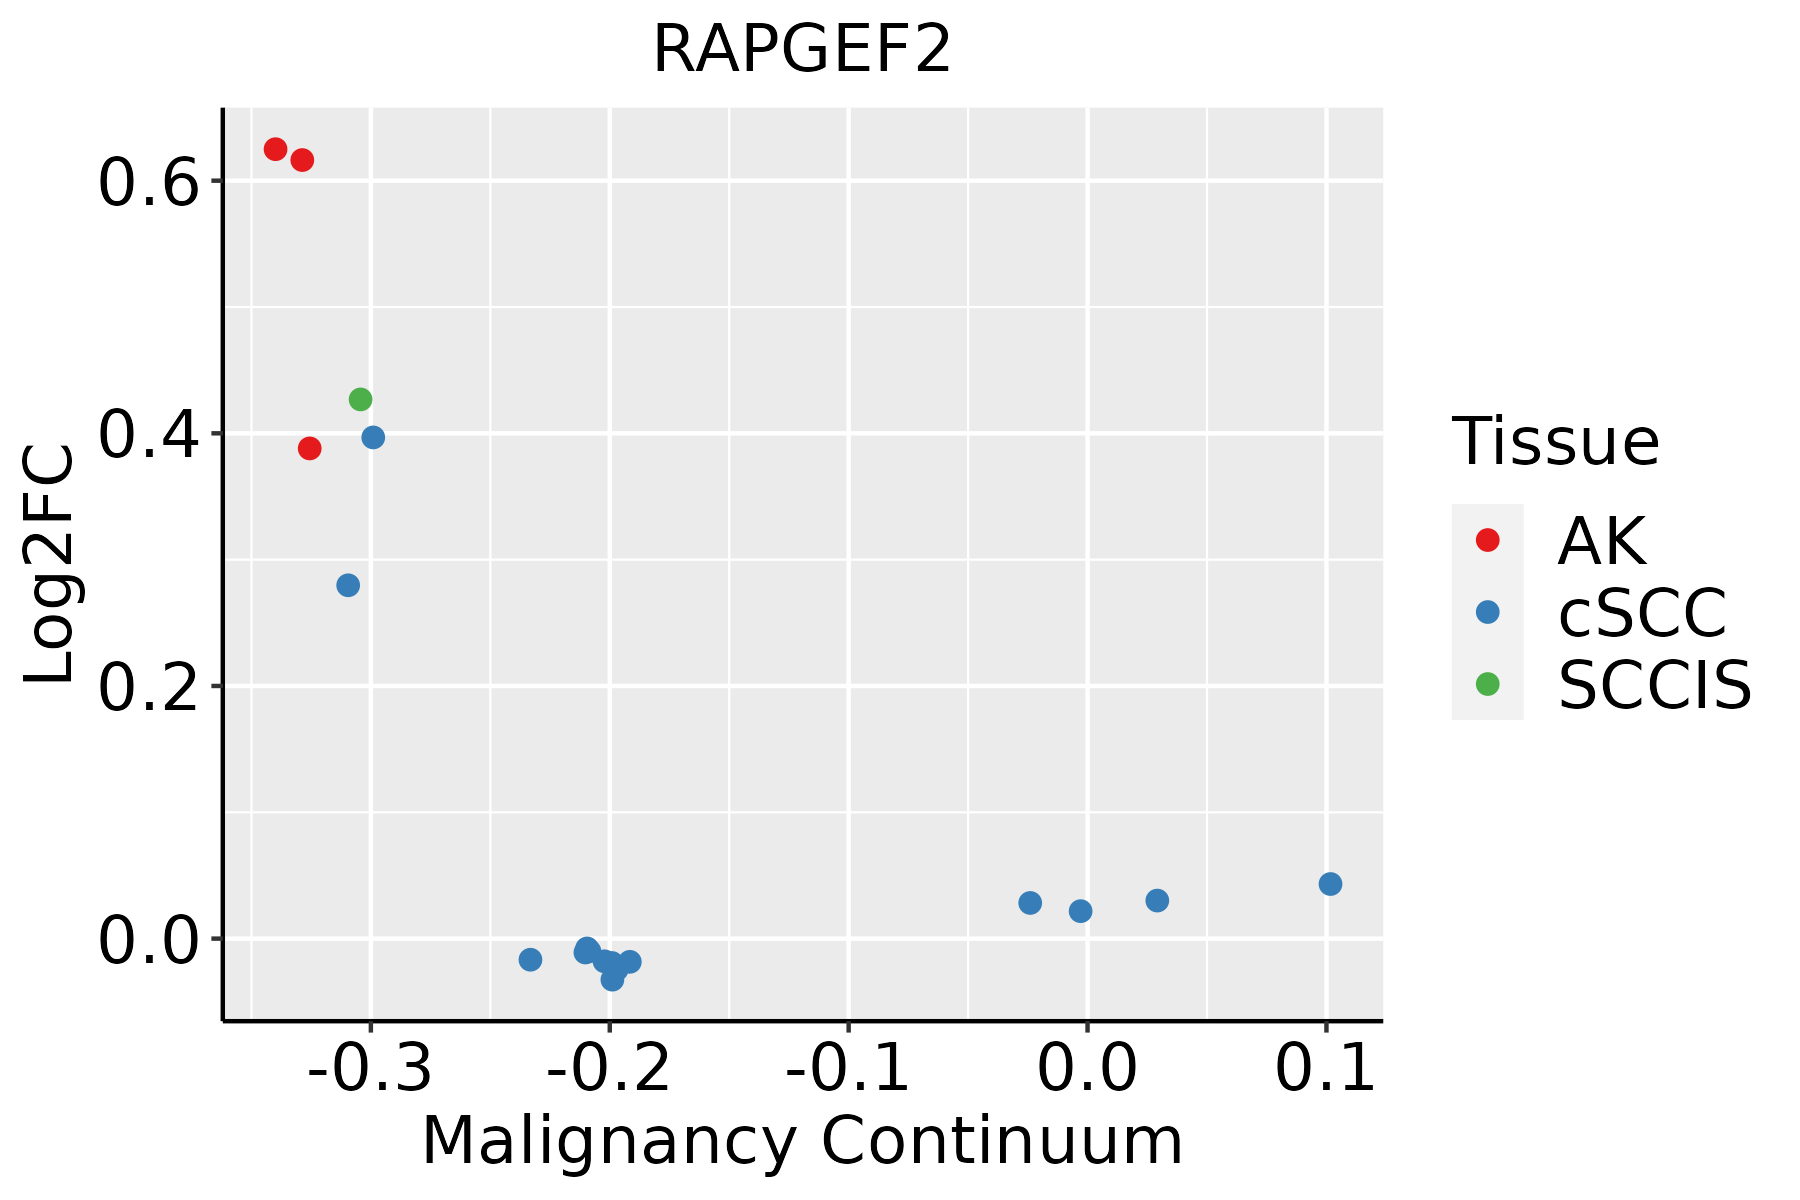 | AK: Actinic keratosis |
| cSCC: Cutaneous squamous cell carcinoma | ||
| SCCIS:squamous cell carcinoma in situ |
| ∗log2FC in expression of this searched gene in stem-like cells from each diseased tissue sample relative to stem-like cells in normal samples in each tissue plotted against the malignancy continuum. Samples are colored based on if they are from different disease stage. |
Top |
Malignant transformation related pathway analysis |
| Find out the enriched GO biological processes and KEGG pathways involved in transition from healthy to precancer to cancer |
| Tissue | Disease Stage | Enriched GO biological Processes |
| Colorectum | AD |  |
| Colorectum | SER |  |
| Colorectum | MSS |  |
| Colorectum | MSI-H |  |
| Colorectum | FAP |  |
| ∗Top 15 enriched GO BP terms are showed in the bar plot of each disease state in each tissue. Each row represents a significant GO biological process which is colored according to the -log10(p.adjust). |
| Page: 1 2 3 4 5 6 7 8 9 |
| GO ID | Tissue | Disease Stage | Description | Gene Ratio | Bg Ratio | pvalue | p.adjust | Count |
| GO:007265910 | Cervix | CC | protein localization to plasma membrane | 73/2311 | 284/18723 | 4.95e-10 | 6.73e-08 | 73 |
| GO:003367410 | Cervix | CC | positive regulation of kinase activity | 101/2311 | 467/18723 | 8.66e-09 | 7.22e-07 | 101 |
| GO:00072656 | Cervix | CC | Ras protein signal transduction | 79/2311 | 337/18723 | 9.49e-09 | 7.77e-07 | 79 |
| GO:19907788 | Cervix | CC | protein localization to cell periphery | 78/2311 | 333/18723 | 1.22e-08 | 9.73e-07 | 78 |
| GO:00430877 | Cervix | CC | regulation of GTPase activity | 79/2311 | 348/18723 | 4.21e-08 | 2.60e-06 | 79 |
| GO:00458608 | Cervix | CC | positive regulation of protein kinase activity | 85/2311 | 386/18723 | 5.61e-08 | 3.29e-06 | 85 |
| GO:005109810 | Cervix | CC | regulation of binding | 80/2311 | 363/18723 | 1.32e-07 | 6.42e-06 | 80 |
| GO:00343298 | Cervix | CC | cell junction assembly | 88/2311 | 420/18723 | 3.42e-07 | 1.38e-05 | 88 |
| GO:00163587 | Cervix | CC | dendrite development | 58/2311 | 243/18723 | 4.52e-07 | 1.76e-05 | 58 |
| GO:00719007 | Cervix | CC | regulation of protein serine/threonine kinase activity | 75/2311 | 359/18723 | 2.76e-06 | 8.02e-05 | 75 |
| GO:00109757 | Cervix | CC | regulation of neuron projection development | 88/2311 | 445/18723 | 4.26e-06 | 1.09e-04 | 88 |
| GO:00313467 | Cervix | CC | positive regulation of cell projection organization | 72/2311 | 353/18723 | 1.04e-05 | 2.32e-04 | 72 |
| GO:005109910 | Cervix | CC | positive regulation of binding | 42/2311 | 173/18723 | 1.07e-05 | 2.33e-04 | 42 |
| GO:00719025 | Cervix | CC | positive regulation of protein serine/threonine kinase activity | 46/2311 | 200/18723 | 1.87e-05 | 3.47e-04 | 46 |
| GO:00434104 | Cervix | CC | positive regulation of MAPK cascade | 90/2311 | 480/18723 | 2.92e-05 | 4.83e-04 | 90 |
| GO:00435476 | Cervix | CC | positive regulation of GTPase activity | 53/2311 | 255/18723 | 8.72e-05 | 1.16e-03 | 53 |
| GO:00015704 | Cervix | CC | vasculogenesis | 22/2311 | 80/18723 | 1.97e-04 | 2.26e-03 | 22 |
| GO:00433939 | Cervix | CC | regulation of protein binding | 42/2311 | 196/18723 | 2.27e-04 | 2.55e-03 | 42 |
| GO:000206410 | Cervix | CC | epithelial cell development | 45/2311 | 220/18723 | 4.14e-04 | 4.21e-03 | 45 |
| GO:19018886 | Cervix | CC | regulation of cell junction assembly | 42/2311 | 204/18723 | 5.50e-04 | 5.29e-03 | 42 |
| Page: 1 2 3 4 5 6 7 8 9 10 11 12 13 14 15 16 17 18 19 20 21 22 23 24 25 26 27 28 29 30 31 32 33 34 35 36 |
| Pathway ID | Tissue | Disease Stage | Description | Gene Ratio | Bg Ratio | pvalue | p.adjust | qvalue | Count |
| hsa0453020 | Cervix | CC | Tight junction | 49/1267 | 169/8465 | 1.87e-06 | 1.78e-05 | 1.05e-05 | 49 |
| hsa0401512 | Cervix | CC | Rap1 signaling pathway | 56/1267 | 210/8465 | 6.23e-06 | 5.61e-05 | 3.32e-05 | 56 |
| hsa040109 | Cervix | CC | MAPK signaling pathway | 62/1267 | 302/8465 | 4.89e-03 | 1.67e-02 | 9.86e-03 | 62 |
| hsa04530110 | Cervix | CC | Tight junction | 49/1267 | 169/8465 | 1.87e-06 | 1.78e-05 | 1.05e-05 | 49 |
| hsa0401513 | Cervix | CC | Rap1 signaling pathway | 56/1267 | 210/8465 | 6.23e-06 | 5.61e-05 | 3.32e-05 | 56 |
| hsa0401012 | Cervix | CC | MAPK signaling pathway | 62/1267 | 302/8465 | 4.89e-03 | 1.67e-02 | 9.86e-03 | 62 |
| hsa04530 | Colorectum | AD | Tight junction | 76/2092 | 169/8465 | 5.49e-09 | 9.69e-08 | 6.18e-08 | 76 |
| hsa04015 | Colorectum | AD | Rap1 signaling pathway | 71/2092 | 210/8465 | 1.72e-03 | 9.68e-03 | 6.18e-03 | 71 |
| hsa045301 | Colorectum | AD | Tight junction | 76/2092 | 169/8465 | 5.49e-09 | 9.69e-08 | 6.18e-08 | 76 |
| hsa040151 | Colorectum | AD | Rap1 signaling pathway | 71/2092 | 210/8465 | 1.72e-03 | 9.68e-03 | 6.18e-03 | 71 |
| hsa045302 | Colorectum | SER | Tight junction | 59/1580 | 169/8465 | 3.24e-07 | 5.98e-06 | 4.34e-06 | 59 |
| hsa040152 | Colorectum | SER | Rap1 signaling pathway | 54/1580 | 210/8465 | 6.55e-03 | 3.68e-02 | 2.67e-02 | 54 |
| hsa045303 | Colorectum | SER | Tight junction | 59/1580 | 169/8465 | 3.24e-07 | 5.98e-06 | 4.34e-06 | 59 |
| hsa040153 | Colorectum | SER | Rap1 signaling pathway | 54/1580 | 210/8465 | 6.55e-03 | 3.68e-02 | 2.67e-02 | 54 |
| hsa045304 | Colorectum | MSS | Tight junction | 66/1875 | 169/8465 | 4.10e-07 | 6.25e-06 | 3.83e-06 | 66 |
| hsa040154 | Colorectum | MSS | Rap1 signaling pathway | 66/1875 | 210/8465 | 1.03e-03 | 5.94e-03 | 3.64e-03 | 66 |
| hsa045305 | Colorectum | MSS | Tight junction | 66/1875 | 169/8465 | 4.10e-07 | 6.25e-06 | 3.83e-06 | 66 |
| hsa040155 | Colorectum | MSS | Rap1 signaling pathway | 66/1875 | 210/8465 | 1.03e-03 | 5.94e-03 | 3.64e-03 | 66 |
| hsa045308 | Colorectum | FAP | Tight junction | 60/1404 | 169/8465 | 1.40e-09 | 9.33e-08 | 5.67e-08 | 60 |
| hsa040156 | Colorectum | FAP | Rap1 signaling pathway | 53/1404 | 210/8465 | 7.93e-04 | 5.14e-03 | 3.13e-03 | 53 |
| Page: 1 2 3 4 5 |
Top |
Cell-cell communication analysis |
| Identification of potential cell-cell interactions between two cell types and their ligand-receptor pairs for different disease states |
| Ligand | Receptor | LRpair | Pathway | Tissue | Disease Stage |
| Page: 1 |
Top |
Single-cell gene regulatory network inference analysis |
| Find out the significant the regulons (TFs) and the target genes of each regulon across cell types for different disease states |
| TF | Cell Type | Tissue | Disease Stage | Target Gene | RSS | Regulon Activity |
| ∗The dot plots of a searched regulon are shown for all cell subpopulations in each disease state of each tissue based on the regulon specific score inferred using pySCENIC and by calculating the average expression. |
| Page: 1 |
Top |
Somatic mutation of malignant transformation related genes |
| Annotation of somatic variants for genes involved in malignant transformation |
| Hugo Symbol | Variant Class | Variant Classification | dbSNP RS | HGVSc | HGVSp | HGVSp Short | SWISSPROT | BIOTYPE | SIFT | PolyPhen | Tumor Sample Barcode | Tissue | Histology | Sex | Age | Stage | Therapy Types | Drugs | Outcome |
| RAPGEF2 | SNV | Missense_Mutation | novel | c.2263N>A | p.Ala755Thr | p.A755T | Q9Y4G8 | protein_coding | tolerated(0.6) | benign(0) | TCGA-5L-AAT1-01 | Breast | breast invasive carcinoma | Female | <65 | III/IV | Hormone Therapy | letrozol | SD |
| RAPGEF2 | SNV | Missense_Mutation | c.262G>T | p.Asp88Tyr | p.D88Y | Q9Y4G8 | protein_coding | deleterious(0) | probably_damaging(0.972) | TCGA-A2-A25A-01 | Breast | breast invasive carcinoma | Female | <65 | I/II | Unspecific | Cytoxan | SD | |
| RAPGEF2 | SNV | Missense_Mutation | c.1050N>A | p.Met350Ile | p.M350I | Q9Y4G8 | protein_coding | deleterious(0.01) | probably_damaging(0.989) | TCGA-AC-A23H-01 | Breast | breast invasive carcinoma | Female | >=65 | I/II | Unknown | Unknown | PD | |
| RAPGEF2 | SNV | Missense_Mutation | novel | c.965N>C | p.Asp322Ala | p.D322A | Q9Y4G8 | protein_coding | tolerated(0.41) | benign(0.155) | TCGA-AQ-A04H-01 | Breast | breast invasive carcinoma | Female | <65 | III/IV | Chemotherapy | taxotere | SD |
| RAPGEF2 | SNV | Missense_Mutation | rs757863966 | c.2726G>A | p.Arg909Gln | p.R909Q | Q9Y4G8 | protein_coding | deleterious(0.01) | possibly_damaging(0.457) | TCGA-AR-A0TX-01 | Breast | breast invasive carcinoma | Female | <65 | I/II | Unknown | Unknown | SD |
| RAPGEF2 | SNV | Missense_Mutation | c.647N>G | p.Thr216Arg | p.T216R | Q9Y4G8 | protein_coding | deleterious(0) | probably_damaging(1) | TCGA-BH-A0C0-01 | Breast | breast invasive carcinoma | Female | <65 | I/II | Chemotherapy | carboplatin | SD | |
| RAPGEF2 | SNV | Missense_Mutation | novel | c.3904N>A | p.Asp1302Asn | p.D1302N | Q9Y4G8 | protein_coding | tolerated_low_confidence(0.82) | benign(0.001) | TCGA-C8-A3M7-01 | Breast | breast invasive carcinoma | Female | <65 | III/IV | Unknown | Unknown | PD |
| RAPGEF2 | insertion | Frame_Shift_Ins | novel | c.2660_2661insTGTGCACCACCATGCTCGGCTAATTTTTTTTATTTTT | p.Lys887AsnfsTer21 | p.K887Nfs*21 | Q9Y4G8 | protein_coding | TCGA-A7-A0CG-01 | Breast | breast invasive carcinoma | Female | >=65 | I/II | Unknown | Unknown | SD | ||
| RAPGEF2 | insertion | Frame_Shift_Ins | novel | c.3259dupA | p.Ile1087AsnfsTer6 | p.I1087Nfs*6 | Q9Y4G8 | protein_coding | TCGA-A8-A09Z-01 | Breast | breast invasive carcinoma | Female | >=65 | I/II | Unknown | Unknown | SD | ||
| RAPGEF2 | deletion | Frame_Shift_Del | c.1547delN | p.Val518Ter | p.V518* | Q9Y4G8 | protein_coding | TCGA-D8-A1Y1-01 | Breast | breast invasive carcinoma | Female | >=65 | III/IV | Hormone Therapy | tamoxiphen | PD |
| Page: 1 2 3 4 5 6 7 8 9 10 11 12 13 14 15 16 17 18 19 |
Top |
Related drugs of malignant transformation related genes |
| Identification of chemicals and drugs interact with genes involved in malignant transfromation |
| (DGIdb 4.0) |
| Entrez ID | Symbol | Category | Interaction Types | Drug Claim Name | Drug Name | PMIDs |
| Page: 1 |

Copyright 2023-Present -The University of Texas Health Science Center at Houston |