
|
|||||
|
 | |
| |
| |
| |
| |
| |
|
Gene: RAPGEF1 |
Gene summary for RAPGEF1 |
| Gene information | Species | Human | Gene symbol | RAPGEF1 | Gene ID | 2889 |
| Gene name | Rap guanine nucleotide exchange factor 1 | |
| Gene Alias | C3G | |
| Cytomap | 9q34.13 | |
| Gene Type | protein-coding | GO ID | GO:0001885 | UniProtAcc | Q13905 |
Top |
Malignant transformation analysis |
| Identification of the aberrant gene expression in precancerous and cancerous lesions by comparing the gene expression of stem-like cells in diseased tissues with normal stem cells |
| Entrez ID | Symbol | Replicates | Species | Organ | Tissue | Adj P-value | Log2FC | Malignancy |
| 2889 | RAPGEF1 | HTA11_3410_2000001011 | Human | Colorectum | AD | 2.99e-04 | -2.99e-01 | 0.0155 |
| 2889 | RAPGEF1 | HTA11_347_2000001011 | Human | Colorectum | AD | 2.24e-08 | 4.74e-01 | -0.1954 |
| 2889 | RAPGEF1 | HTA11_99999970781_79442 | Human | Colorectum | MSS | 9.21e-07 | -3.33e-01 | 0.294 |
| 2889 | RAPGEF1 | HTA11_99999974143_84620 | Human | Colorectum | MSS | 3.11e-03 | -2.70e-01 | 0.3005 |
| 2889 | RAPGEF1 | A002-C-010 | Human | Colorectum | FAP | 2.93e-05 | -1.91e-01 | 0.242 |
| 2889 | RAPGEF1 | A015-C-203 | Human | Colorectum | FAP | 2.44e-20 | -4.53e-01 | -0.1294 |
| 2889 | RAPGEF1 | A015-C-204 | Human | Colorectum | FAP | 4.85e-03 | -1.97e-01 | -0.0228 |
| 2889 | RAPGEF1 | A014-C-040 | Human | Colorectum | FAP | 5.83e-03 | -4.32e-01 | -0.1184 |
| 2889 | RAPGEF1 | A002-C-201 | Human | Colorectum | FAP | 2.50e-11 | -3.50e-01 | 0.0324 |
| 2889 | RAPGEF1 | A002-C-203 | Human | Colorectum | FAP | 3.00e-03 | -1.34e-01 | 0.2786 |
| 2889 | RAPGEF1 | A001-C-119 | Human | Colorectum | FAP | 5.72e-09 | -4.88e-01 | -0.1557 |
| 2889 | RAPGEF1 | A001-C-108 | Human | Colorectum | FAP | 1.35e-15 | -3.73e-01 | -0.0272 |
| 2889 | RAPGEF1 | A002-C-205 | Human | Colorectum | FAP | 6.29e-20 | -4.88e-01 | -0.1236 |
| 2889 | RAPGEF1 | A001-C-104 | Human | Colorectum | FAP | 3.50e-06 | -2.77e-01 | 0.0184 |
| 2889 | RAPGEF1 | A015-C-006 | Human | Colorectum | FAP | 1.13e-12 | -4.83e-01 | -0.0994 |
| 2889 | RAPGEF1 | A015-C-106 | Human | Colorectum | FAP | 7.36e-10 | -2.78e-01 | -0.0511 |
| 2889 | RAPGEF1 | A002-C-114 | Human | Colorectum | FAP | 2.33e-15 | -5.08e-01 | -0.1561 |
| 2889 | RAPGEF1 | A015-C-104 | Human | Colorectum | FAP | 4.62e-23 | -4.51e-01 | -0.1899 |
| 2889 | RAPGEF1 | A001-C-014 | Human | Colorectum | FAP | 8.42e-11 | -3.25e-01 | 0.0135 |
| 2889 | RAPGEF1 | A002-C-016 | Human | Colorectum | FAP | 8.48e-19 | -4.58e-01 | 0.0521 |
| Page: 1 2 3 4 |
| Tissue | Expression Dynamics | Abbreviation |
| Colorectum (GSE201348) |  | FAP: Familial adenomatous polyposis |
| CRC: Colorectal cancer | ||
| Colorectum (HTA11) | 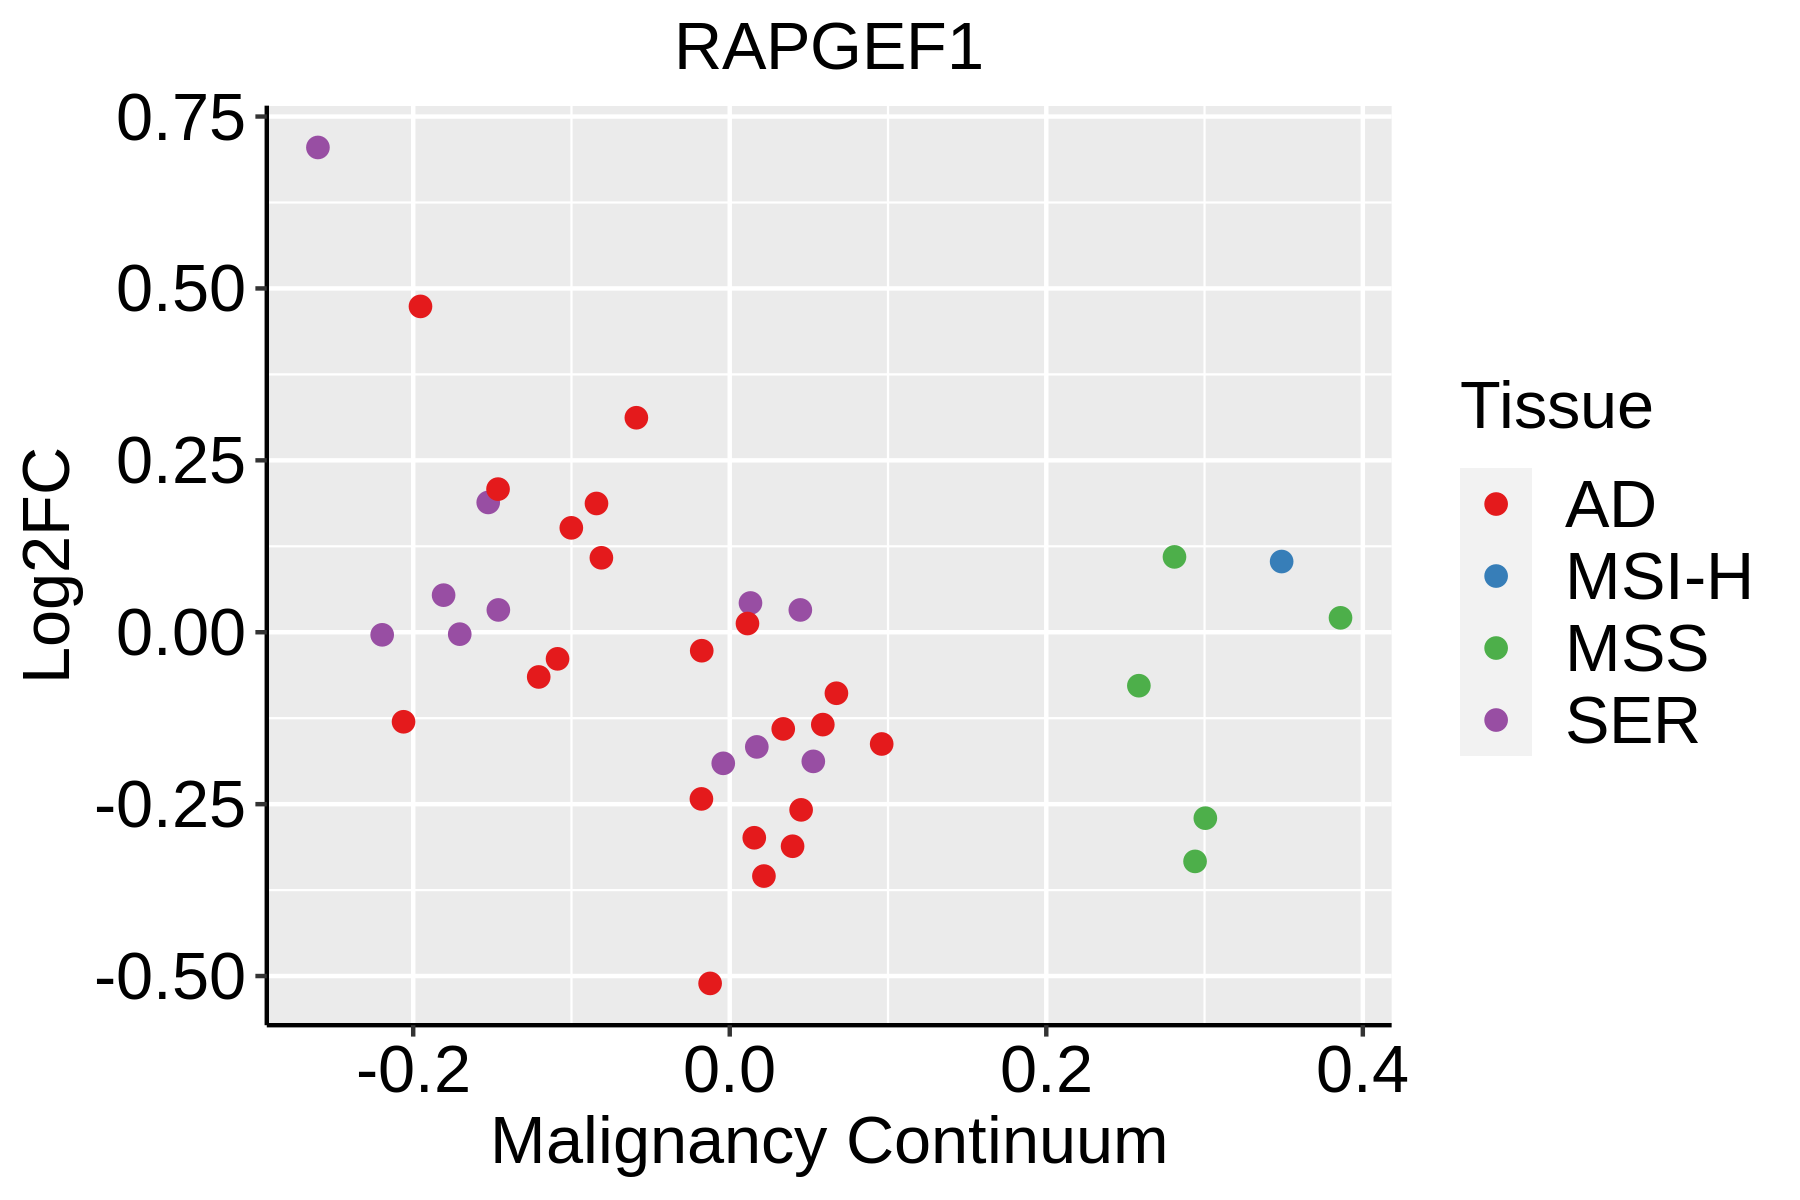 | AD: Adenomas |
| SER: Sessile serrated lesions | ||
| MSI-H: Microsatellite-high colorectal cancer | ||
| MSS: Microsatellite stable colorectal cancer | ||
| Liver | 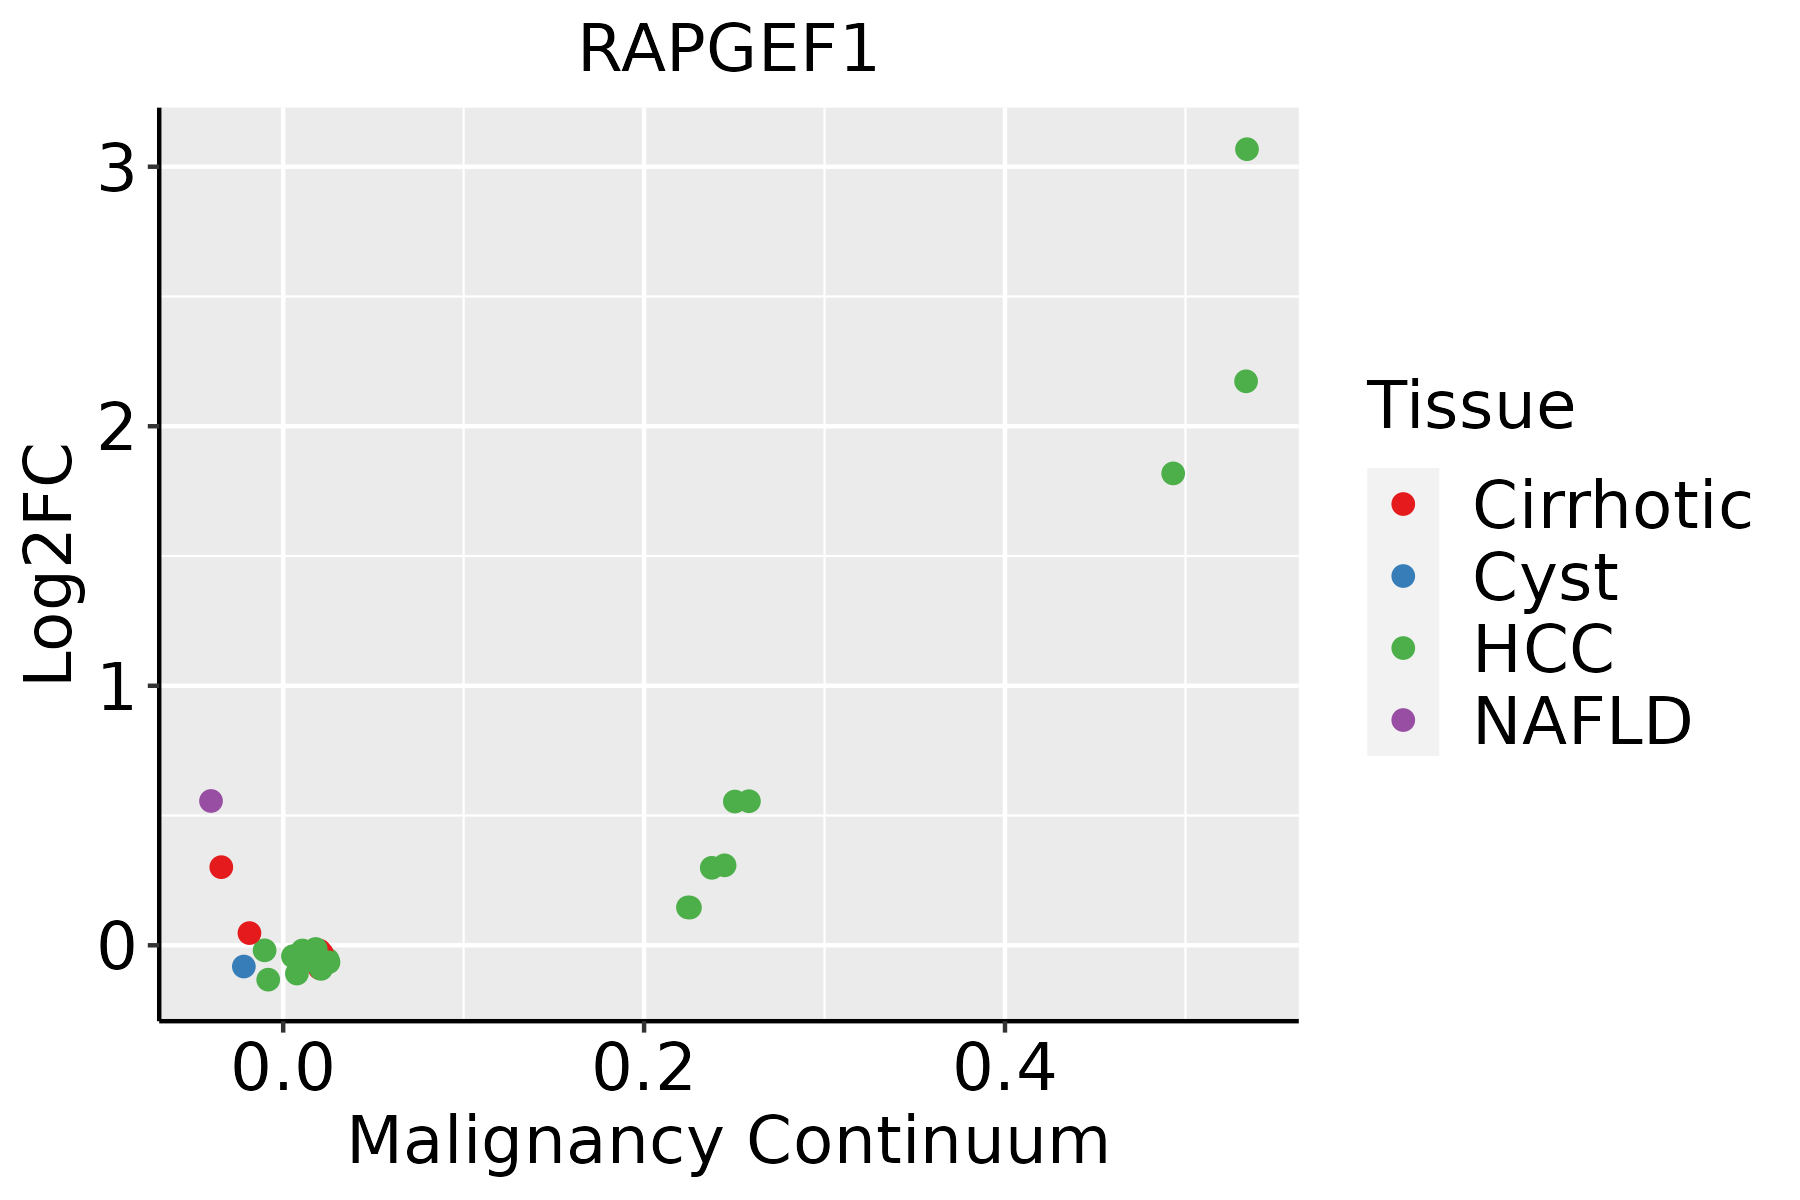 | HCC: Hepatocellular carcinoma |
| NAFLD: Non-alcoholic fatty liver disease | ||
| Oral Cavity |  | EOLP: Erosive Oral lichen planus |
| LP: leukoplakia | ||
| NEOLP: Non-erosive oral lichen planus | ||
| OSCC: Oral squamous cell carcinoma | ||
| Prostate | 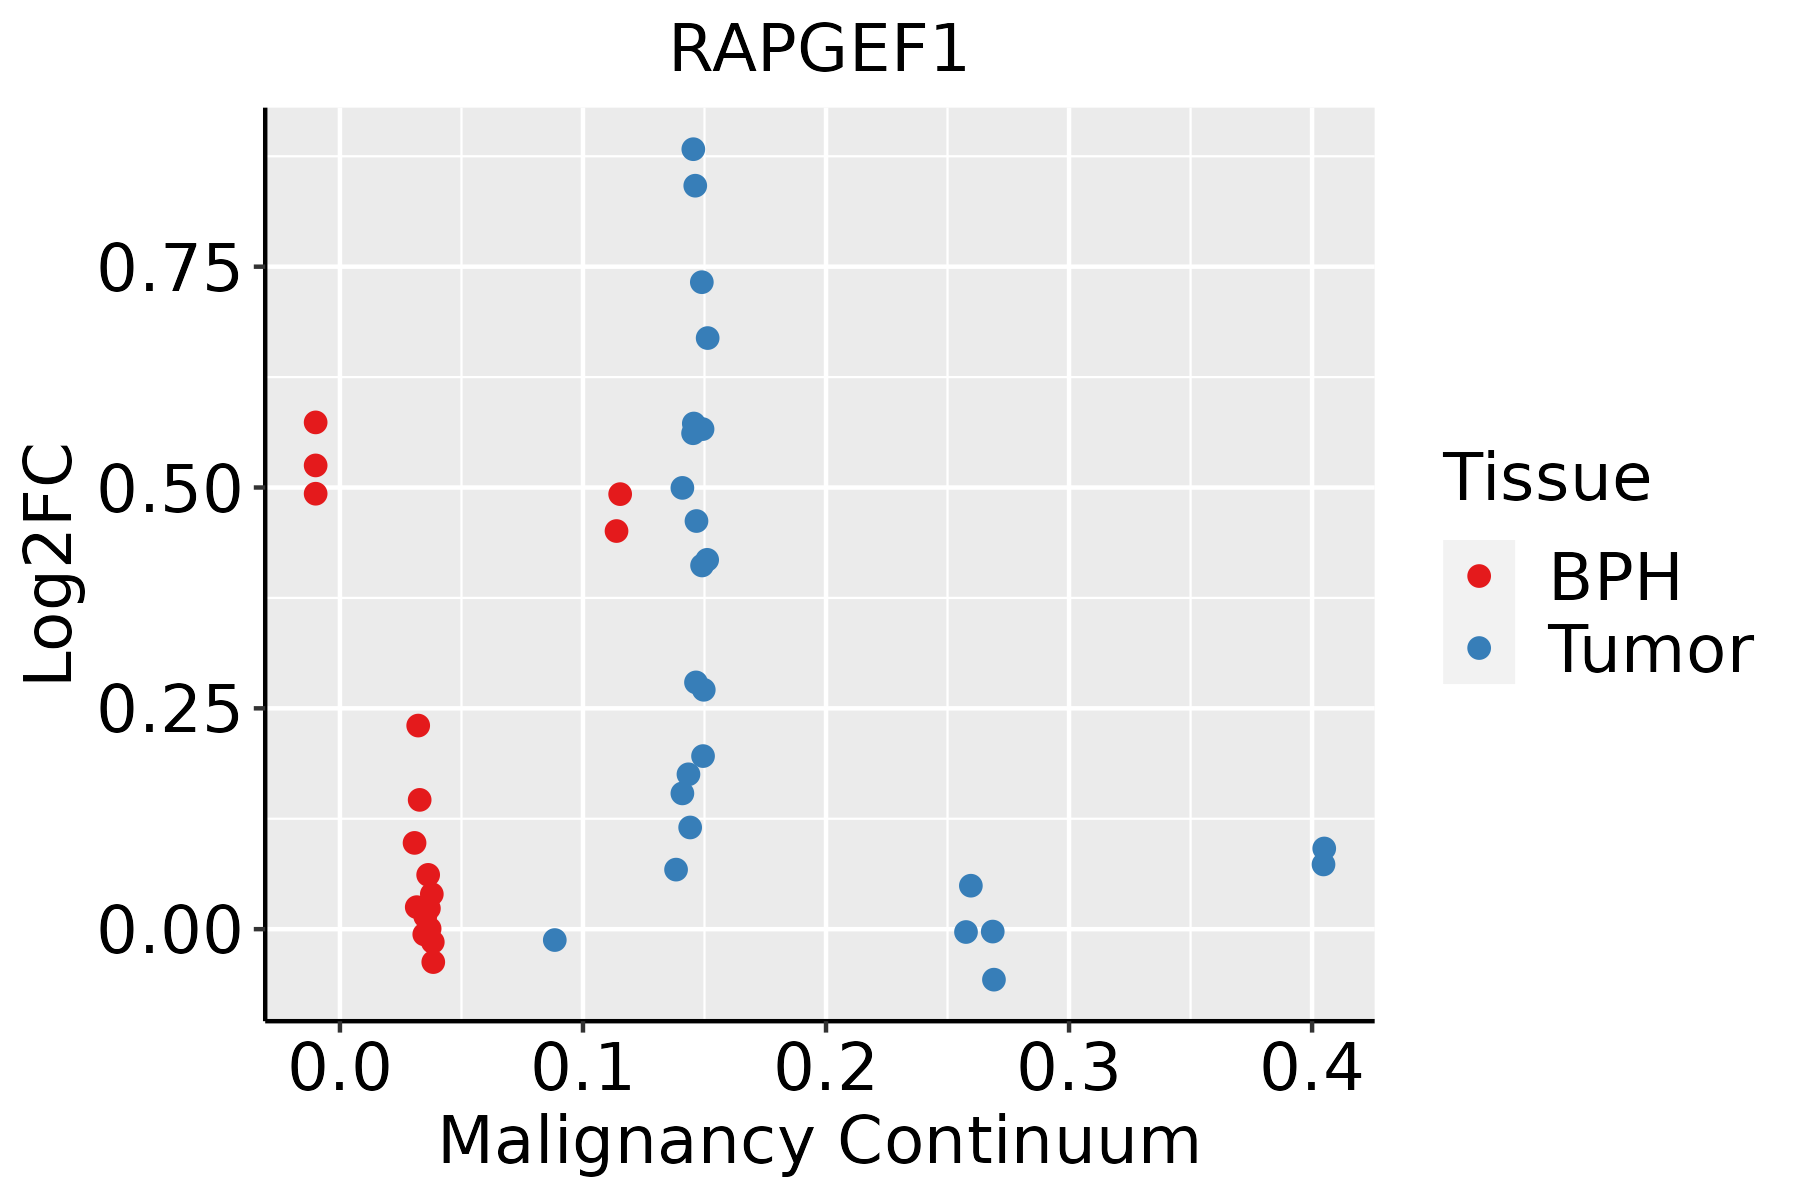 | BPH: Benign Prostatic Hyperplasia |
| Thyroid |  | ATC: Anaplastic thyroid cancer |
| HT: Hashimoto's thyroiditis | ||
| PTC: Papillary thyroid cancer |
| ∗log2FC in expression of this searched gene in stem-like cells from each diseased tissue sample relative to stem-like cells in normal samples in each tissue plotted against the malignancy continuum. Samples are colored based on if they are from different disease stage. |
Top |
Malignant transformation related pathway analysis |
| Find out the enriched GO biological processes and KEGG pathways involved in transition from healthy to precancer to cancer |
| Tissue | Disease Stage | Enriched GO biological Processes |
| Colorectum | AD |  |
| Colorectum | SER |  |
| Colorectum | MSS |  |
| Colorectum | MSI-H |  |
| Colorectum | FAP |  |
| ∗Top 15 enriched GO BP terms are showed in the bar plot of each disease state in each tissue. Each row represents a significant GO biological process which is colored according to the -log10(p.adjust). |
| Page: 1 2 3 4 5 6 7 8 9 |
| GO ID | Tissue | Disease Stage | Description | Gene Ratio | Bg Ratio | pvalue | p.adjust | Count |
| GO:0002064 | Colorectum | AD | epithelial cell development | 89/3918 | 220/18723 | 2.98e-11 | 3.52e-09 | 89 |
| GO:0034329 | Colorectum | AD | cell junction assembly | 136/3918 | 420/18723 | 2.02e-08 | 1.15e-06 | 136 |
| GO:0043087 | Colorectum | AD | regulation of GTPase activity | 110/3918 | 348/18723 | 1.64e-06 | 5.03e-05 | 110 |
| GO:1990090 | Colorectum | AD | cellular response to nerve growth factor stimulus | 26/3918 | 53/18723 | 4.87e-06 | 1.28e-04 | 26 |
| GO:0007265 | Colorectum | AD | Ras protein signal transduction | 104/3918 | 337/18723 | 1.01e-05 | 2.35e-04 | 104 |
| GO:0061028 | Colorectum | AD | establishment of endothelial barrier | 23/3918 | 46/18723 | 1.14e-05 | 2.57e-04 | 23 |
| GO:1990089 | Colorectum | AD | response to nerve growth factor | 26/3918 | 56/18723 | 1.71e-05 | 3.59e-04 | 26 |
| GO:0010975 | Colorectum | AD | regulation of neuron projection development | 129/3918 | 445/18723 | 2.88e-05 | 5.37e-04 | 129 |
| GO:0031346 | Colorectum | AD | positive regulation of cell projection organization | 104/3918 | 353/18723 | 8.26e-05 | 1.30e-03 | 104 |
| GO:0001885 | Colorectum | AD | endothelial cell development | 26/3918 | 64/18723 | 2.67e-04 | 3.29e-03 | 26 |
| GO:0043547 | Colorectum | AD | positive regulation of GTPase activity | 75/3918 | 255/18723 | 7.95e-04 | 7.91e-03 | 75 |
| GO:0003158 | Colorectum | AD | endothelium development | 44/3918 | 136/18723 | 1.20e-03 | 1.07e-02 | 44 |
| GO:0045446 | Colorectum | AD | endothelial cell differentiation | 39/3918 | 118/18723 | 1.42e-03 | 1.22e-02 | 39 |
| GO:1901888 | Colorectum | AD | regulation of cell junction assembly | 61/3918 | 204/18723 | 1.50e-03 | 1.27e-02 | 61 |
| GO:0051591 | Colorectum | AD | response to cAMP | 31/3918 | 93/18723 | 3.59e-03 | 2.58e-02 | 31 |
| GO:0071320 | Colorectum | AD | cellular response to cAMP | 20/3918 | 53/18723 | 3.71e-03 | 2.62e-02 | 20 |
| GO:00020642 | Colorectum | MSS | epithelial cell development | 81/3467 | 220/18723 | 1.02e-10 | 1.06e-08 | 81 |
| GO:00343292 | Colorectum | MSS | cell junction assembly | 120/3467 | 420/18723 | 2.51e-07 | 1.07e-05 | 120 |
| GO:00430872 | Colorectum | MSS | regulation of GTPase activity | 101/3467 | 348/18723 | 1.00e-06 | 3.46e-05 | 101 |
| GO:19900902 | Colorectum | MSS | cellular response to nerve growth factor stimulus | 23/3467 | 53/18723 | 2.56e-05 | 5.31e-04 | 23 |
| Page: 1 2 3 4 5 6 7 8 9 10 |
| Pathway ID | Tissue | Disease Stage | Description | Gene Ratio | Bg Ratio | pvalue | p.adjust | qvalue | Count |
| hsa04722 | Colorectum | AD | Neurotrophin signaling pathway | 50/2092 | 119/8465 | 2.28e-05 | 2.24e-04 | 1.43e-04 | 50 |
| hsa04015 | Colorectum | AD | Rap1 signaling pathway | 71/2092 | 210/8465 | 1.72e-03 | 9.68e-03 | 6.18e-03 | 71 |
| hsa05211 | Colorectum | AD | Renal cell carcinoma | 28/2092 | 69/8465 | 2.58e-03 | 1.37e-02 | 8.75e-03 | 28 |
| hsa04510 | Colorectum | AD | Focal adhesion | 67/2092 | 203/8465 | 4.40e-03 | 2.17e-02 | 1.38e-02 | 67 |
| hsa047221 | Colorectum | AD | Neurotrophin signaling pathway | 50/2092 | 119/8465 | 2.28e-05 | 2.24e-04 | 1.43e-04 | 50 |
| hsa040151 | Colorectum | AD | Rap1 signaling pathway | 71/2092 | 210/8465 | 1.72e-03 | 9.68e-03 | 6.18e-03 | 71 |
| hsa052111 | Colorectum | AD | Renal cell carcinoma | 28/2092 | 69/8465 | 2.58e-03 | 1.37e-02 | 8.75e-03 | 28 |
| hsa045101 | Colorectum | AD | Focal adhesion | 67/2092 | 203/8465 | 4.40e-03 | 2.17e-02 | 1.38e-02 | 67 |
| hsa047224 | Colorectum | MSS | Neurotrophin signaling pathway | 45/1875 | 119/8465 | 7.04e-05 | 6.55e-04 | 4.02e-04 | 45 |
| hsa040154 | Colorectum | MSS | Rap1 signaling pathway | 66/1875 | 210/8465 | 1.03e-03 | 5.94e-03 | 3.64e-03 | 66 |
| hsa04910 | Colorectum | MSS | Insulin signaling pathway | 43/1875 | 137/8465 | 7.37e-03 | 2.84e-02 | 1.74e-02 | 43 |
| hsa047225 | Colorectum | MSS | Neurotrophin signaling pathway | 45/1875 | 119/8465 | 7.04e-05 | 6.55e-04 | 4.02e-04 | 45 |
| hsa040155 | Colorectum | MSS | Rap1 signaling pathway | 66/1875 | 210/8465 | 1.03e-03 | 5.94e-03 | 3.64e-03 | 66 |
| hsa049101 | Colorectum | MSS | Insulin signaling pathway | 43/1875 | 137/8465 | 7.37e-03 | 2.84e-02 | 1.74e-02 | 43 |
| hsa045102 | Colorectum | FAP | Focal adhesion | 61/1404 | 203/8465 | 1.03e-06 | 2.15e-05 | 1.31e-05 | 61 |
| hsa047226 | Colorectum | FAP | Neurotrophin signaling pathway | 38/1404 | 119/8465 | 2.49e-05 | 2.78e-04 | 1.69e-04 | 38 |
| hsa052112 | Colorectum | FAP | Renal cell carcinoma | 23/1404 | 69/8465 | 4.86e-04 | 3.56e-03 | 2.16e-03 | 23 |
| hsa040156 | Colorectum | FAP | Rap1 signaling pathway | 53/1404 | 210/8465 | 7.93e-04 | 5.14e-03 | 3.13e-03 | 53 |
| hsa049102 | Colorectum | FAP | Insulin signaling pathway | 36/1404 | 137/8465 | 2.51e-03 | 1.18e-02 | 7.18e-03 | 36 |
| hsa045103 | Colorectum | FAP | Focal adhesion | 61/1404 | 203/8465 | 1.03e-06 | 2.15e-05 | 1.31e-05 | 61 |
| Page: 1 2 3 4 5 |
Top |
Cell-cell communication analysis |
| Identification of potential cell-cell interactions between two cell types and their ligand-receptor pairs for different disease states |
| Ligand | Receptor | LRpair | Pathway | Tissue | Disease Stage |
| Page: 1 |
Top |
Single-cell gene regulatory network inference analysis |
| Find out the significant the regulons (TFs) and the target genes of each regulon across cell types for different disease states |
| TF | Cell Type | Tissue | Disease Stage | Target Gene | RSS | Regulon Activity |
| ∗The dot plots of a searched regulon are shown for all cell subpopulations in each disease state of each tissue based on the regulon specific score inferred using pySCENIC and by calculating the average expression. |
| Page: 1 |
Top |
Somatic mutation of malignant transformation related genes |
| Annotation of somatic variants for genes involved in malignant transformation |
| Hugo Symbol | Variant Class | Variant Classification | dbSNP RS | HGVSc | HGVSp | HGVSp Short | SWISSPROT | BIOTYPE | SIFT | PolyPhen | Tumor Sample Barcode | Tissue | Histology | Sex | Age | Stage | Therapy Types | Drugs | Outcome |
| RAPGEF1 | SNV | Missense_Mutation | c.2614N>A | p.Glu872Lys | p.E872K | Q13905 | protein_coding | deleterious(0.01) | possibly_damaging(0.618) | TCGA-A2-A25A-01 | Breast | breast invasive carcinoma | Female | <65 | I/II | Unspecific | Cytoxan | SD | |
| RAPGEF1 | SNV | Missense_Mutation | novel | c.956N>T | p.Ala319Val | p.A319V | Q13905 | protein_coding | deleterious(0) | probably_damaging(0.999) | TCGA-AN-A046-01 | Breast | breast invasive carcinoma | Female | >=65 | I/II | Unknown | Unknown | SD |
| RAPGEF1 | SNV | Missense_Mutation | novel | c.1924N>G | p.Lys642Glu | p.K642E | Q13905 | protein_coding | tolerated(0.44) | benign(0.152) | TCGA-AN-A0AT-01 | Breast | breast invasive carcinoma | Female | <65 | I/II | Unknown | Unknown | SD |
| RAPGEF1 | SNV | Missense_Mutation | c.1636N>G | p.Phe546Val | p.F546V | Q13905 | protein_coding | tolerated(0.14) | benign(0.228) | TCGA-AN-A0FV-01 | Breast | breast invasive carcinoma | Female | <65 | I/II | Unknown | Unknown | SD | |
| RAPGEF1 | SNV | Missense_Mutation | c.3274N>A | p.Glu1092Lys | p.E1092K | Q13905 | protein_coding | deleterious_low_confidence(0.01) | possibly_damaging(0.716) | TCGA-AR-A250-01 | Breast | breast invasive carcinoma | Female | <65 | I/II | Chemotherapy | doxorubicin | SD | |
| RAPGEF1 | SNV | Missense_Mutation | c.780G>C | p.Glu260Asp | p.E260D | Q13905 | protein_coding | tolerated(0.09) | possibly_damaging(0.469) | TCGA-BH-A209-01 | Breast | breast invasive carcinoma | Female | >=65 | I/II | Unknown | Unknown | SD | |
| RAPGEF1 | SNV | Missense_Mutation | c.2641G>A | p.Glu881Lys | p.E881K | Q13905 | protein_coding | deleterious(0) | probably_damaging(0.999) | TCGA-C8-A26Y-01 | Breast | breast invasive carcinoma | Female | >=65 | I/II | Unknown | Unknown | SD | |
| RAPGEF1 | SNV | Missense_Mutation | c.583G>A | p.Val195Met | p.V195M | Q13905 | protein_coding | deleterious(0.04) | probably_damaging(0.927) | TCGA-E2-A15M-01 | Breast | breast invasive carcinoma | Female | >=65 | I/II | Hormone Therapy | arimidex | SD | |
| RAPGEF1 | SNV | Missense_Mutation | novel | c.159N>C | p.Lys53Asn | p.K53N | Q13905 | protein_coding | deleterious_low_confidence(0) | probably_damaging(0.999) | TCGA-E9-A22A-01 | Breast | breast invasive carcinoma | Female | >=65 | I/II | Hormone Therapy | tamoxiphen | SD |
| RAPGEF1 | SNV | Missense_Mutation | novel | c.1852N>C | p.Asp618His | p.D618H | Q13905 | protein_coding | deleterious(0) | probably_damaging(0.922) | TCGA-LL-A6FP-01 | Breast | breast invasive carcinoma | Female | >=65 | I/II | Hormone Therapy | arimidex | SD |
| Page: 1 2 3 4 5 6 7 8 9 10 11 12 13 |
Top |
Related drugs of malignant transformation related genes |
| Identification of chemicals and drugs interact with genes involved in malignant transfromation |
| (DGIdb 4.0) |
| Entrez ID | Symbol | Category | Interaction Types | Drug Claim Name | Drug Name | PMIDs |
| Page: 1 |

Copyright 2023-Present -The University of Texas Health Science Center at Houston |