
|
|||||
|
 | |
| |
| |
| |
| |
| |
|
Gene: RAP2B |
Gene summary for RAP2B |
| Gene information | Species | Human | Gene symbol | RAP2B | Gene ID | 5912 |
| Gene name | RAP2B, member of RAS oncogene family | |
| Gene Alias | RAP2B | |
| Cytomap | 3q25.2 | |
| Gene Type | protein-coding | GO ID | GO:0001775 | UniProtAcc | P61225 |
Top |
Malignant transformation analysis |
| Identification of the aberrant gene expression in precancerous and cancerous lesions by comparing the gene expression of stem-like cells in diseased tissues with normal stem cells |
| Entrez ID | Symbol | Replicates | Species | Organ | Tissue | Adj P-value | Log2FC | Malignancy |
| 5912 | RAP2B | CA_HPV_2 | Human | Cervix | CC | 3.70e-06 | 3.44e-01 | 0.0391 |
| 5912 | RAP2B | N_HPV_2 | Human | Cervix | N_HPV | 2.13e-02 | 1.78e-01 | -0.0131 |
| 5912 | RAP2B | CCI_2 | Human | Cervix | CC | 8.61e-08 | 9.31e-01 | 0.5249 |
| 5912 | RAP2B | Tumor | Human | Cervix | CC | 5.06e-13 | 4.26e-01 | 0.1241 |
| 5912 | RAP2B | sample1 | Human | Cervix | CC | 1.75e-04 | 5.24e-01 | 0.0959 |
| 5912 | RAP2B | sample3 | Human | Cervix | CC | 9.58e-29 | 5.76e-01 | 0.1387 |
| 5912 | RAP2B | T1 | Human | Cervix | CC | 6.82e-24 | 7.73e-01 | 0.0918 |
| 5912 | RAP2B | T3 | Human | Cervix | CC | 6.55e-33 | 6.00e-01 | 0.1389 |
| 5912 | RAP2B | LZE4T | Human | Esophagus | ESCC | 1.60e-05 | 2.61e-01 | 0.0811 |
| 5912 | RAP2B | LZE8T | Human | Esophagus | ESCC | 8.02e-07 | 1.47e-01 | 0.067 |
| 5912 | RAP2B | LZE20T | Human | Esophagus | ESCC | 7.00e-06 | 1.06e-01 | 0.0662 |
| 5912 | RAP2B | LZE24T | Human | Esophagus | ESCC | 1.94e-17 | 1.32e+00 | 0.0596 |
| 5912 | RAP2B | LZE21T | Human | Esophagus | ESCC | 5.12e-12 | 1.39e+00 | 0.0655 |
| 5912 | RAP2B | LZE6T | Human | Esophagus | ESCC | 1.70e-04 | -2.75e-01 | 0.0845 |
| 5912 | RAP2B | P1T-E | Human | Esophagus | ESCC | 2.22e-08 | 1.02e+00 | 0.0875 |
| 5912 | RAP2B | P2T-E | Human | Esophagus | ESCC | 8.86e-70 | 2.27e+00 | 0.1177 |
| 5912 | RAP2B | P4T-E | Human | Esophagus | ESCC | 1.77e-25 | 1.49e+00 | 0.1323 |
| 5912 | RAP2B | P5T-E | Human | Esophagus | ESCC | 1.34e-43 | 1.52e+00 | 0.1327 |
| 5912 | RAP2B | P8T-E | Human | Esophagus | ESCC | 3.89e-14 | 4.45e-01 | 0.0889 |
| 5912 | RAP2B | P9T-E | Human | Esophagus | ESCC | 1.29e-37 | 1.51e+00 | 0.1131 |
| Page: 1 2 3 4 5 6 |
| Tissue | Expression Dynamics | Abbreviation |
| Cervix |  | CC: Cervix cancer |
| HSIL_HPV: HPV-infected high-grade squamous intraepithelial lesions | ||
| N_HPV: HPV-infected normal cervix | ||
| Esophagus | 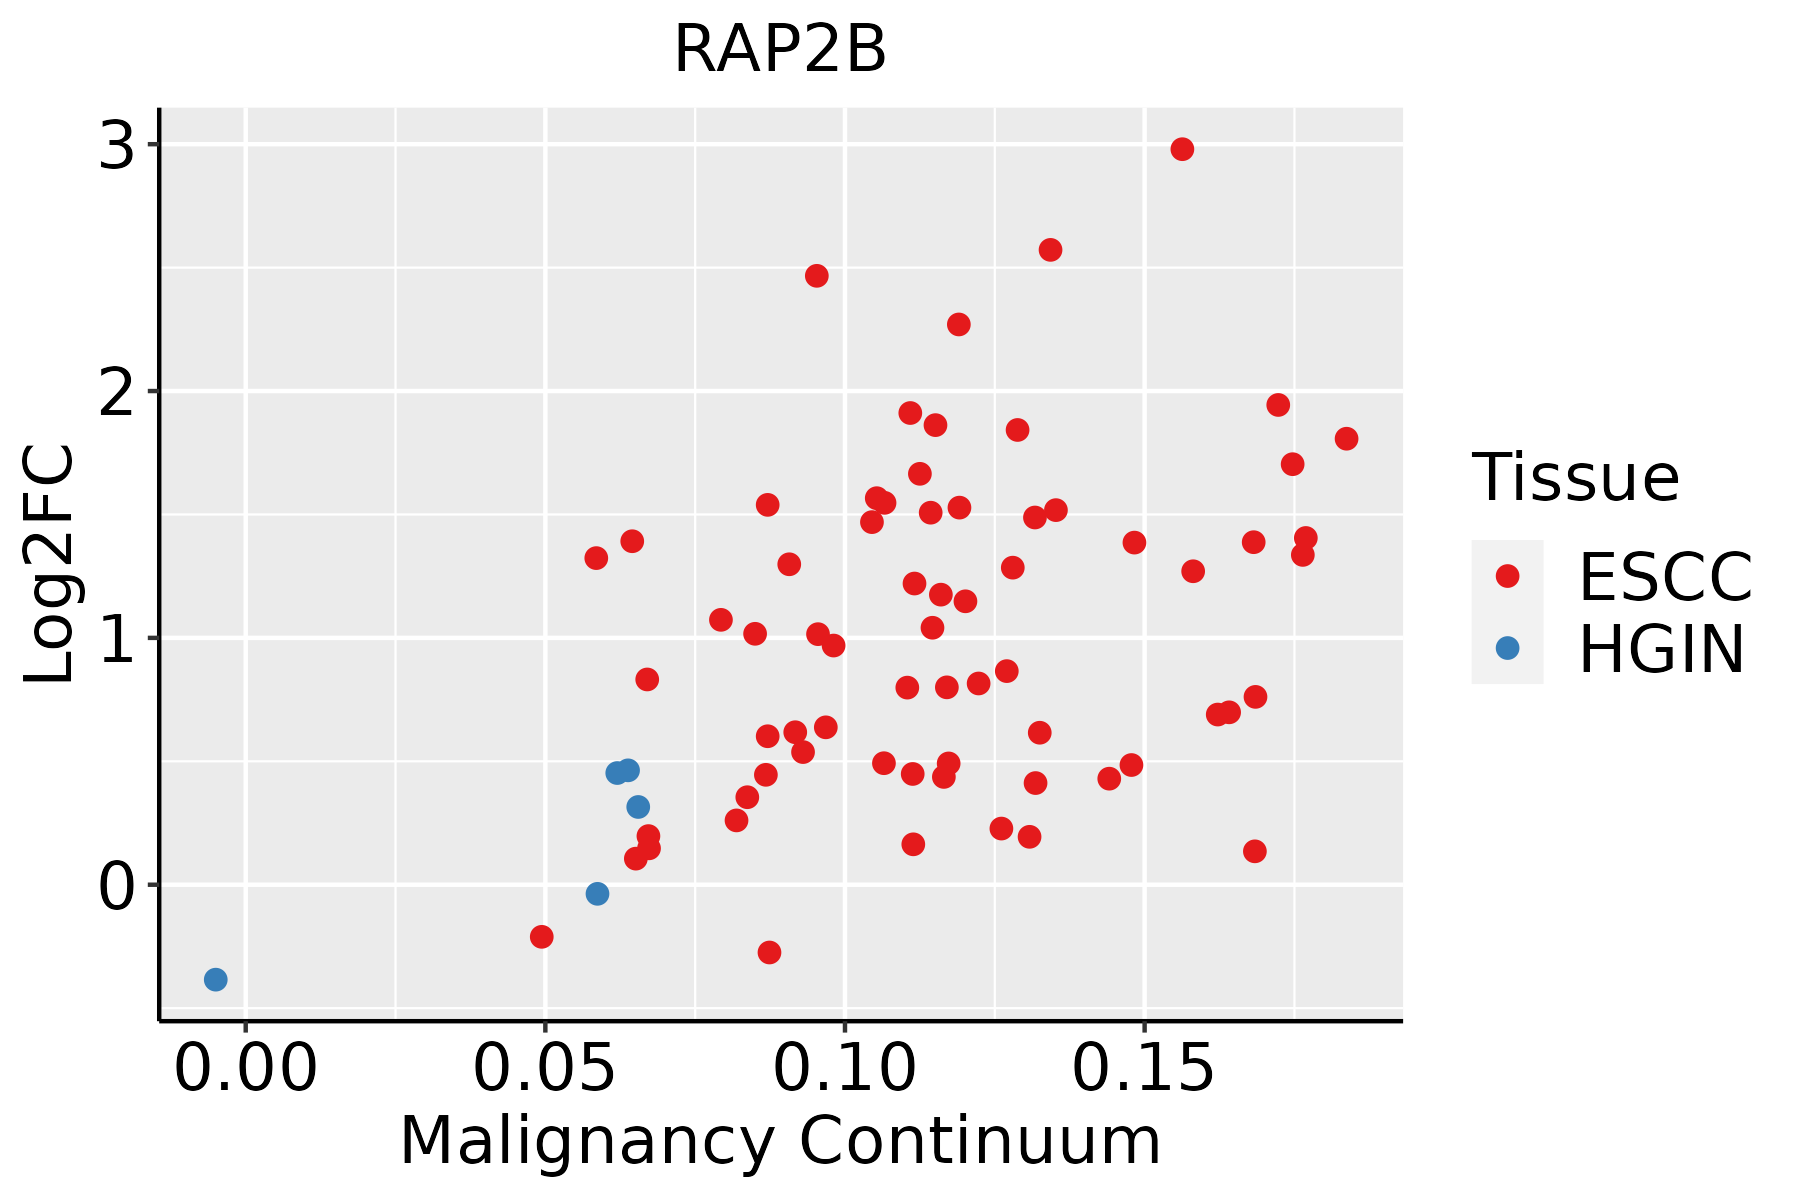 | ESCC: Esophageal squamous cell carcinoma |
| HGIN: High-grade intraepithelial neoplasias | ||
| LGIN: Low-grade intraepithelial neoplasias | ||
| Liver |  | HCC: Hepatocellular carcinoma |
| NAFLD: Non-alcoholic fatty liver disease | ||
| Oral Cavity |  | EOLP: Erosive Oral lichen planus |
| LP: leukoplakia | ||
| NEOLP: Non-erosive oral lichen planus | ||
| OSCC: Oral squamous cell carcinoma | ||
| Skin | 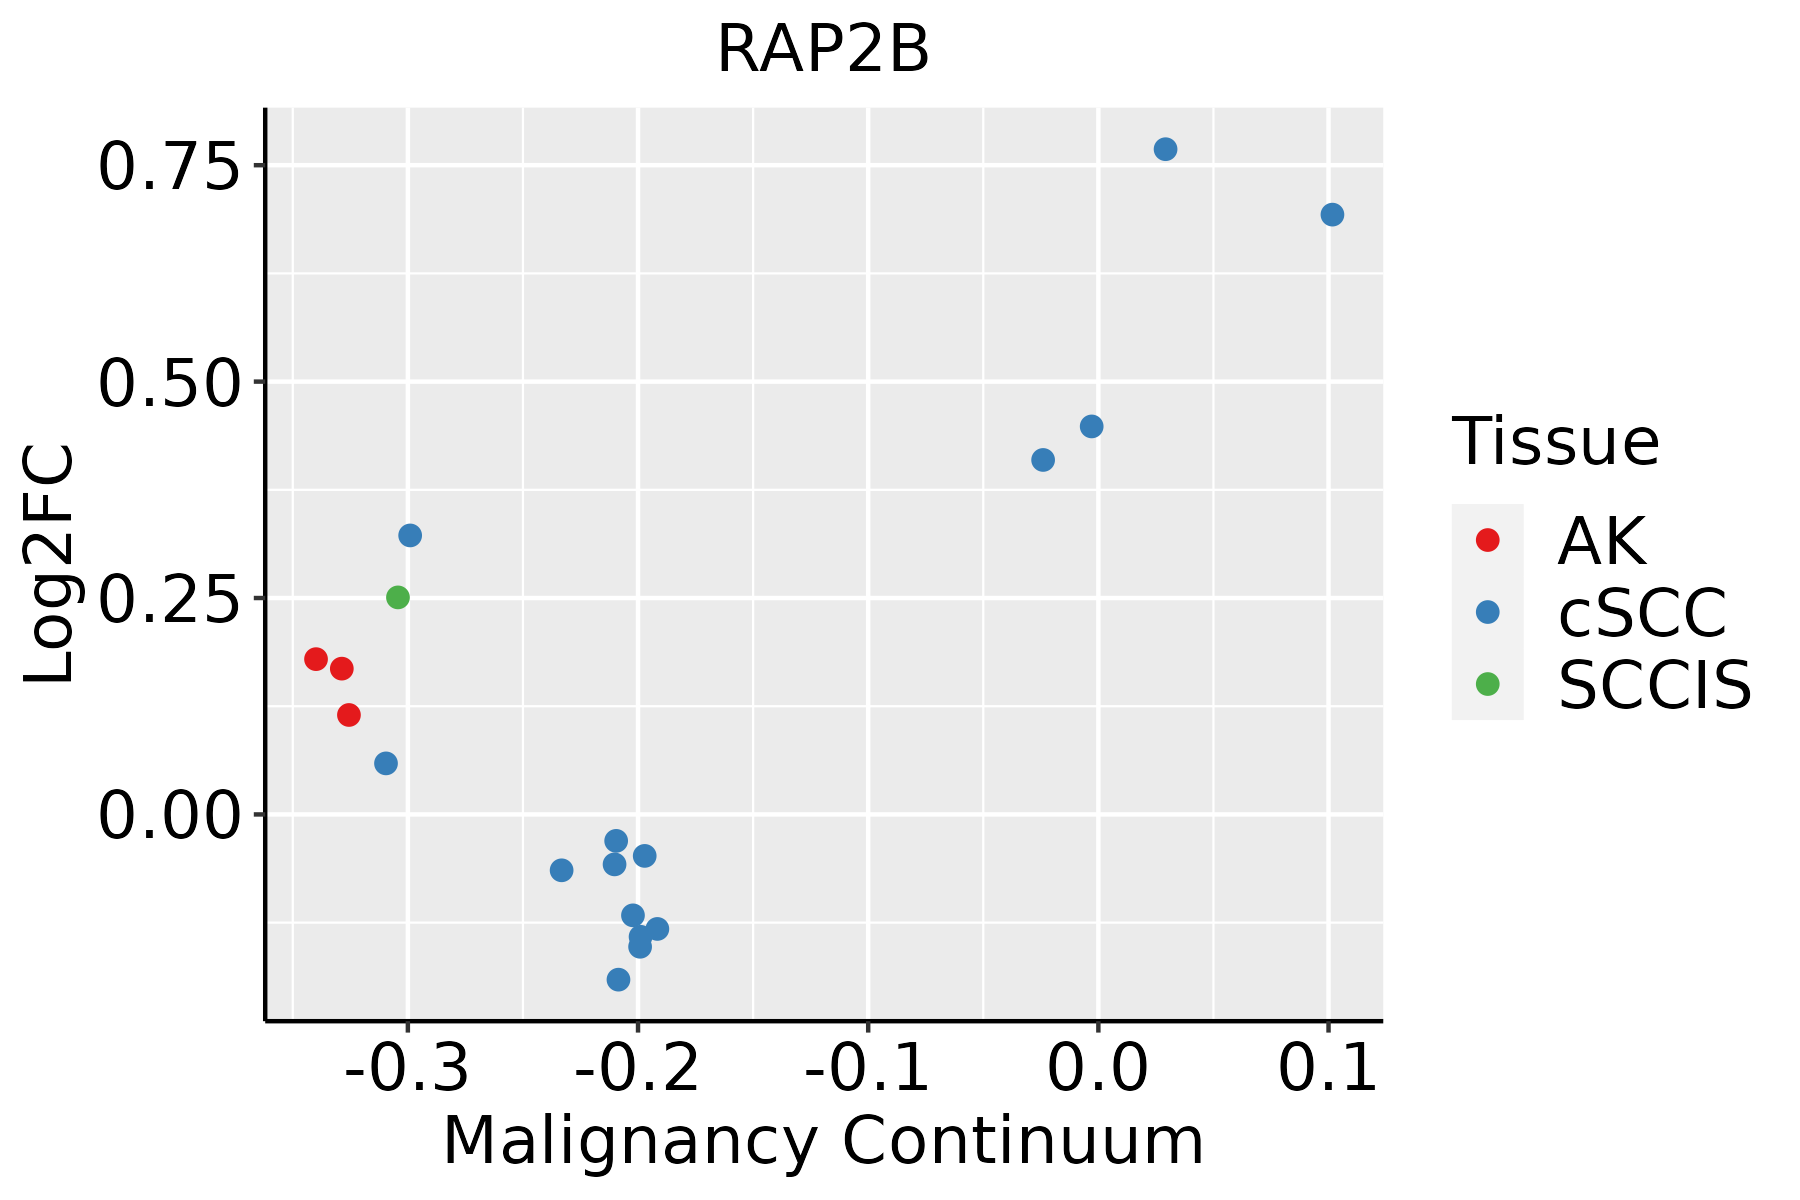 | AK: Actinic keratosis |
| cSCC: Cutaneous squamous cell carcinoma | ||
| SCCIS:squamous cell carcinoma in situ | ||
| Thyroid | 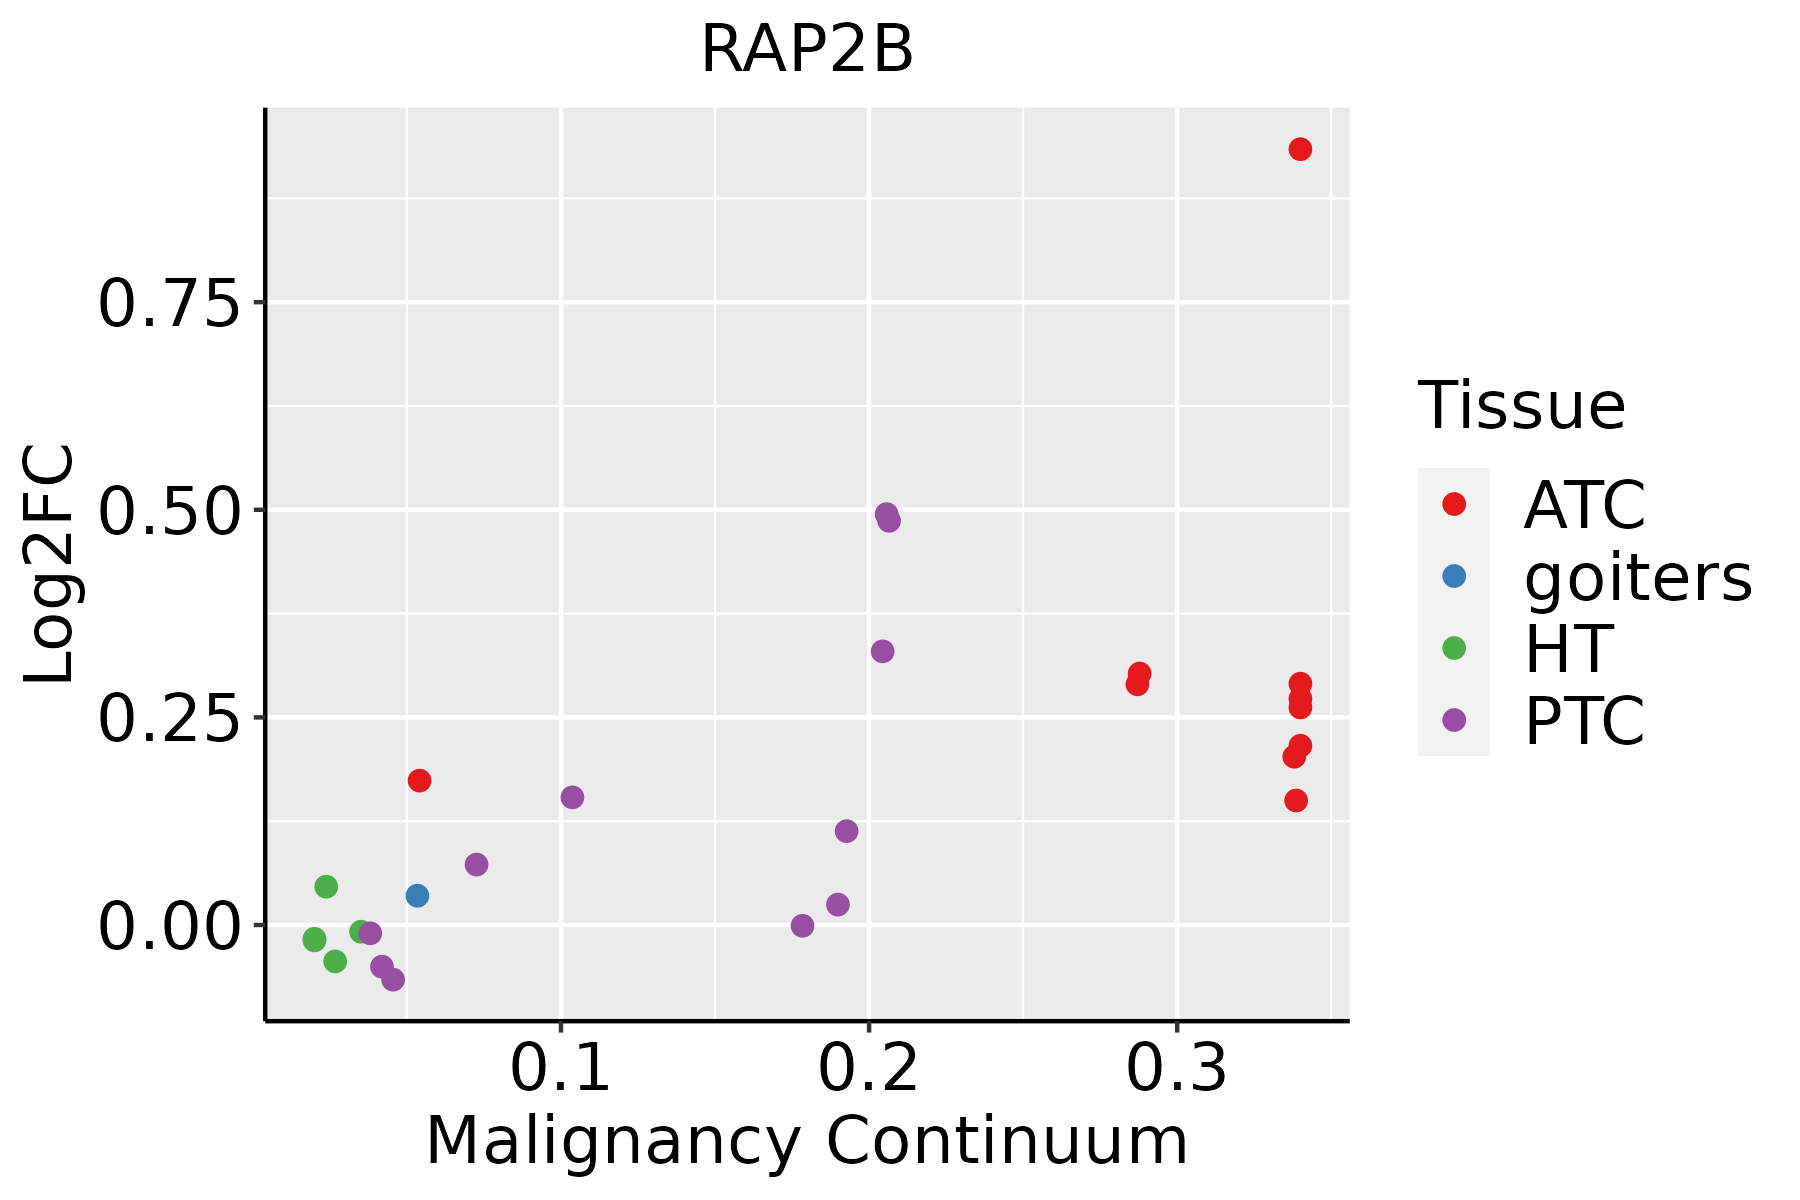 | ATC: Anaplastic thyroid cancer |
| HT: Hashimoto's thyroiditis | ||
| PTC: Papillary thyroid cancer |
| ∗log2FC in expression of this searched gene in stem-like cells from each diseased tissue sample relative to stem-like cells in normal samples in each tissue plotted against the malignancy continuum. Samples are colored based on if they are from different disease stage. |
Top |
Malignant transformation related pathway analysis |
| Find out the enriched GO biological processes and KEGG pathways involved in transition from healthy to precancer to cancer |
| Tissue | Disease Stage | Enriched GO biological Processes |
| Colorectum | AD |  |
| Colorectum | SER |  |
| Colorectum | MSS |  |
| Colorectum | MSI-H |  |
| Colorectum | FAP |  |
| ∗Top 15 enriched GO BP terms are showed in the bar plot of each disease state in each tissue. Each row represents a significant GO biological process which is colored according to the -log10(p.adjust). |
| Page: 1 2 3 4 5 6 7 8 9 |
| GO ID | Tissue | Disease Stage | Description | Gene Ratio | Bg Ratio | pvalue | p.adjust | Count |
| GO:004206010 | Cervix | CC | wound healing | 109/2311 | 422/18723 | 1.84e-14 | 1.57e-11 | 109 |
| GO:00072656 | Cervix | CC | Ras protein signal transduction | 79/2311 | 337/18723 | 9.49e-09 | 7.77e-07 | 79 |
| GO:005087810 | Cervix | CC | regulation of body fluid levels | 78/2311 | 379/18723 | 3.20e-06 | 8.77e-05 | 78 |
| GO:003410910 | Cervix | CC | homotypic cell-cell adhesion | 26/2311 | 90/18723 | 2.12e-05 | 3.82e-04 | 26 |
| GO:00512713 | Cervix | CC | negative regulation of cellular component movement | 73/2311 | 367/18723 | 2.22e-05 | 3.95e-04 | 73 |
| GO:00400133 | Cervix | CC | negative regulation of locomotion | 76/2311 | 391/18723 | 3.47e-05 | 5.60e-04 | 76 |
| GO:20001463 | Cervix | CC | negative regulation of cell motility | 71/2311 | 359/18723 | 3.47e-05 | 5.60e-04 | 71 |
| GO:00303363 | Cervix | CC | negative regulation of cell migration | 68/2311 | 344/18723 | 5.11e-05 | 7.70e-04 | 68 |
| GO:00705279 | Cervix | CC | platelet aggregation | 19/2311 | 67/18723 | 3.42e-04 | 3.58e-03 | 19 |
| GO:00508176 | Cervix | CC | coagulation | 45/2311 | 222/18723 | 5.08e-04 | 4.94e-03 | 45 |
| GO:00075966 | Cervix | CC | blood coagulation | 44/2311 | 217/18723 | 5.78e-04 | 5.52e-03 | 44 |
| GO:00301682 | Cervix | CC | platelet activation | 28/2311 | 123/18723 | 8.92e-04 | 7.71e-03 | 28 |
| GO:00075996 | Cervix | CC | hemostasis | 44/2311 | 222/18723 | 9.47e-04 | 7.95e-03 | 44 |
| GO:004206025 | Cervix | N_HPV | wound healing | 28/534 | 422/18723 | 3.37e-05 | 8.58e-04 | 28 |
| GO:003410924 | Cervix | N_HPV | homotypic cell-cell adhesion | 9/534 | 90/18723 | 1.06e-03 | 1.23e-02 | 9 |
| GO:005087824 | Cervix | N_HPV | regulation of body fluid levels | 22/534 | 379/18723 | 1.37e-03 | 1.49e-02 | 22 |
| GO:005127112 | Cervix | N_HPV | negative regulation of cellular component movement | 20/534 | 367/18723 | 4.53e-03 | 3.40e-02 | 20 |
| GO:005081721 | Cervix | N_HPV | coagulation | 14/534 | 222/18723 | 4.76e-03 | 3.52e-02 | 14 |
| GO:200014612 | Cervix | N_HPV | negative regulation of cell motility | 19/534 | 359/18723 | 7.54e-03 | 4.89e-02 | 19 |
| GO:000726510 | Esophagus | ESCC | Ras protein signal transduction | 201/8552 | 337/18723 | 1.44e-07 | 2.30e-06 | 201 |
| Page: 1 2 3 4 5 6 |
| Pathway ID | Tissue | Disease Stage | Description | Gene Ratio | Bg Ratio | pvalue | p.adjust | qvalue | Count |
| Page: 1 |
Top |
Cell-cell communication analysis |
| Identification of potential cell-cell interactions between two cell types and their ligand-receptor pairs for different disease states |
| Ligand | Receptor | LRpair | Pathway | Tissue | Disease Stage |
| Page: 1 |
Top |
Single-cell gene regulatory network inference analysis |
| Find out the significant the regulons (TFs) and the target genes of each regulon across cell types for different disease states |
| TF | Cell Type | Tissue | Disease Stage | Target Gene | RSS | Regulon Activity |
| ∗The dot plots of a searched regulon are shown for all cell subpopulations in each disease state of each tissue based on the regulon specific score inferred using pySCENIC and by calculating the average expression. |
| Page: 1 |
Top |
Somatic mutation of malignant transformation related genes |
| Annotation of somatic variants for genes involved in malignant transformation |
| Hugo Symbol | Variant Class | Variant Classification | dbSNP RS | HGVSc | HGVSp | HGVSp Short | SWISSPROT | BIOTYPE | SIFT | PolyPhen | Tumor Sample Barcode | Tissue | Histology | Sex | Age | Stage | Therapy Types | Drugs | Outcome |
| RAP2B | SNV | Missense_Mutation | c.414N>C | p.Trp138Cys | p.W138C | P61225 | protein_coding | deleterious(0.01) | probably_damaging(1) | TCGA-A1-A0SI-01 | Breast | breast invasive carcinoma | Female | <65 | I/II | Unknown | Unknown | SD | |
| RAP2B | SNV | Missense_Mutation | c.245N>G | p.Tyr82Cys | p.Y82C | P61225 | protein_coding | deleterious(0.01) | probably_damaging(0.989) | TCGA-B6-A0RE-01 | Breast | breast invasive carcinoma | Female | <65 | I/II | Unknown | Unknown | SD | |
| RAP2B | SNV | Missense_Mutation | novel | c.356A>G | p.Asp119Gly | p.D119G | P61225 | protein_coding | deleterious(0) | probably_damaging(1) | TCGA-EA-A3HS-01 | Cervix | cervical & endocervical cancer | Female | <65 | I/II | Unknown | Unknown | SD |
| RAP2B | SNV | Missense_Mutation | c.200N>C | p.Met67Thr | p.M67T | P61225 | protein_coding | deleterious(0.02) | probably_damaging(0.994) | TCGA-AY-6197-01 | Colorectum | colon adenocarcinoma | Male | <65 | I/II | Unknown | Unknown | SD | |
| RAP2B | SNV | Missense_Mutation | novel | c.90N>T | p.Glu30Asp | p.E30D | P61225 | protein_coding | tolerated(0.32) | probably_damaging(0.986) | TCGA-AG-A002-01 | Colorectum | rectum adenocarcinoma | Male | <65 | I/II | Unknown | Unknown | SD |
| RAP2B | SNV | Missense_Mutation | novel | c.408G>T | p.Glu136Asp | p.E136D | P61225 | protein_coding | tolerated(0.15) | benign(0) | TCGA-AJ-A3EK-01 | Endometrium | uterine corpus endometrioid carcinoma | Female | <65 | I/II | Chemotherapy | carboplatin | CR |
| RAP2B | SNV | Missense_Mutation | novel | c.90N>T | p.Glu30Asp | p.E30D | P61225 | protein_coding | tolerated(0.32) | probably_damaging(0.986) | TCGA-DF-A2KU-01 | Endometrium | uterine corpus endometrioid carcinoma | Female | Unknown | I/II | Unknown | Unknown | SD |
| RAP2B | SNV | Missense_Mutation | novel | c.212N>G | p.Tyr71Cys | p.Y71C | P61225 | protein_coding | deleterious(0) | probably_damaging(0.998) | TCGA-E6-A1M0-01 | Endometrium | uterine corpus endometrioid carcinoma | Female | <65 | III/IV | Chemotherapy | carboplatin | SD |
| RAP2B | SNV | Missense_Mutation | novel | c.112N>T | p.Asp38Tyr | p.D38Y | P61225 | protein_coding | deleterious(0) | probably_damaging(1) | TCGA-EO-A22R-01 | Endometrium | uterine corpus endometrioid carcinoma | Female | <65 | I/II | Unknown | Unknown | SD |
| RAP2B | SNV | Missense_Mutation | novel | c.112N>T | p.Asp38Tyr | p.D38Y | P61225 | protein_coding | deleterious(0) | probably_damaging(1) | TCGA-EO-A3B0-01 | Endometrium | uterine corpus endometrioid carcinoma | Female | <65 | III/IV | Unknown | Unknown | SD |
| Page: 1 2 |
Top |
Related drugs of malignant transformation related genes |
| Identification of chemicals and drugs interact with genes involved in malignant transfromation |
| (DGIdb 4.0) |
| Entrez ID | Symbol | Category | Interaction Types | Drug Claim Name | Drug Name | PMIDs |
| Page: 1 |

Copyright 2023-Present -The University of Texas Health Science Center at Houston |