Schematic overview of the cellular and molecular mechanisms involved in the cancer progression, including the proposed cellular and molecular mechanisms in cancer cells trajectory. AT1: alveolar type 1 cells; AT2: alveolar type 2 cells; AAH: atypical adenomatous hyperplasia; AIS: adenocarcinoma in situ; MIA: minimally invasive adenocarcinoma; IA: invasive adenocarcinoma; EMT: epithelial-mesenchymal transition

Home

Download

Statistics

Help

Contact

Center for Computational Systems Medicine
leaf

Gene summary

leaf

Malignant transformation analysis

leaf

Malignant transformation related pathway analysis

leaf

Cell-cell communication analysis

leaf

Single-cell gene regulatory network inference analysis

leaf

Somatic mutation of malignant transformation related genes

leaf

Related drugs of malignant transformation related genes

Gene: RAP1GDS1

Gene summary for RAP1GDS1

check button Gene summary.

Gene informationSpeciesHuman
Gene symbol

RAP1GDS1

Gene ID

5910

Gene nameRap1 GTPase-GDP dissociation stimulator 1
Gene AliasGDS1
Cytomap4q23
Gene Typeprotein-coding
GO ID

GO:0003008

UniProtAcc

P52306


Top

Malignant transformation analysis

check button Identification of the aberrant gene expression in precancerous and cancerous lesions by comparing the gene expression of stem-like cells in diseased tissues with normal stem cells
check button Malignant transformation involving gene list.
Entrez IDSymbolReplicatesSpeciesOrganTissueAdj P-valueLog2FCMalignancy
5910RAP1GDS1CCI_1HumanCervixCC1.97e-025.20e-010.528
5910RAP1GDS1CCI_2HumanCervixCC9.94e-044.30e-010.5249
5910RAP1GDS1CCI_3HumanCervixCC1.39e-117.26e-010.516
5910RAP1GDS1HTA11_3410_2000001011HumanColorectumAD4.22e-19-5.94e-010.0155
5910RAP1GDS1HTA11_2487_2000001011HumanColorectumSER8.98e-12-6.38e-01-0.1808
5910RAP1GDS1HTA11_2112_2000001011HumanColorectumSER2.81e-02-7.51e-01-0.2196
5910RAP1GDS1HTA11_3361_2000001011HumanColorectumAD2.85e-06-5.97e-01-0.1207
5910RAP1GDS1HTA11_83_2000001011HumanColorectumSER1.58e-03-5.12e-01-0.1526
5910RAP1GDS1HTA11_696_2000001011HumanColorectumAD1.81e-16-5.11e-01-0.1464
5910RAP1GDS1HTA11_866_2000001011HumanColorectumAD2.30e-06-3.84e-01-0.1001
5910RAP1GDS1HTA11_5212_2000001011HumanColorectumAD4.28e-03-6.58e-01-0.2061
5910RAP1GDS1HTA11_866_3004761011HumanColorectumAD1.85e-13-6.13e-010.096
5910RAP1GDS1HTA11_8622_2000001021HumanColorectumSER1.65e-04-6.91e-010.0528
5910RAP1GDS1HTA11_10711_2000001011HumanColorectumAD3.26e-06-5.67e-010.0338
5910RAP1GDS1HTA11_7696_3000711011HumanColorectumAD6.45e-11-4.42e-010.0674
5910RAP1GDS1HTA11_99999970781_79442HumanColorectumMSS3.69e-03-3.05e-010.294
5910RAP1GDS1HTA11_99999971662_82457HumanColorectumMSS4.78e-10-3.69e-010.3859
5910RAP1GDS1HTA11_99999973899_84307HumanColorectumMSS2.59e-02-5.48e-010.2585
5910RAP1GDS1HTA11_99999974143_84620HumanColorectumMSS6.86e-18-6.10e-010.3005
5910RAP1GDS1A001-C-207HumanColorectumFAP2.84e-04-2.38e-010.1278
Page: 1 2 3 4 5 6 7 

check button Transcriptomic changes along malignancy continuum.
TissueExpression DynamicsAbbreviation
CervixThe image shows the transcriptomic changes along malignancy continuum.log2FC in expression of this searched gene in stem-like cells from each diseased tissue sample relative to stem-like cells in normal samples in each tissue plotted against the malignancy continuum. Samples are colored based on if they are from different disease stage.CC: Cervix cancer
HSIL_HPV: HPV-infected high-grade squamous intraepithelial lesions
N_HPV: HPV-infected normal cervix
Colorectum (GSE201348)The image shows the transcriptomic changes along malignancy continuum.log2FC in expression of this searched gene in stem-like cells from each diseased tissue sample relative to stem-like cells in normal samples in each tissue plotted against the malignancy continuum. Samples are colored based on if they are from different disease stage.FAP: Familial adenomatous polyposis
CRC: Colorectal cancer
Colorectum (HTA11)The image shows the transcriptomic changes along malignancy continuum.log2FC in expression of this searched gene in stem-like cells from each diseased tissue sample relative to stem-like cells in normal samples in each tissue plotted against the malignancy continuum. Samples are colored based on if they are from different disease stage.AD: Adenomas
SER: Sessile serrated lesions
MSI-H: Microsatellite-high colorectal cancer
MSS: Microsatellite stable colorectal cancer
EsophagusThe image shows the transcriptomic changes along malignancy continuum.log2FC in expression of this searched gene in stem-like cells from each diseased tissue sample relative to stem-like cells in normal samples in each tissue plotted against the malignancy continuum. Samples are colored based on if they are from different disease stage.
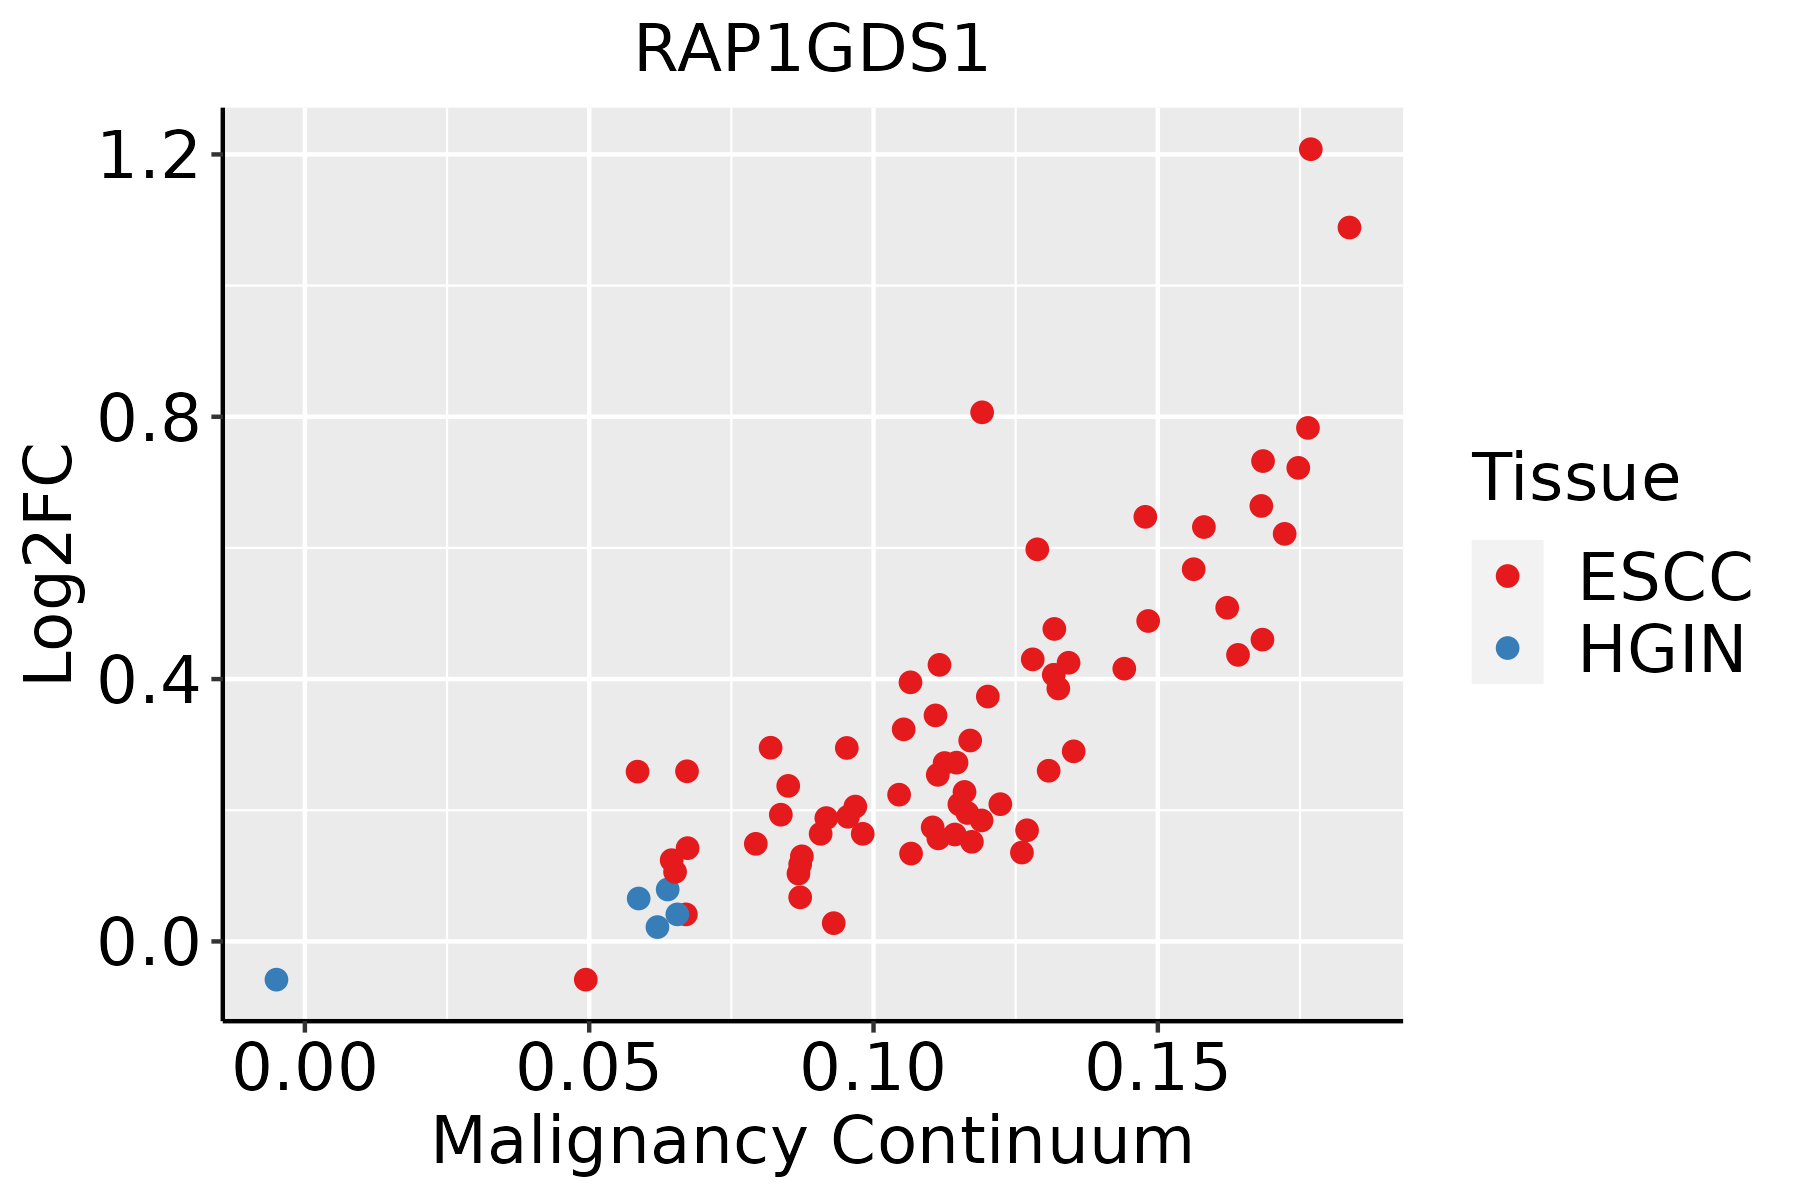
ESCC: Esophageal squamous cell carcinoma
HGIN: High-grade intraepithelial neoplasias
LGIN: Low-grade intraepithelial neoplasias
LiverThe image shows the transcriptomic changes along malignancy continuum.log2FC in expression of this searched gene in stem-like cells from each diseased tissue sample relative to stem-like cells in normal samples in each tissue plotted against the malignancy continuum. Samples are colored based on if they are from different disease stage.
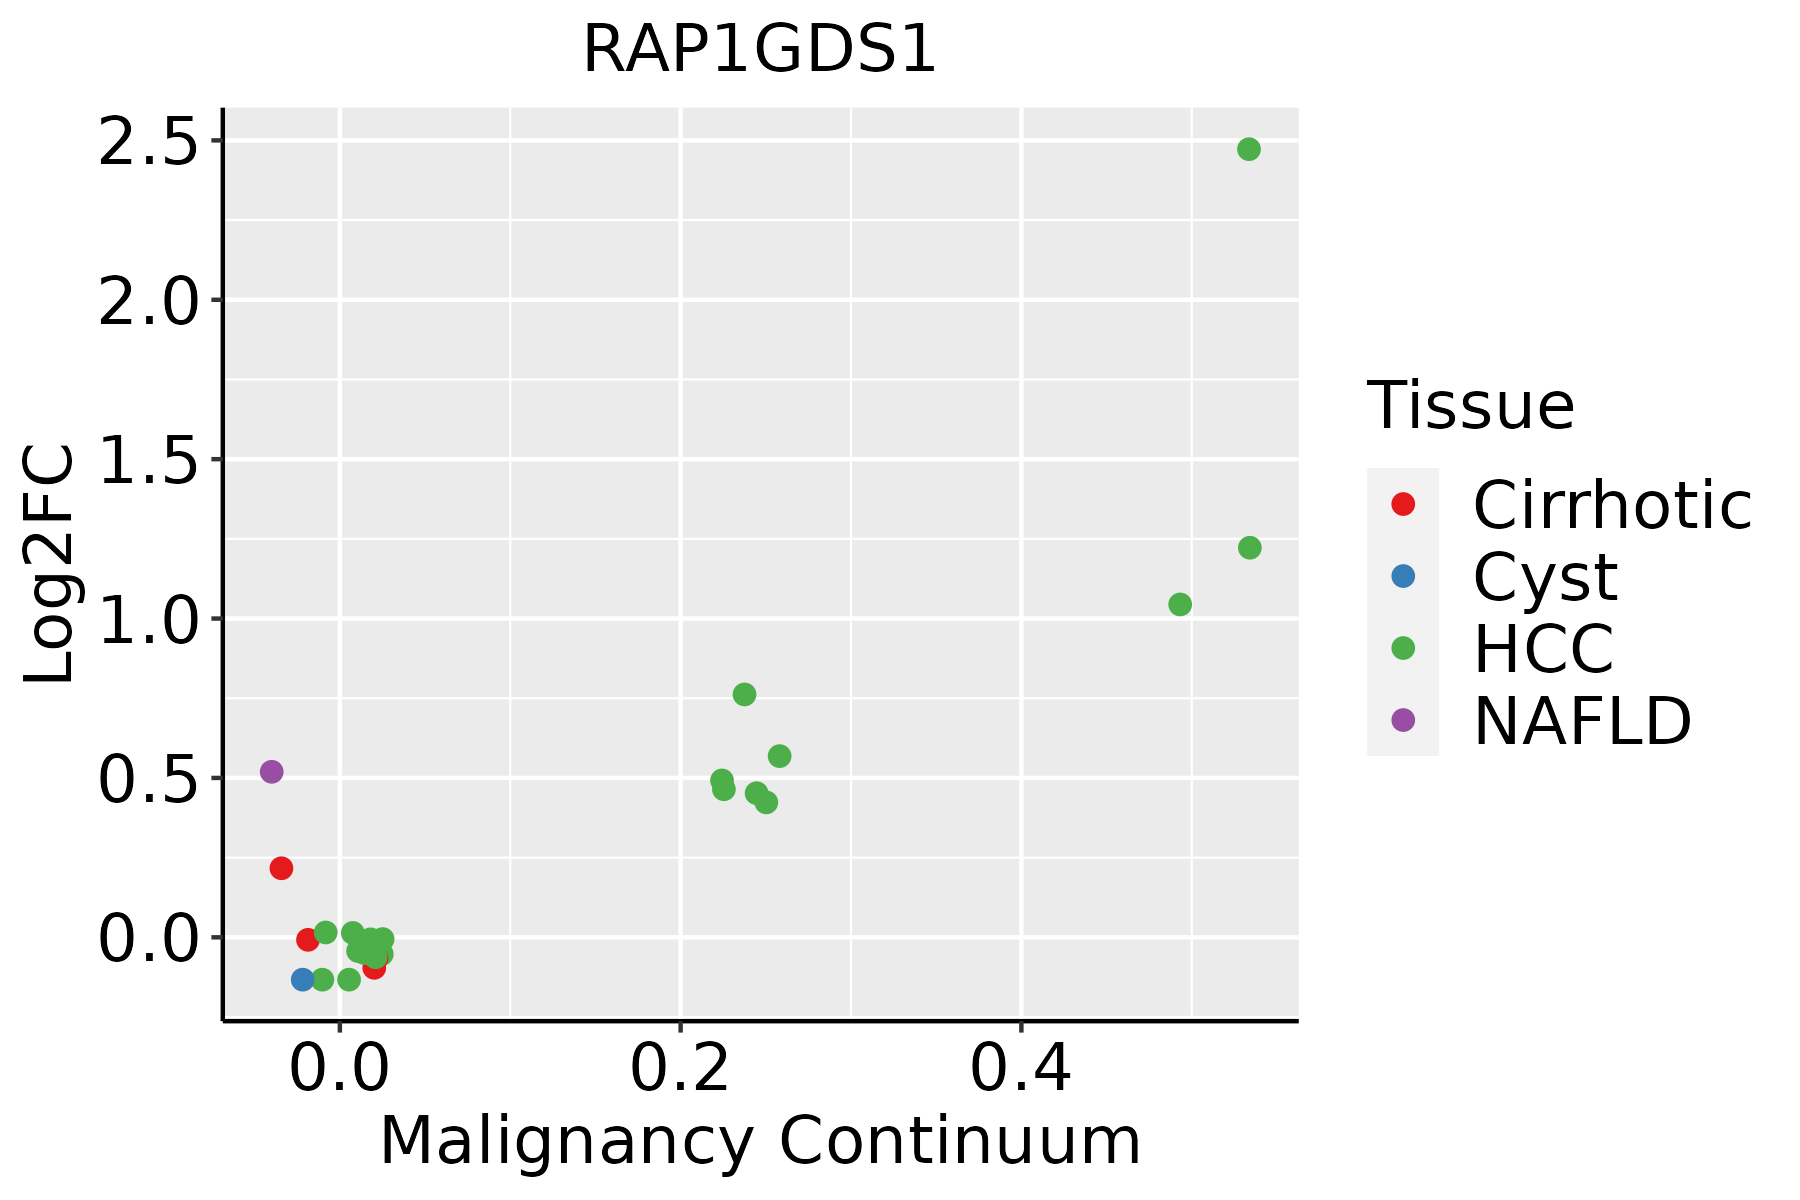
HCC: Hepatocellular carcinoma
NAFLD: Non-alcoholic fatty liver disease
Oral CavityThe image shows the transcriptomic changes along malignancy continuum.log2FC in expression of this searched gene in stem-like cells from each diseased tissue sample relative to stem-like cells in normal samples in each tissue plotted against the malignancy continuum. Samples are colored based on if they are from different disease stage.
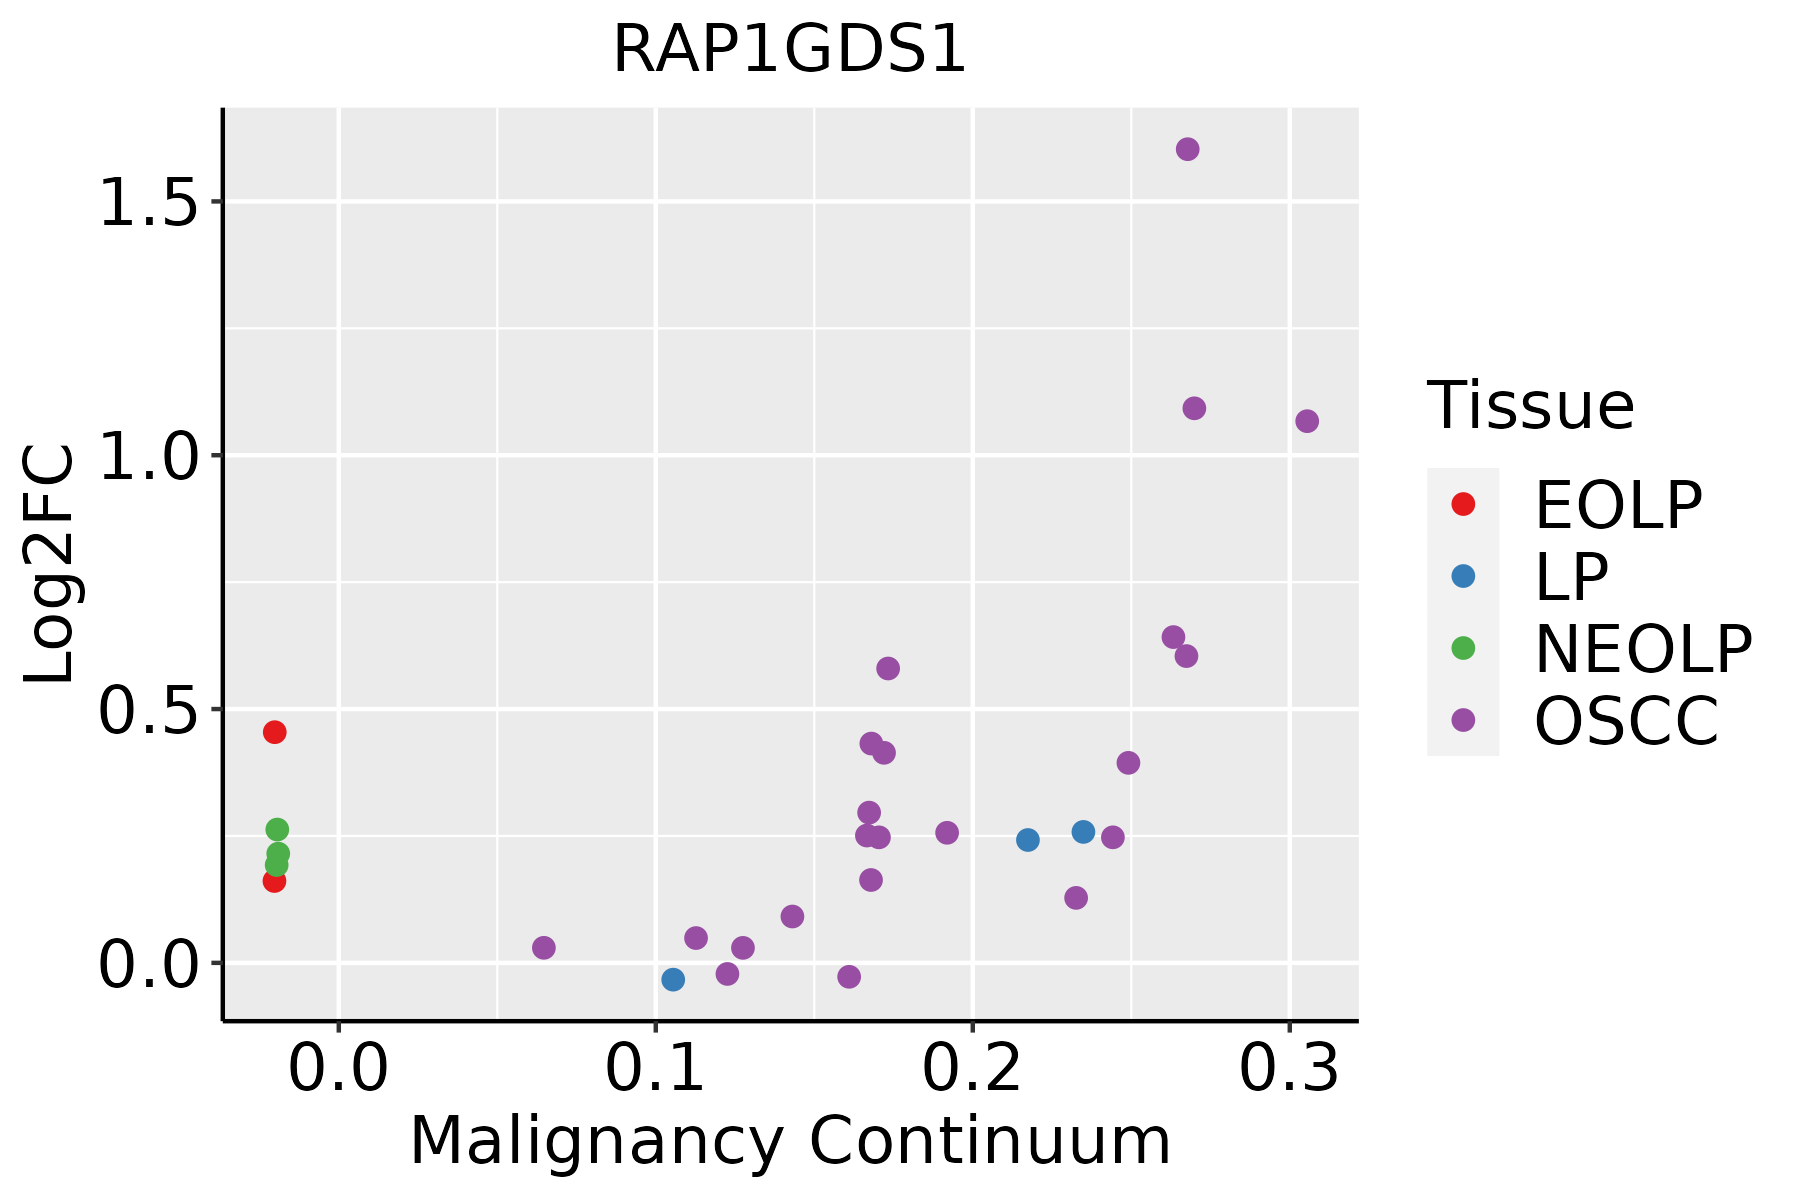
EOLP: Erosive Oral lichen planus
LP: leukoplakia
NEOLP: Non-erosive oral lichen planus
OSCC: Oral squamous cell carcinoma
SkinThe image shows the transcriptomic changes along malignancy continuum.log2FC in expression of this searched gene in stem-like cells from each diseased tissue sample relative to stem-like cells in normal samples in each tissue plotted against the malignancy continuum. Samples are colored based on if they are from different disease stage.
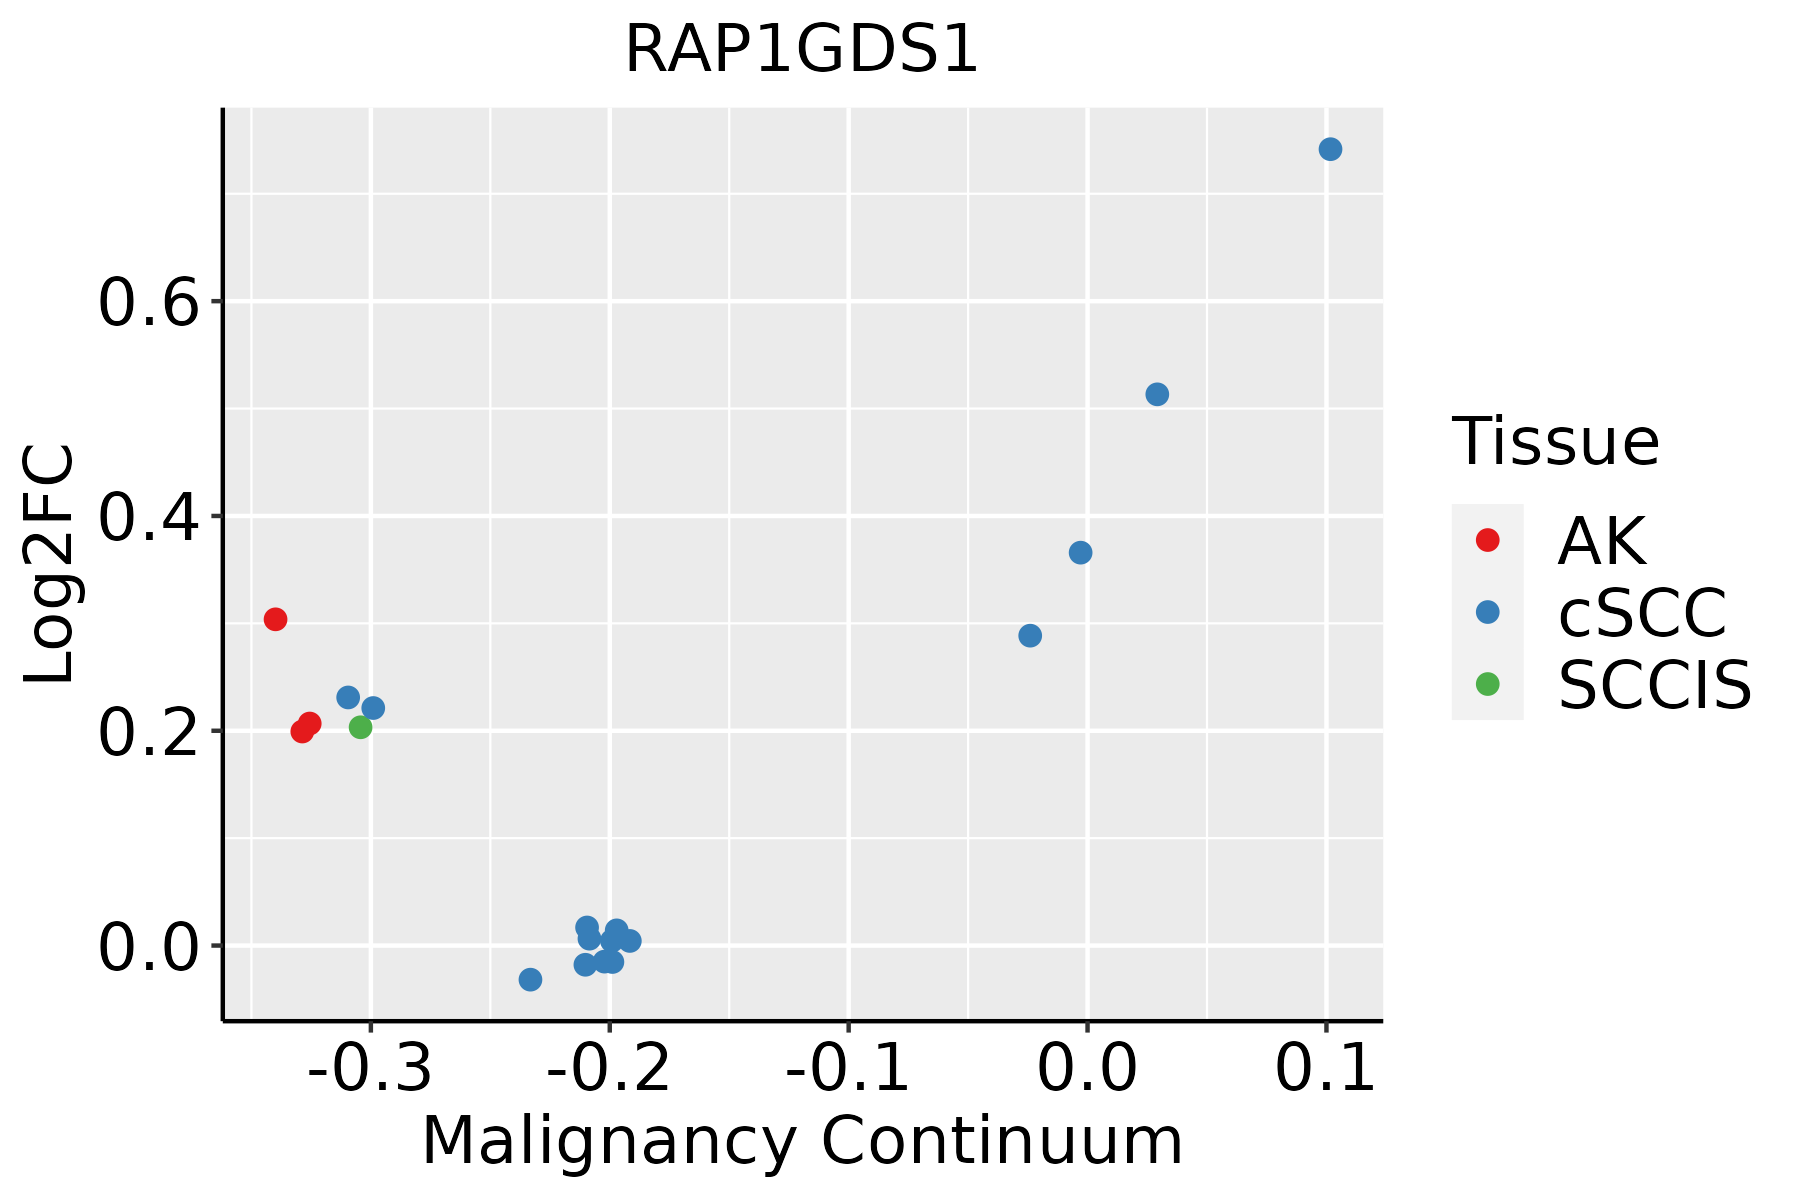
AK: Actinic keratosis
cSCC: Cutaneous squamous cell carcinoma
SCCIS:squamous cell carcinoma in situ
∗log2FC in expression of this searched gene in stem-like cells from each diseased tissue sample relative to stem-like cells in normal samples in each tissue plotted against the malignancy continuum. Samples are colored based on if they are from different disease stage.

Top

Malignant transformation related pathway analysis

check buttonFind out the enriched GO biological processes and KEGG pathways involved in transition from healthy to precancer to cancer
check button Figure of enriched GO biological processes.
TissueDisease StageEnriched GO biological Processes
ColorectumADGO analysis - Figure of enriched GO biological processes: Top 15 enriched GO BP terms are showed in the bar plot of each disease state in each tissue. Each row represents a significant GO biological process which is colored according to the -log10(p.adjust).
ColorectumSERGO analysis - Figure of enriched GO biological processes: Top 15 enriched GO BP terms are showed in the bar plot of each disease state in each tissue. Each row represents a significant GO biological process which is colored according to the -log10(p.adjust).
ColorectumMSSGO analysis - Figure of enriched GO biological processes: Top 15 enriched GO BP terms are showed in the bar plot of each disease state in each tissue. Each row represents a significant GO biological process which is colored according to the -log10(p.adjust).
ColorectumMSI-HGO analysis - Figure of enriched GO biological processes: Top 15 enriched GO BP terms are showed in the bar plot of each disease state in each tissue. Each row represents a significant GO biological process which is colored according to the -log10(p.adjust).
ColorectumFAPGO analysis - Figure of enriched GO biological processes: Top 15 enriched GO BP terms are showed in the bar plot of each disease state in each tissue. Each row represents a significant GO biological process which is colored according to the -log10(p.adjust).
∗Top 15 enriched GO BP terms are showed in the bar plot of each disease state in each tissue. Each row represents a significant GO biological process which is colored according to the -log10(p.adjust).
Page: 1 2 3 4 5 6 7 8 9 

check button Enriched GO biological processes.
GO IDTissueDisease StageDescriptionGene RatioBg Ratiopvaluep.adjustCount
GO:00430877CervixCCregulation of GTPase activity79/2311348/187234.21e-082.60e-0679
GO:00435476CervixCCpositive regulation of GTPase activity53/2311255/187238.72e-051.16e-0353
GO:00324698CervixCCendoplasmic reticulum calcium ion homeostasis10/231125/187234.52e-044.49e-0310
GO:0043087ColorectumADregulation of GTPase activity110/3918348/187231.64e-065.03e-05110
GO:0032469ColorectumADendoplasmic reticulum calcium ion homeostasis16/391825/187233.80e-061.04e-0416
GO:0043547ColorectumADpositive regulation of GTPase activity75/3918255/187237.95e-047.91e-0375
GO:0051560ColorectumADmitochondrial calcium ion homeostasis13/391826/187239.41e-048.92e-0313
GO:00324691ColorectumSERendoplasmic reticulum calcium ion homeostasis13/289725/187232.34e-056.64e-0413
GO:00430871ColorectumSERregulation of GTPase activity77/2897348/187235.90e-048.07e-0377
GO:00515601ColorectumSERmitochondrial calcium ion homeostasis11/289726/187239.60e-041.15e-0211
GO:0003012ColorectumSERmuscle system process92/2897452/187232.98e-032.63e-0292
GO:0051561ColorectumSERpositive regulation of mitochondrial calcium ion concentration6/289711/187233.12e-032.70e-026
GO:00324692ColorectumMSSendoplasmic reticulum calcium ion homeostasis16/346725/187236.86e-072.48e-0516
GO:00430872ColorectumMSSregulation of GTPase activity101/3467348/187231.00e-063.46e-05101
GO:00435471ColorectumMSSpositive regulation of GTPase activity68/3467255/187237.97e-048.38e-0368
GO:00515602ColorectumMSSmitochondrial calcium ion homeostasis12/346726/187231.16e-031.12e-0212
GO:00030121ColorectumMSSmuscle system process105/3467452/187236.39e-034.26e-02105
GO:00515611ColorectumMSSpositive regulation of mitochondrial calcium ion concentration6/346711/187237.89e-034.84e-026
GO:00430873ColorectumFAPregulation of GTPase activity85/2622348/187231.20e-077.68e-0685
GO:00435472ColorectumFAPpositive regulation of GTPase activity61/2622255/187231.39e-053.73e-0461
Page: 1 2 3 

check button Enriched KEGG pathways.
Pathway IDTissueDisease StageDescriptionGene RatioBg Ratiopvaluep.adjustqvalueCount
Page: 1 

Top

Cell-cell communication analysis

check buttonIdentification of potential cell-cell interactions between two cell types and their ligand-receptor pairs for different disease states
LigandReceptorLRpairPathwayTissueDisease Stage
Page: 1 

Top

Single-cell gene regulatory network inference analysis

check buttonFind out the significant the regulons (TFs) and the target genes of each regulon across cell types for different disease states
TFCell TypeTissueDisease StageTarget GeneRSSRegulon Activity
∗The dot plots of a searched regulon are shown for all cell subpopulations in each disease state of each tissue based on the regulon specific score inferred using pySCENIC and by calculating the average expression.
Page: 1 

Top

Somatic mutation of malignant transformation related genes

check buttonAnnotation of somatic variants for genes involved in malignant transformation
Hugo SymbolVariant ClassVariant ClassificationdbSNP RSHGVScHGVSpHGVSp ShortSWISSPROTBIOTYPESIFTPolyPhenTumor Sample BarcodeTissueHistologySexAgeStageTherapy TypesDrugsOutcome
RAP1GDS1SNVMissense_Mutationc.764A>Gp.Asn255Serp.N255SP52306protein_codingtolerated(0.18)benign(0.076)TCGA-A8-A093-01Breastbreast invasive carcinomaFemale<65I/IIHormone TherapytamoxiphenSD
RAP1GDS1SNVMissense_Mutationc.1528N>Cp.Glu510Glnp.E510QP52306protein_codingdeleterious(0)probably_damaging(1)TCGA-AC-A23H-01Breastbreast invasive carcinomaFemale>=65I/IIUnknownUnknownPD
RAP1GDS1SNVMissense_Mutationc.1619N>Gp.His540Argp.H540RP52306protein_codingdeleterious(0.04)benign(0.025)TCGA-D8-A1JD-01Breastbreast invasive carcinomaFemale<65I/IIChemotherapyadriamycinSD
RAP1GDS1SNVMissense_Mutationc.1518N>Gp.Ile506Metp.I506MP52306protein_codingdeleterious(0.01)probably_damaging(0.921)TCGA-EW-A1J3-01Breastbreast invasive carcinomaFemale<65I/IIChemotherapycarboplatinSD
RAP1GDS1deletionFrame_Shift_Delnovelc.893delNp.Leu299TyrfsTer57p.L299Yfs*57P52306protein_codingTCGA-D8-A27V-01Breastbreast invasive carcinomaFemale<65I/IIHormone TherapytamoxiphenSD
RAP1GDS1SNVMissense_Mutationrs377518587c.149G>Ap.Gly50Glup.G50EP52306protein_codingdeleterious(0)probably_damaging(0.954)TCGA-EA-A3HT-01Cervixcervical & endocervical cancerFemale>=65I/IIUnknownUnknownSD
RAP1GDS1insertionIn_Frame_Insnovelc.1287_1288insGAATTCAGTTGTp.Met429_Leu430insGluPheSerCysp.M429_L430insEFSCP52306protein_codingTCGA-DS-A1OA-01Cervixcervical & endocervical cancerFemale>=65I/IIChemotherapycarboplatinPD
RAP1GDS1SNVMissense_Mutationc.568N>Ap.Leu190Metp.L190MP52306protein_codingtolerated(0.19)probably_damaging(0.998)TCGA-AA-3655-01Colorectumcolon adenocarcinomaMale>=65I/IIUnknownUnknownSD
RAP1GDS1SNVMissense_Mutationnovelc.1234N>Ap.Leu412Ilep.L412IP52306protein_codingtolerated(0.07)possibly_damaging(0.756)TCGA-AA-3984-01Colorectumcolon adenocarcinomaFemale<65I/IIUnknownUnknownSD
RAP1GDS1SNVMissense_Mutationc.1598N>Tp.Ala533Valp.A533VP52306protein_codingdeleterious(0.05)possibly_damaging(0.786)TCGA-AY-6197-01Colorectumcolon adenocarcinomaMale<65I/IIUnknownUnknownSD
Page: 1 2 3 4 5 6 7 

Top

Related drugs of malignant transformation related genes

check buttonIdentification of chemicals and drugs interact with genes involved in malignant transfromation
(DGIdb 4.0)
Entrez IDSymbolCategoryInteraction TypesDrug Claim NameDrug NamePMIDs
Page: 1