
|
|||||
|
 | |
| |
| |
| |
| |
| |
|
Gene: RAP1GAP2 |
Gene summary for RAP1GAP2 |
| Gene information | Species | Human | Gene symbol | RAP1GAP2 | Gene ID | 23108 |
| Gene name | RAP1 GTPase activating protein 2 | |
| Gene Alias | GARNL4 | |
| Cytomap | 17p13.3 | |
| Gene Type | protein-coding | GO ID | GO:0002250 | UniProtAcc | Q684P5 |
Top |
Malignant transformation analysis |
| Identification of the aberrant gene expression in precancerous and cancerous lesions by comparing the gene expression of stem-like cells in diseased tissues with normal stem cells |
| Entrez ID | Symbol | Replicates | Species | Organ | Tissue | Adj P-value | Log2FC | Malignancy |
| 23108 | RAP1GAP2 | HTA11_3410_2000001011 | Human | Colorectum | AD | 2.29e-12 | -4.66e-01 | 0.0155 |
| 23108 | RAP1GAP2 | HTA11_5212_2000001011 | Human | Colorectum | AD | 1.16e-02 | -5.11e-01 | -0.2061 |
| 23108 | RAP1GAP2 | HTA11_10711_2000001011 | Human | Colorectum | AD | 6.64e-04 | -4.96e-01 | 0.0338 |
| 23108 | RAP1GAP2 | HTA11_7696_3000711011 | Human | Colorectum | AD | 3.64e-04 | -4.45e-01 | 0.0674 |
| 23108 | RAP1GAP2 | HTA11_99999970781_79442 | Human | Colorectum | MSS | 4.12e-11 | -5.04e-01 | 0.294 |
| 23108 | RAP1GAP2 | HTA11_99999965062_69753 | Human | Colorectum | MSI-H | 1.63e-07 | 8.32e-01 | 0.3487 |
| 23108 | RAP1GAP2 | HTA11_99999971662_82457 | Human | Colorectum | MSS | 3.70e-03 | -3.56e-01 | 0.3859 |
| 23108 | RAP1GAP2 | HTA11_99999973899_84307 | Human | Colorectum | MSS | 2.49e-06 | -7.27e-01 | 0.2585 |
| 23108 | RAP1GAP2 | F007 | Human | Colorectum | FAP | 4.99e-03 | -2.76e-01 | 0.1176 |
| 23108 | RAP1GAP2 | A002-C-010 | Human | Colorectum | FAP | 2.45e-05 | -4.26e-01 | 0.242 |
| 23108 | RAP1GAP2 | A001-C-207 | Human | Colorectum | FAP | 1.63e-05 | -3.55e-01 | 0.1278 |
| 23108 | RAP1GAP2 | A015-C-203 | Human | Colorectum | FAP | 3.44e-37 | -7.67e-01 | -0.1294 |
| 23108 | RAP1GAP2 | A015-C-204 | Human | Colorectum | FAP | 4.95e-19 | -7.04e-01 | -0.0228 |
| 23108 | RAP1GAP2 | A014-C-040 | Human | Colorectum | FAP | 4.77e-06 | -4.58e-01 | -0.1184 |
| 23108 | RAP1GAP2 | A002-C-201 | Human | Colorectum | FAP | 1.65e-21 | -5.65e-01 | 0.0324 |
| 23108 | RAP1GAP2 | A002-C-203 | Human | Colorectum | FAP | 1.32e-05 | -4.19e-01 | 0.2786 |
| 23108 | RAP1GAP2 | A001-C-119 | Human | Colorectum | FAP | 8.94e-09 | -2.57e-01 | -0.1557 |
| 23108 | RAP1GAP2 | A001-C-108 | Human | Colorectum | FAP | 3.96e-21 | -5.11e-01 | -0.0272 |
| 23108 | RAP1GAP2 | A002-C-205 | Human | Colorectum | FAP | 7.41e-31 | -5.28e-01 | -0.1236 |
| 23108 | RAP1GAP2 | A014-C-108 | Human | Colorectum | FAP | 1.08e-06 | -5.43e-01 | -0.124 |
| Page: 1 2 3 |
| Tissue | Expression Dynamics | Abbreviation |
| Colorectum (GSE201348) |  | FAP: Familial adenomatous polyposis |
| CRC: Colorectal cancer | ||
| Colorectum (HTA11) |  | AD: Adenomas |
| SER: Sessile serrated lesions | ||
| MSI-H: Microsatellite-high colorectal cancer | ||
| MSS: Microsatellite stable colorectal cancer | ||
| Endometrium | 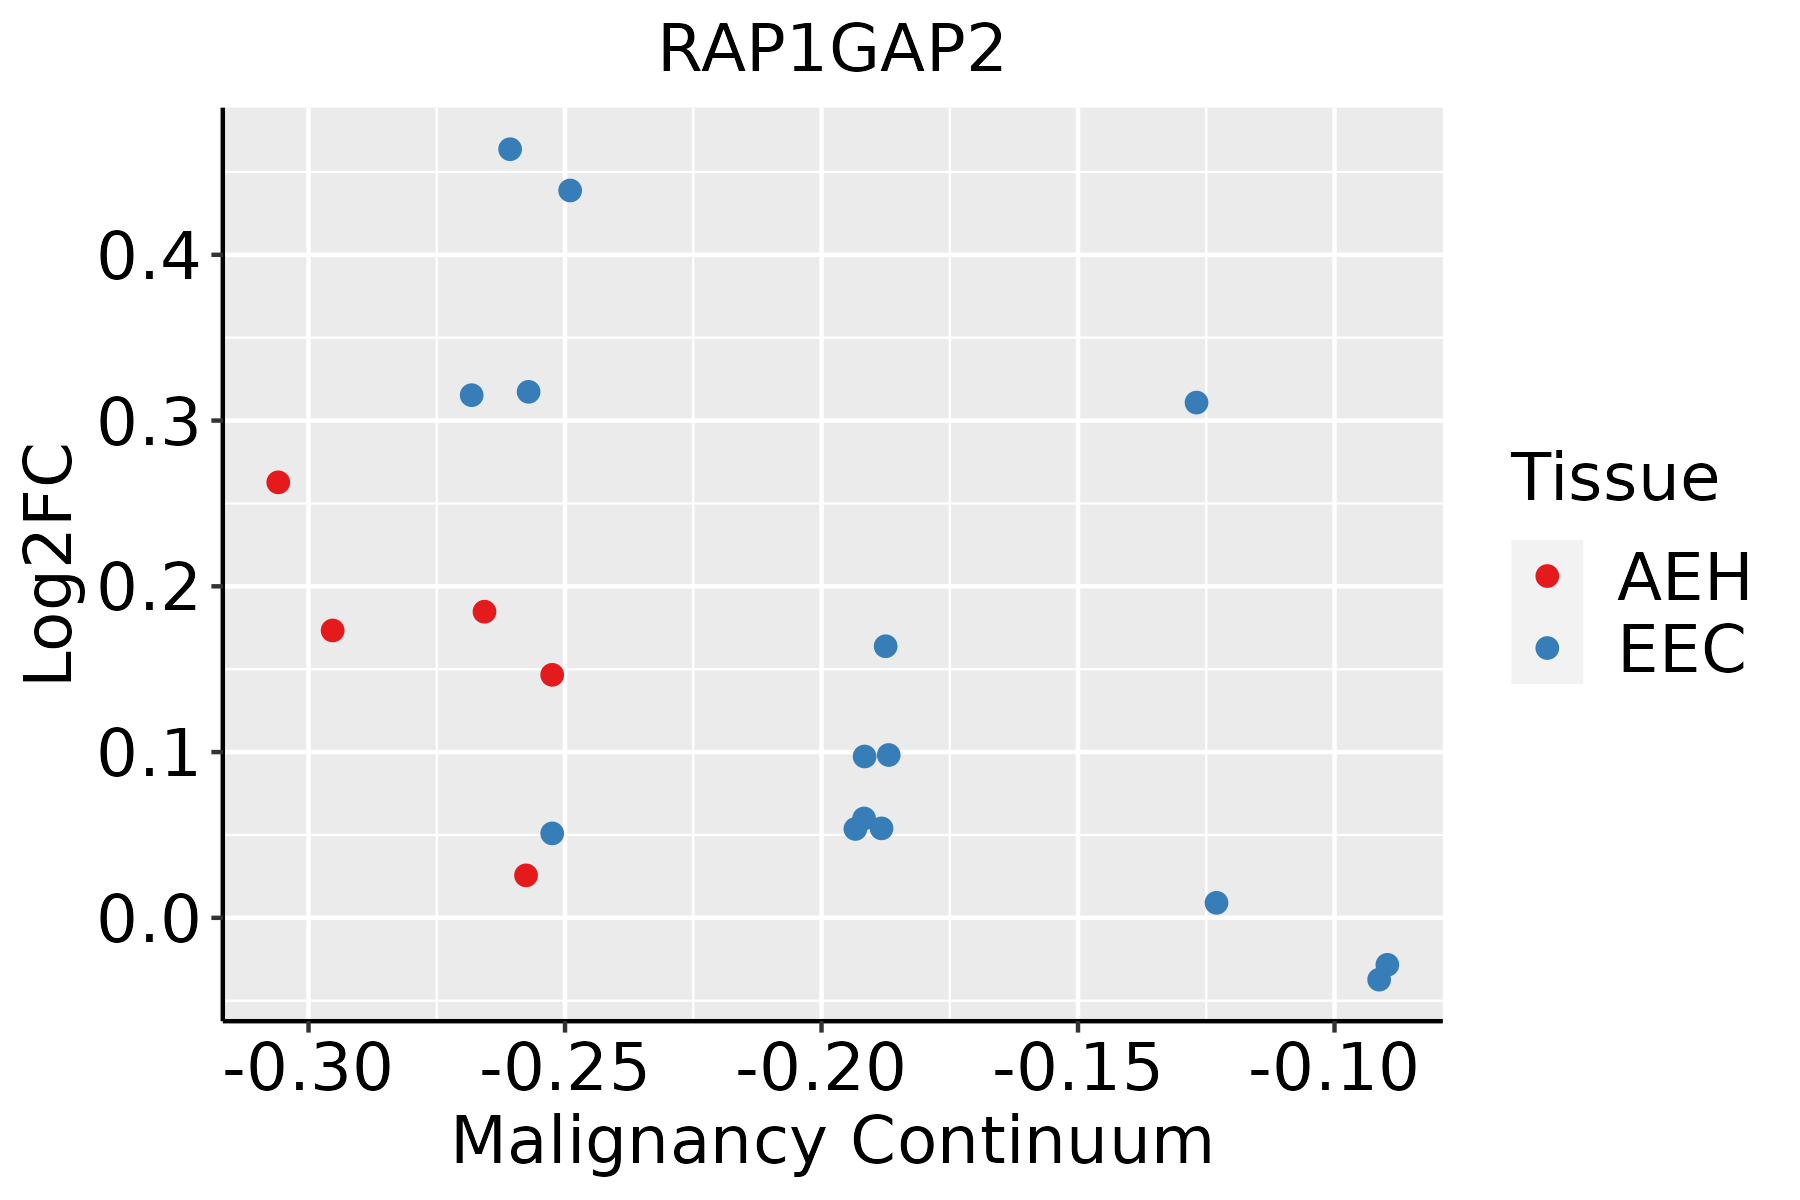 | AEH: Atypical endometrial hyperplasia |
| EEC: Endometrioid Cancer |
| ∗log2FC in expression of this searched gene in stem-like cells from each diseased tissue sample relative to stem-like cells in normal samples in each tissue plotted against the malignancy continuum. Samples are colored based on if they are from different disease stage. |
Top |
Malignant transformation related pathway analysis |
| Find out the enriched GO biological processes and KEGG pathways involved in transition from healthy to precancer to cancer |
| Tissue | Disease Stage | Enriched GO biological Processes |
| Colorectum | AD |  |
| Colorectum | SER |  |
| Colorectum | MSS |  |
| Colorectum | MSI-H |  |
| Colorectum | FAP |  |
| ∗Top 15 enriched GO BP terms are showed in the bar plot of each disease state in each tissue. Each row represents a significant GO biological process which is colored according to the -log10(p.adjust). |
| Page: 1 2 3 4 5 6 7 8 9 |
| GO ID | Tissue | Disease Stage | Description | Gene Ratio | Bg Ratio | pvalue | p.adjust | Count |
| GO:0032535 | Colorectum | AD | regulation of cellular component size | 142/3918 | 383/18723 | 1.74e-13 | 3.41e-11 | 142 |
| GO:0043087 | Colorectum | AD | regulation of GTPase activity | 110/3918 | 348/18723 | 1.64e-06 | 5.03e-05 | 110 |
| GO:0051056 | Colorectum | AD | regulation of small GTPase mediated signal transduction | 94/3918 | 302/18723 | 1.81e-05 | 3.76e-04 | 94 |
| GO:0043547 | Colorectum | AD | positive regulation of GTPase activity | 75/3918 | 255/18723 | 7.95e-04 | 7.91e-03 | 75 |
| GO:0008361 | Colorectum | AD | regulation of cell size | 56/3918 | 181/18723 | 9.61e-04 | 9.07e-03 | 56 |
| GO:00325352 | Colorectum | MSS | regulation of cellular component size | 127/3467 | 383/18723 | 3.44e-12 | 5.79e-10 | 127 |
| GO:00430872 | Colorectum | MSS | regulation of GTPase activity | 101/3467 | 348/18723 | 1.00e-06 | 3.46e-05 | 101 |
| GO:00510561 | Colorectum | MSS | regulation of small GTPase mediated signal transduction | 82/3467 | 302/18723 | 1.31e-04 | 1.99e-03 | 82 |
| GO:00435471 | Colorectum | MSS | positive regulation of GTPase activity | 68/3467 | 255/18723 | 7.97e-04 | 8.38e-03 | 68 |
| GO:00083611 | Colorectum | MSS | regulation of cell size | 50/3467 | 181/18723 | 1.65e-03 | 1.49e-02 | 50 |
| GO:00325353 | Colorectum | FAP | regulation of cellular component size | 99/2622 | 383/18723 | 4.53e-10 | 1.16e-07 | 99 |
| GO:00510562 | Colorectum | FAP | regulation of small GTPase mediated signal transduction | 78/2622 | 302/18723 | 3.25e-08 | 2.85e-06 | 78 |
| GO:00430873 | Colorectum | FAP | regulation of GTPase activity | 85/2622 | 348/18723 | 1.20e-07 | 7.68e-06 | 85 |
| GO:00435472 | Colorectum | FAP | positive regulation of GTPase activity | 61/2622 | 255/18723 | 1.39e-05 | 3.73e-04 | 61 |
| GO:00083612 | Colorectum | FAP | regulation of cell size | 44/2622 | 181/18723 | 1.40e-04 | 2.21e-03 | 44 |
| GO:0090630 | Colorectum | FAP | activation of GTPase activity | 27/2622 | 115/18723 | 4.23e-03 | 2.90e-02 | 27 |
| GO:00510563 | Colorectum | CRC | regulation of small GTPase mediated signal transduction | 69/2078 | 302/18723 | 3.34e-09 | 9.08e-07 | 69 |
| GO:00325354 | Colorectum | CRC | regulation of cellular component size | 79/2078 | 383/18723 | 3.30e-08 | 4.60e-06 | 79 |
| GO:00430874 | Colorectum | CRC | regulation of GTPase activity | 69/2078 | 348/18723 | 1.11e-06 | 6.69e-05 | 69 |
| GO:00435473 | Colorectum | CRC | positive regulation of GTPase activity | 49/2078 | 255/18723 | 8.67e-05 | 1.77e-03 | 49 |
| Page: 1 2 |
| Pathway ID | Tissue | Disease Stage | Description | Gene Ratio | Bg Ratio | pvalue | p.adjust | qvalue | Count |
| Page: 1 |
Top |
Cell-cell communication analysis |
| Identification of potential cell-cell interactions between two cell types and their ligand-receptor pairs for different disease states |
| Ligand | Receptor | LRpair | Pathway | Tissue | Disease Stage |
| Page: 1 |
Top |
Single-cell gene regulatory network inference analysis |
| Find out the significant the regulons (TFs) and the target genes of each regulon across cell types for different disease states |
| TF | Cell Type | Tissue | Disease Stage | Target Gene | RSS | Regulon Activity |
| ∗The dot plots of a searched regulon are shown for all cell subpopulations in each disease state of each tissue based on the regulon specific score inferred using pySCENIC and by calculating the average expression. |
| Page: 1 |
Top |
Somatic mutation of malignant transformation related genes |
| Annotation of somatic variants for genes involved in malignant transformation |
| Hugo Symbol | Variant Class | Variant Classification | dbSNP RS | HGVSc | HGVSp | HGVSp Short | SWISSPROT | BIOTYPE | SIFT | PolyPhen | Tumor Sample Barcode | Tissue | Histology | Sex | Age | Stage | Therapy Types | Drugs | Outcome |
| RAP1GAP2 | SNV | Missense_Mutation | rs778744234 | c.1337N>T | p.Ser446Leu | p.S446L | Q684P5 | protein_coding | deleterious(0) | possibly_damaging(0.821) | TCGA-EA-A3HS-01 | Cervix | cervical & endocervical cancer | Female | <65 | I/II | Unknown | Unknown | SD |
| RAP1GAP2 | SNV | Missense_Mutation | c.1688G>T | p.Arg563Leu | p.R563L | Q684P5 | protein_coding | deleterious(0) | possibly_damaging(0.674) | TCGA-IR-A3LL-01 | Cervix | cervical & endocervical cancer | Female | <65 | I/II | Chemotherapy | cisplatin | CR | |
| RAP1GAP2 | SNV | Missense_Mutation | rs867183095 | c.11N>A | p.Arg4Gln | p.R4Q | Q684P5 | protein_coding | deleterious(0) | possibly_damaging(0.885) | TCGA-VS-A950-01 | Cervix | cervical & endocervical cancer | Female | <65 | III/IV | Unknown | Unknown | SD |
| RAP1GAP2 | SNV | Missense_Mutation | rs748481508 | c.1324N>A | p.Ala442Thr | p.A442T | Q684P5 | protein_coding | deleterious(0) | possibly_damaging(0.838) | TCGA-AA-3492-01 | Colorectum | colon adenocarcinoma | Female | >=65 | I/II | Unknown | Unknown | SD |
| RAP1GAP2 | SNV | Missense_Mutation | rs776195452 | c.1991N>T | p.Pro664Leu | p.P664L | Q684P5 | protein_coding | tolerated(0.11) | benign(0.092) | TCGA-AD-6895-01 | Colorectum | colon adenocarcinoma | Male | >=65 | III/IV | Unknown | Unknown | SD |
| RAP1GAP2 | SNV | Missense_Mutation | rs771141288 | c.1511N>A | p.Arg504His | p.R504H | Q684P5 | protein_coding | deleterious(0) | possibly_damaging(0.781) | TCGA-AZ-4315-01 | Colorectum | colon adenocarcinoma | Male | <65 | I/II | Unknown | Unknown | SD |
| RAP1GAP2 | SNV | Missense_Mutation | rs200075336 | c.2183C>T | p.Ala728Val | p.A728V | Q684P5 | protein_coding | tolerated_low_confidence(0.25) | benign(0.013) | TCGA-D5-6930-01 | Colorectum | colon adenocarcinoma | Male | >=65 | I/II | Unknown | Unknown | SD |
| RAP1GAP2 | SNV | Missense_Mutation | novel | c.1024A>G | p.Thr342Ala | p.T342A | Q684P5 | protein_coding | deleterious(0.01) | benign(0.209) | TCGA-G4-6588-01 | Colorectum | colon adenocarcinoma | Female | <65 | I/II | Unknown | Unknown | SD |
| RAP1GAP2 | SNV | Missense_Mutation | c.445N>A | p.Glu149Lys | p.E149K | Q684P5 | protein_coding | deleterious(0) | possibly_damaging(0.447) | TCGA-AG-A002-01 | Colorectum | rectum adenocarcinoma | Male | <65 | I/II | Unknown | Unknown | SD | |
| RAP1GAP2 | SNV | Missense_Mutation | c.609N>T | p.Lys203Asn | p.K203N | Q684P5 | protein_coding | deleterious(0.04) | benign(0.439) | TCGA-AG-A002-01 | Colorectum | rectum adenocarcinoma | Male | <65 | I/II | Unknown | Unknown | SD |
| Page: 1 2 3 4 5 6 7 |
Top |
Related drugs of malignant transformation related genes |
| Identification of chemicals and drugs interact with genes involved in malignant transfromation |
| (DGIdb 4.0) |
| Entrez ID | Symbol | Category | Interaction Types | Drug Claim Name | Drug Name | PMIDs |
| Page: 1 |

Copyright 2023-Present -The University of Texas Health Science Center at Houston |