
|
|||||
|
 | |
| |
| |
| |
| |
| |
|
Gene: RAP1GAP |
Gene summary for RAP1GAP |
| Gene information | Species | Human | Gene symbol | RAP1GAP | Gene ID | 5909 |
| Gene name | RAP1 GTPase activating protein | |
| Gene Alias | RAP1GA1 | |
| Cytomap | 1p36.12 | |
| Gene Type | protein-coding | GO ID | GO:0002250 | UniProtAcc | P47736 |
Top |
Malignant transformation analysis |
| Identification of the aberrant gene expression in precancerous and cancerous lesions by comparing the gene expression of stem-like cells in diseased tissues with normal stem cells |
| Entrez ID | Symbol | Replicates | Species | Organ | Tissue | Adj P-value | Log2FC | Malignancy |
| 5909 | RAP1GAP | HTA11_2487_2000001011 | Human | Colorectum | SER | 3.62e-03 | 2.58e-01 | -0.1808 |
| 5909 | RAP1GAP | HTA11_1938_2000001011 | Human | Colorectum | AD | 2.63e-02 | 2.24e-01 | -0.0811 |
| 5909 | RAP1GAP | HTA11_78_2000001011 | Human | Colorectum | AD | 1.80e-05 | 2.69e-01 | -0.1088 |
| 5909 | RAP1GAP | HTA11_411_2000001011 | Human | Colorectum | SER | 2.82e-02 | 4.97e-01 | -0.2602 |
| 5909 | RAP1GAP | HTA11_2112_2000001011 | Human | Colorectum | SER | 9.66e-04 | 3.29e-01 | -0.2196 |
| 5909 | RAP1GAP | HTA11_3361_2000001011 | Human | Colorectum | AD | 2.65e-03 | 2.38e-01 | -0.1207 |
| 5909 | RAP1GAP | HTA11_696_2000001011 | Human | Colorectum | AD | 1.09e-07 | 3.74e-01 | -0.1464 |
| 5909 | RAP1GAP | HTA11_866_2000001011 | Human | Colorectum | AD | 1.71e-05 | 2.63e-01 | -0.1001 |
| 5909 | RAP1GAP | HTA11_1391_2000001011 | Human | Colorectum | AD | 2.60e-02 | 1.61e-01 | -0.059 |
| 5909 | RAP1GAP | HTA11_546_2000001011 | Human | Colorectum | AD | 2.59e-02 | 3.94e-01 | -0.0842 |
| 5909 | RAP1GAP | HTA11_99999971662_82457 | Human | Colorectum | MSS | 4.07e-04 | 1.38e-01 | 0.3859 |
| 5909 | RAP1GAP | HTA11_99999974143_84620 | Human | Colorectum | MSS | 2.17e-02 | 1.21e-01 | 0.3005 |
| 5909 | RAP1GAP | HCC1_Meng | Human | Liver | HCC | 1.35e-22 | -9.71e-02 | 0.0246 |
| 5909 | RAP1GAP | HCC2_Meng | Human | Liver | HCC | 9.77e-10 | -2.51e-02 | 0.0107 |
| 5909 | RAP1GAP | HCC2 | Human | Liver | HCC | 8.52e-18 | 3.50e+00 | 0.5341 |
| 5909 | RAP1GAP | S027 | Human | Liver | HCC | 1.11e-12 | 1.47e+00 | 0.2446 |
| 5909 | RAP1GAP | S028 | Human | Liver | HCC | 2.87e-38 | 1.94e+00 | 0.2503 |
| 5909 | RAP1GAP | S029 | Human | Liver | HCC | 5.71e-28 | 1.75e+00 | 0.2581 |
| 5909 | RAP1GAP | PTCwithHT_6 | Human | Thyroid | HT | 8.62e-03 | -2.18e-01 | 0.02 |
| 5909 | RAP1GAP | male-WTA | Human | Thyroid | PTC | 5.48e-04 | -5.88e-02 | 0.1037 |
| Page: 1 2 |
| Tissue | Expression Dynamics | Abbreviation |
| Colorectum (GSE201348) |  | FAP: Familial adenomatous polyposis |
| CRC: Colorectal cancer | ||
| Colorectum (HTA11) | 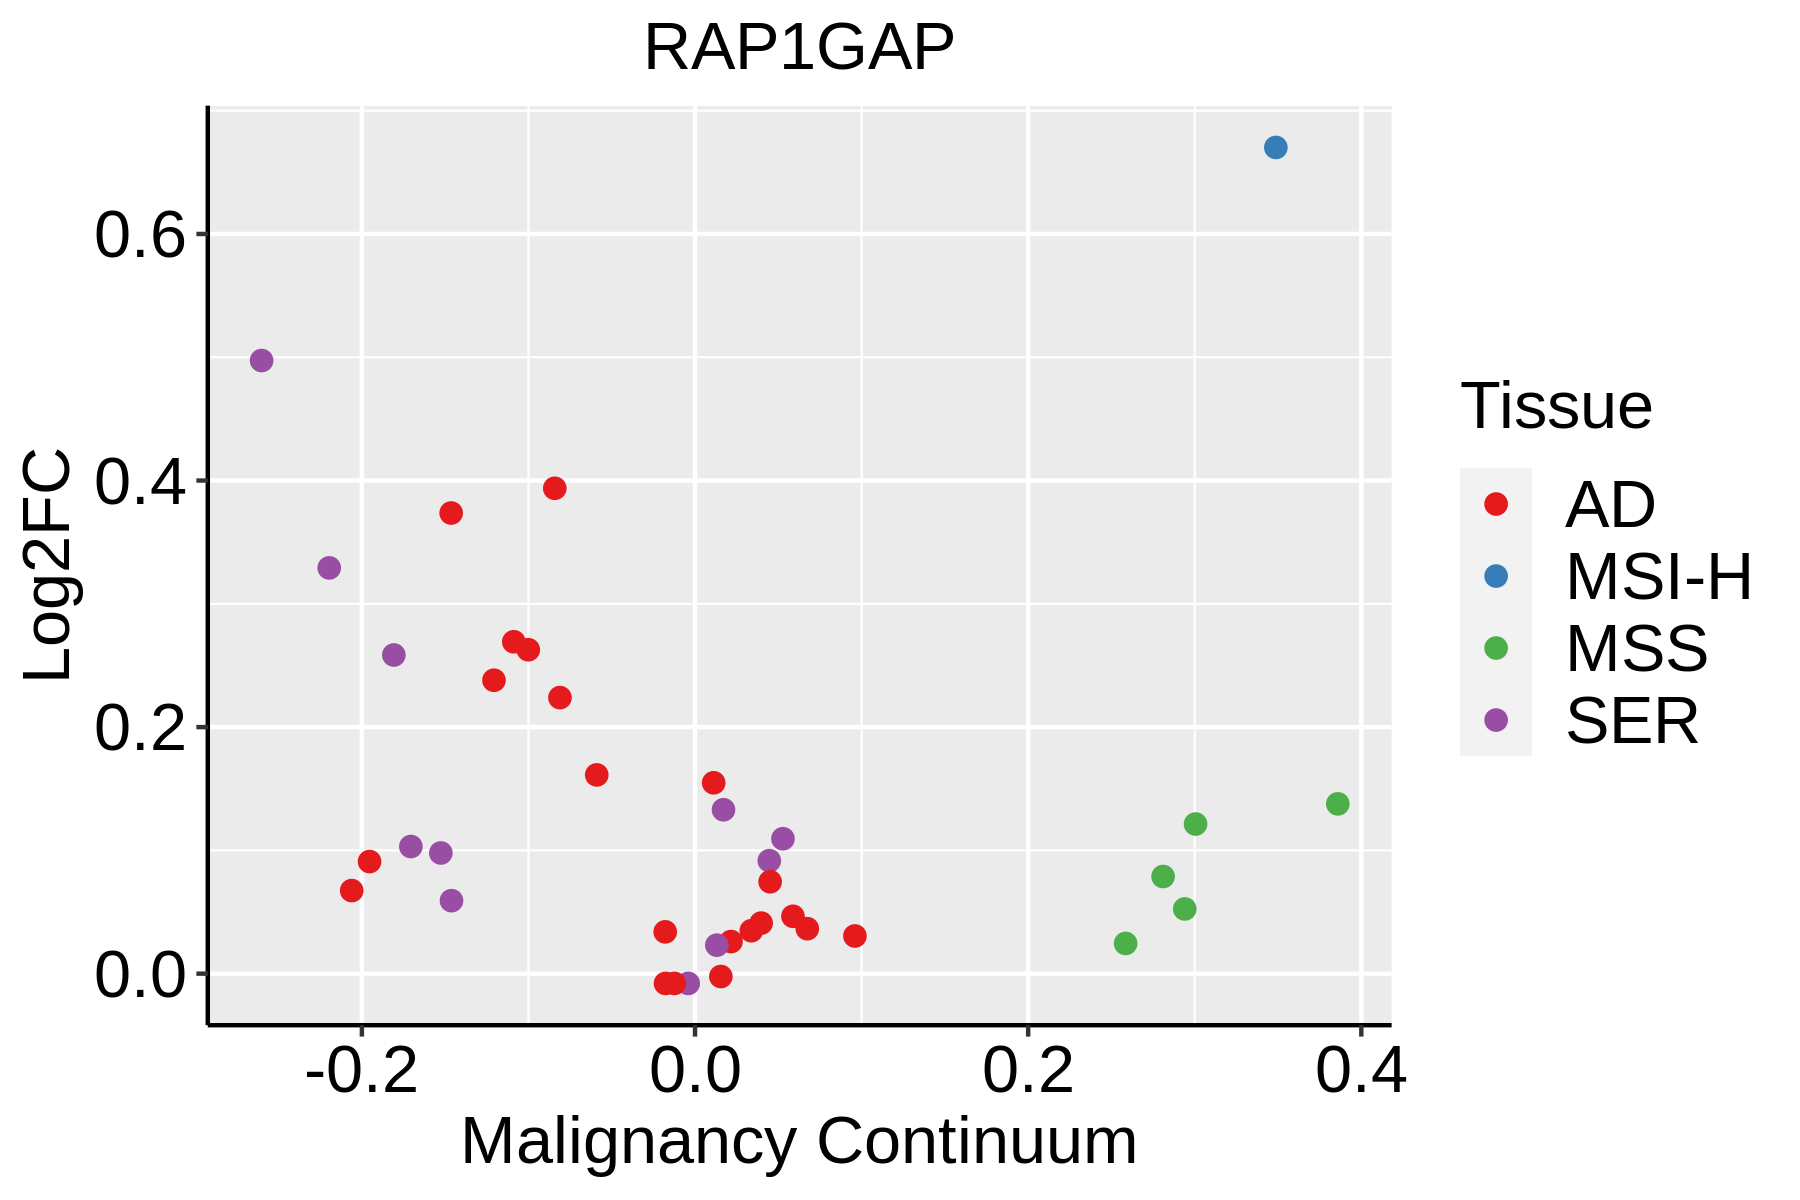 | AD: Adenomas |
| SER: Sessile serrated lesions | ||
| MSI-H: Microsatellite-high colorectal cancer | ||
| MSS: Microsatellite stable colorectal cancer | ||
| Liver | 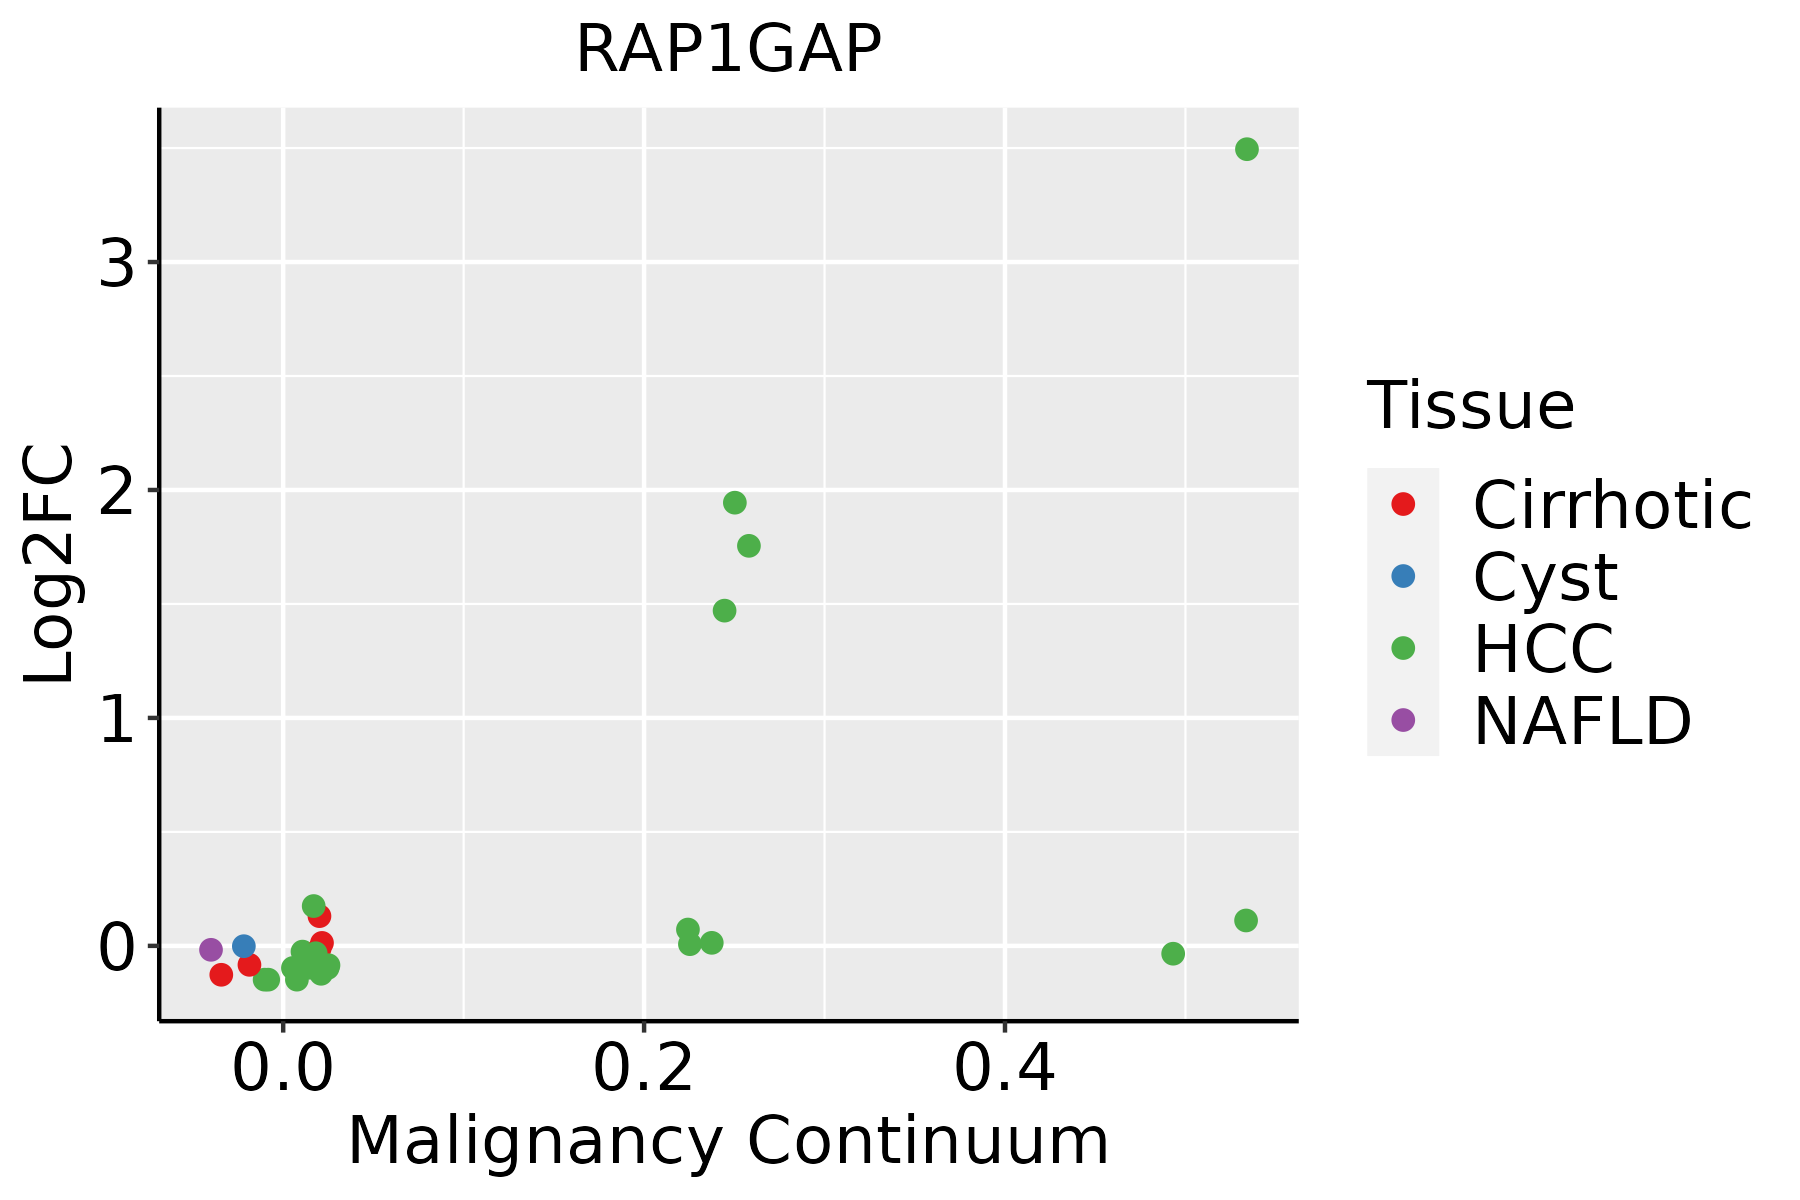 | HCC: Hepatocellular carcinoma |
| NAFLD: Non-alcoholic fatty liver disease | ||
| Thyroid | 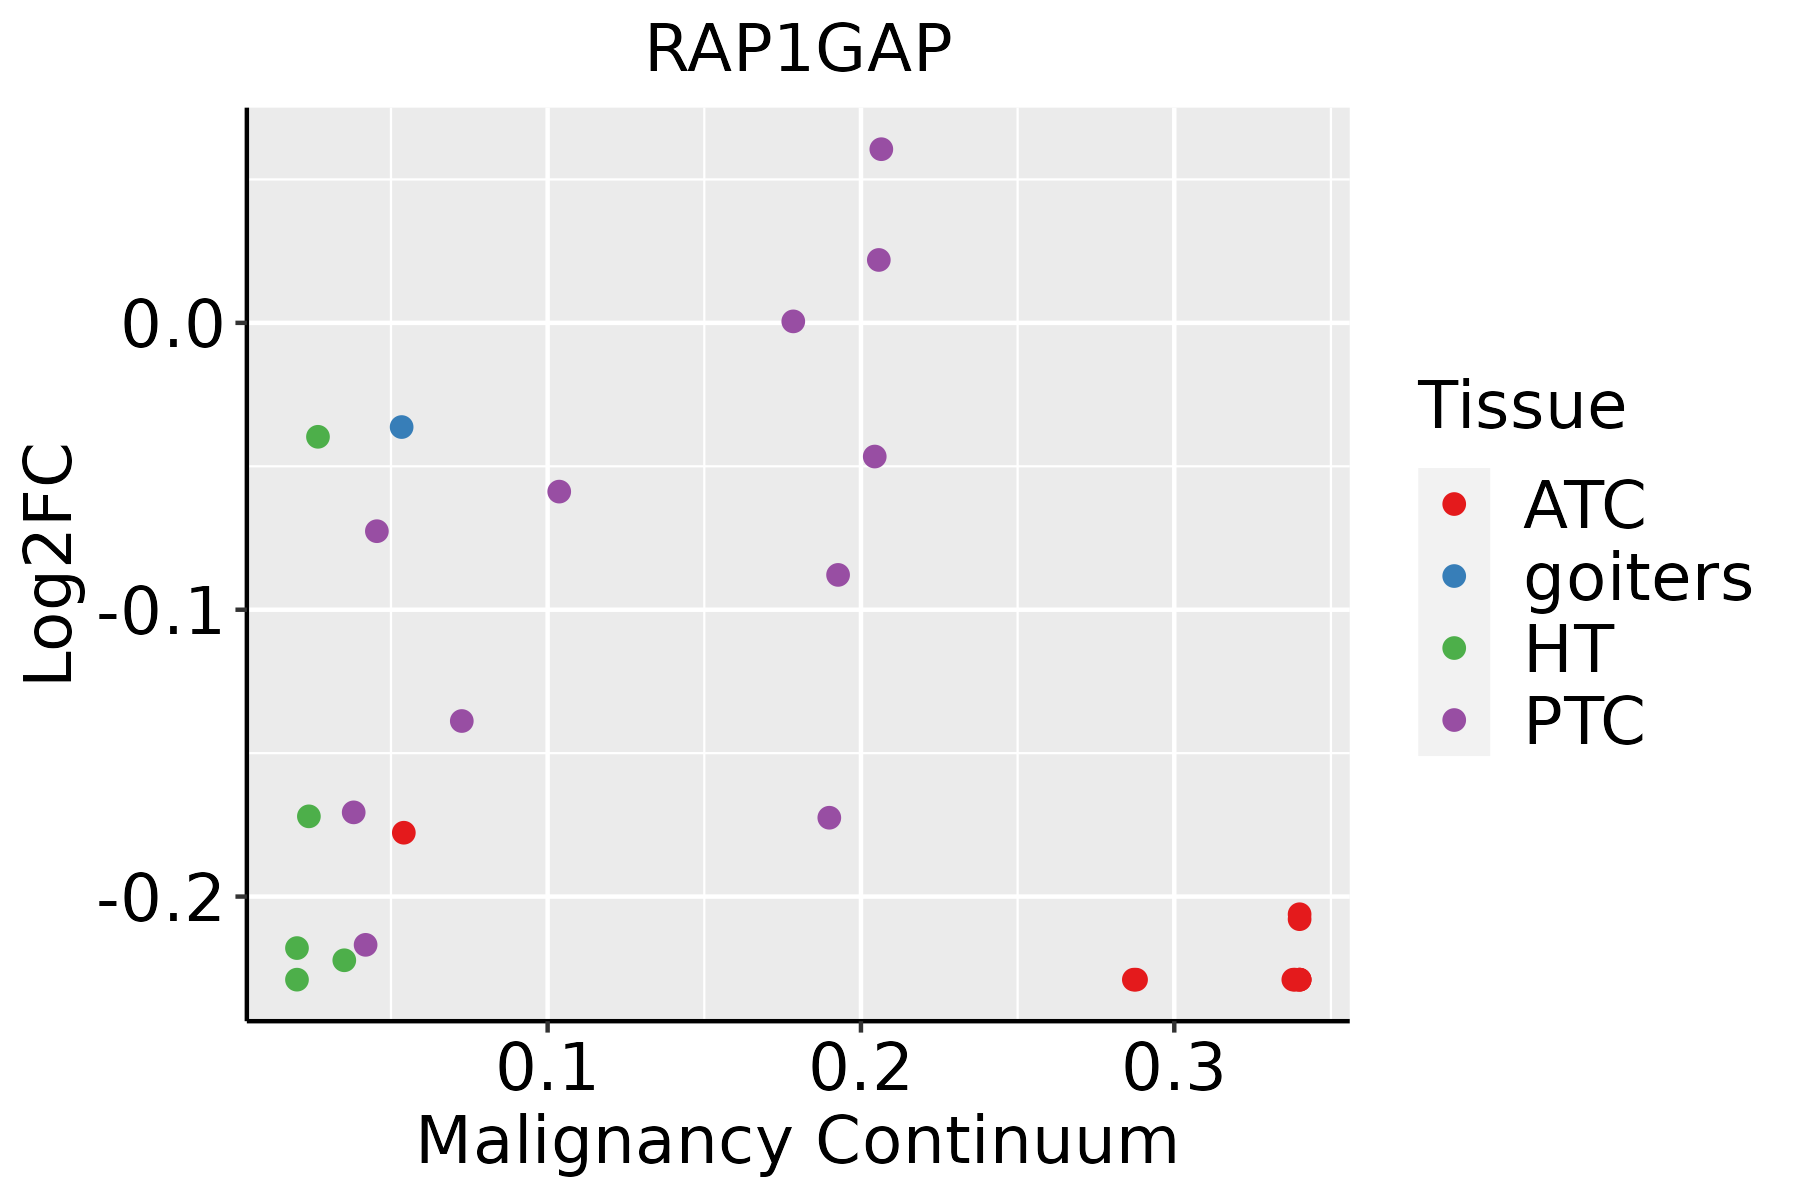 | ATC: Anaplastic thyroid cancer |
| HT: Hashimoto's thyroiditis | ||
| PTC: Papillary thyroid cancer |
| ∗log2FC in expression of this searched gene in stem-like cells from each diseased tissue sample relative to stem-like cells in normal samples in each tissue plotted against the malignancy continuum. Samples are colored based on if they are from different disease stage. |
Top |
Malignant transformation related pathway analysis |
| Find out the enriched GO biological processes and KEGG pathways involved in transition from healthy to precancer to cancer |
| Tissue | Disease Stage | Enriched GO biological Processes |
| Colorectum | AD |  |
| Colorectum | SER |  |
| Colorectum | MSS |  |
| Colorectum | MSI-H |  |
| Colorectum | FAP |  |
| ∗Top 15 enriched GO BP terms are showed in the bar plot of each disease state in each tissue. Each row represents a significant GO biological process which is colored according to the -log10(p.adjust). |
| Page: 1 2 3 4 5 6 7 8 9 |
| GO ID | Tissue | Disease Stage | Description | Gene Ratio | Bg Ratio | pvalue | p.adjust | Count |
| GO:0032535 | Colorectum | AD | regulation of cellular component size | 142/3918 | 383/18723 | 1.74e-13 | 3.41e-11 | 142 |
| GO:0048732 | Colorectum | AD | gland development | 149/3918 | 436/18723 | 6.07e-11 | 6.33e-09 | 149 |
| GO:0051098 | Colorectum | AD | regulation of binding | 126/3918 | 363/18723 | 6.01e-10 | 4.88e-08 | 126 |
| GO:0043087 | Colorectum | AD | regulation of GTPase activity | 110/3918 | 348/18723 | 1.64e-06 | 5.03e-05 | 110 |
| GO:0051056 | Colorectum | AD | regulation of small GTPase mediated signal transduction | 94/3918 | 302/18723 | 1.81e-05 | 3.76e-04 | 94 |
| GO:0032530 | Colorectum | AD | regulation of microvillus organization | 10/3918 | 13/18723 | 2.43e-05 | 4.69e-04 | 10 |
| GO:0032528 | Colorectum | AD | microvillus organization | 14/3918 | 24/18723 | 6.90e-05 | 1.11e-03 | 14 |
| GO:0031345 | Colorectum | AD | negative regulation of cell projection organization | 58/3918 | 186/18723 | 6.37e-04 | 6.58e-03 | 58 |
| GO:0043547 | Colorectum | AD | positive regulation of GTPase activity | 75/3918 | 255/18723 | 7.95e-04 | 7.91e-03 | 75 |
| GO:0050673 | Colorectum | AD | epithelial cell proliferation | 119/3918 | 437/18723 | 8.75e-04 | 8.51e-03 | 119 |
| GO:0008361 | Colorectum | AD | regulation of cell size | 56/3918 | 181/18723 | 9.61e-04 | 9.07e-03 | 56 |
| GO:0051100 | Colorectum | AD | negative regulation of binding | 50/3918 | 162/18723 | 1.84e-03 | 1.51e-02 | 50 |
| GO:0030033 | Colorectum | AD | microvillus assembly | 9/3918 | 16/18723 | 2.06e-03 | 1.64e-02 | 9 |
| GO:0120032 | Colorectum | AD | regulation of plasma membrane bounded cell projection assembly | 53/3918 | 186/18723 | 8.51e-03 | 4.97e-02 | 53 |
| GO:00487321 | Colorectum | SER | gland development | 112/2897 | 436/18723 | 1.75e-08 | 1.28e-06 | 112 |
| GO:00510981 | Colorectum | SER | regulation of binding | 97/2897 | 363/18723 | 1.98e-08 | 1.43e-06 | 97 |
| GO:00325301 | Colorectum | SER | regulation of microvillus organization | 10/2897 | 13/18723 | 1.41e-06 | 6.46e-05 | 10 |
| GO:00325281 | Colorectum | SER | microvillus organization | 14/2897 | 24/18723 | 1.83e-06 | 7.80e-05 | 14 |
| GO:00300331 | Colorectum | SER | microvillus assembly | 9/2897 | 16/18723 | 2.03e-04 | 3.68e-03 | 9 |
| GO:00430871 | Colorectum | SER | regulation of GTPase activity | 77/2897 | 348/18723 | 5.90e-04 | 8.07e-03 | 77 |
| Page: 1 2 3 4 5 |
| Pathway ID | Tissue | Disease Stage | Description | Gene Ratio | Bg Ratio | pvalue | p.adjust | qvalue | Count |
| hsa04015 | Colorectum | AD | Rap1 signaling pathway | 71/2092 | 210/8465 | 1.72e-03 | 9.68e-03 | 6.18e-03 | 71 |
| hsa040151 | Colorectum | AD | Rap1 signaling pathway | 71/2092 | 210/8465 | 1.72e-03 | 9.68e-03 | 6.18e-03 | 71 |
| hsa040152 | Colorectum | SER | Rap1 signaling pathway | 54/1580 | 210/8465 | 6.55e-03 | 3.68e-02 | 2.67e-02 | 54 |
| hsa040153 | Colorectum | SER | Rap1 signaling pathway | 54/1580 | 210/8465 | 6.55e-03 | 3.68e-02 | 2.67e-02 | 54 |
| hsa040154 | Colorectum | MSS | Rap1 signaling pathway | 66/1875 | 210/8465 | 1.03e-03 | 5.94e-03 | 3.64e-03 | 66 |
| hsa040155 | Colorectum | MSS | Rap1 signaling pathway | 66/1875 | 210/8465 | 1.03e-03 | 5.94e-03 | 3.64e-03 | 66 |
| Page: 1 |
Top |
Cell-cell communication analysis |
| Identification of potential cell-cell interactions between two cell types and their ligand-receptor pairs for different disease states |
| Ligand | Receptor | LRpair | Pathway | Tissue | Disease Stage |
| Page: 1 |
Top |
Single-cell gene regulatory network inference analysis |
| Find out the significant the regulons (TFs) and the target genes of each regulon across cell types for different disease states |
| TF | Cell Type | Tissue | Disease Stage | Target Gene | RSS | Regulon Activity |
| ∗The dot plots of a searched regulon are shown for all cell subpopulations in each disease state of each tissue based on the regulon specific score inferred using pySCENIC and by calculating the average expression. |
| Page: 1 |
Top |
Somatic mutation of malignant transformation related genes |
| Annotation of somatic variants for genes involved in malignant transformation |
| Hugo Symbol | Variant Class | Variant Classification | dbSNP RS | HGVSc | HGVSp | HGVSp Short | SWISSPROT | BIOTYPE | SIFT | PolyPhen | Tumor Sample Barcode | Tissue | Histology | Sex | Age | Stage | Therapy Types | Drugs | Outcome |
| RAP1GAP | SNV | Missense_Mutation | novel | c.808N>G | p.Thr270Ala | p.T270A | protein_coding | deleterious(0) | probably_damaging(0.982) | TCGA-AC-A3YI-01 | Breast | breast invasive carcinoma | Female | >=65 | III/IV | Chemotherapy | cytoxan | CR | |
| RAP1GAP | SNV | Missense_Mutation | novel | c.455A>T | p.Asn152Ile | p.N152I | protein_coding | deleterious(0.02) | probably_damaging(0.999) | TCGA-LL-A8F5-01 | Breast | breast invasive carcinoma | Female | <65 | I/II | Chemotherapy | cyclophosphamide | SD | |
| RAP1GAP | insertion | Frame_Shift_Ins | novel | c.853_854insCCTCCCGT | p.Lys285ThrfsTer27 | p.K285Tfs*27 | protein_coding | TCGA-A2-A0CT-01 | Breast | breast invasive carcinoma | Female | >=65 | I/II | Chemotherapy | cytoxan | SD | |||
| RAP1GAP | insertion | Frame_Shift_Ins | novel | c.852_853insTATCACTGTCCTCC | p.Lys285TyrfsTer29 | p.K285Yfs*29 | protein_coding | TCGA-A2-A0CT-01 | Breast | breast invasive carcinoma | Female | >=65 | I/II | Chemotherapy | cytoxan | SD | |||
| RAP1GAP | insertion | In_Frame_Ins | novel | c.1817_1818insTTTGAGAGG | p.Lys606delinsAsnLeuArgGly | p.K606delinsNLRG | protein_coding | TCGA-AQ-A04J-01 | Breast | breast invasive carcinoma | Female | <65 | I/II | Chemotherapy | cytoxan | SD | |||
| RAP1GAP | deletion | Frame_Shift_Del | novel | c.754delA | p.Thr252ProfsTer57 | p.T252Pfs*57 | protein_coding | TCGA-D8-A27V-01 | Breast | breast invasive carcinoma | Female | <65 | I/II | Hormone Therapy | tamoxiphen | SD | |||
| RAP1GAP | deletion | Frame_Shift_Del | novel | c.128delC | p.Ser43TyrfsTer3 | p.S43Yfs*3 | P47736 | protein_coding | TCGA-EW-A2FV-01 | Breast | breast invasive carcinoma | Female | <65 | III/IV | Chemotherapy | docetaxel | SD | ||
| RAP1GAP | SNV | Missense_Mutation | rs776739159 | c.1594G>A | p.Val532Ile | p.V532I | protein_coding | tolerated_low_confidence(0.61) | benign(0.021) | TCGA-2W-A8YY-01 | Cervix | cervical & endocervical cancer | Female | <65 | I/II | Chemotherapy | cisplatin | CR | |
| RAP1GAP | SNV | Missense_Mutation | rs145342478 | c.40C>T | p.Arg14Cys | p.R14C | protein_coding | deleterious(0) | probably_damaging(0.997) | TCGA-2W-A8YY-01 | Cervix | cervical & endocervical cancer | Female | <65 | I/II | Chemotherapy | cisplatin | CR | |
| RAP1GAP | SNV | Missense_Mutation | c.1166N>T | p.Thr389Met | p.T389M | protein_coding | deleterious(0.01) | probably_damaging(1) | TCGA-C5-A1BJ-01 | Cervix | cervical & endocervical cancer | Female | <65 | I/II | Unknown | Unknown | SD |
| Page: 1 2 3 4 5 6 7 8 9 |
Top |
Related drugs of malignant transformation related genes |
| Identification of chemicals and drugs interact with genes involved in malignant transfromation |
| (DGIdb 4.0) |
| Entrez ID | Symbol | Category | Interaction Types | Drug Claim Name | Drug Name | PMIDs |
| Page: 1 |

Copyright 2023-Present -The University of Texas Health Science Center at Houston |