
|
|||||
|
 | |
| |
| |
| |
| |
| |
|
Gene: RAP1B |
Gene summary for RAP1B |
| Gene information | Species | Human | Gene symbol | RAP1B | Gene ID | 5908 |
| Gene name | RAP1B, member of RAS oncogene family | |
| Gene Alias | K-REV | |
| Cytomap | 12q15 | |
| Gene Type | protein-coding | GO ID | GO:0000165 | UniProtAcc | A0A024RB87 |
Top |
Malignant transformation analysis |
| Identification of the aberrant gene expression in precancerous and cancerous lesions by comparing the gene expression of stem-like cells in diseased tissues with normal stem cells |
| Entrez ID | Symbol | Replicates | Species | Organ | Tissue | Adj P-value | Log2FC | Malignancy |
| 5908 | RAP1B | HTA11_3410_2000001011 | Human | Colorectum | AD | 4.91e-06 | -3.40e-01 | 0.0155 |
| 5908 | RAP1B | HTA11_1938_2000001011 | Human | Colorectum | AD | 5.15e-04 | 4.87e-01 | -0.0811 |
| 5908 | RAP1B | HTA11_347_2000001011 | Human | Colorectum | AD | 8.40e-11 | 6.02e-01 | -0.1954 |
| 5908 | RAP1B | HTA11_411_2000001011 | Human | Colorectum | SER | 3.22e-02 | 7.21e-01 | -0.2602 |
| 5908 | RAP1B | HTA11_2112_2000001011 | Human | Colorectum | SER | 2.16e-02 | 7.23e-01 | -0.2196 |
| 5908 | RAP1B | HTA11_1391_2000001011 | Human | Colorectum | AD | 7.47e-04 | 5.05e-01 | -0.059 |
| 5908 | RAP1B | HTA11_7696_3000711011 | Human | Colorectum | AD | 1.26e-03 | -3.01e-01 | 0.0674 |
| 5908 | RAP1B | HTA11_6818_2000001021 | Human | Colorectum | AD | 3.01e-03 | 4.76e-01 | 0.0588 |
| 5908 | RAP1B | HTA11_99999965062_69753 | Human | Colorectum | MSI-H | 4.75e-03 | 8.48e-01 | 0.3487 |
| 5908 | RAP1B | A001-C-207 | Human | Colorectum | FAP | 2.35e-03 | -2.00e-01 | 0.1278 |
| 5908 | RAP1B | A015-C-203 | Human | Colorectum | FAP | 4.98e-31 | -5.10e-01 | -0.1294 |
| 5908 | RAP1B | A015-C-204 | Human | Colorectum | FAP | 6.45e-07 | -3.74e-01 | -0.0228 |
| 5908 | RAP1B | A014-C-040 | Human | Colorectum | FAP | 2.06e-03 | -3.97e-01 | -0.1184 |
| 5908 | RAP1B | A002-C-201 | Human | Colorectum | FAP | 1.41e-16 | -4.51e-01 | 0.0324 |
| 5908 | RAP1B | A002-C-203 | Human | Colorectum | FAP | 3.63e-02 | -1.94e-01 | 0.2786 |
| 5908 | RAP1B | A001-C-119 | Human | Colorectum | FAP | 8.98e-06 | -3.77e-01 | -0.1557 |
| 5908 | RAP1B | A001-C-108 | Human | Colorectum | FAP | 1.03e-19 | -3.59e-01 | -0.0272 |
| 5908 | RAP1B | A002-C-205 | Human | Colorectum | FAP | 2.19e-25 | -6.42e-01 | -0.1236 |
| 5908 | RAP1B | A001-C-104 | Human | Colorectum | FAP | 2.69e-03 | -1.53e-01 | 0.0184 |
| 5908 | RAP1B | A015-C-005 | Human | Colorectum | FAP | 1.69e-05 | -2.88e-01 | -0.0336 |
| Page: 1 2 3 4 5 6 7 8 9 10 11 12 13 |
| Tissue | Expression Dynamics | Abbreviation |
| Colorectum (GSE201348) |  | FAP: Familial adenomatous polyposis |
| CRC: Colorectal cancer | ||
| Colorectum (HTA11) |  | AD: Adenomas |
| SER: Sessile serrated lesions | ||
| MSI-H: Microsatellite-high colorectal cancer | ||
| MSS: Microsatellite stable colorectal cancer | ||
| Endometrium | 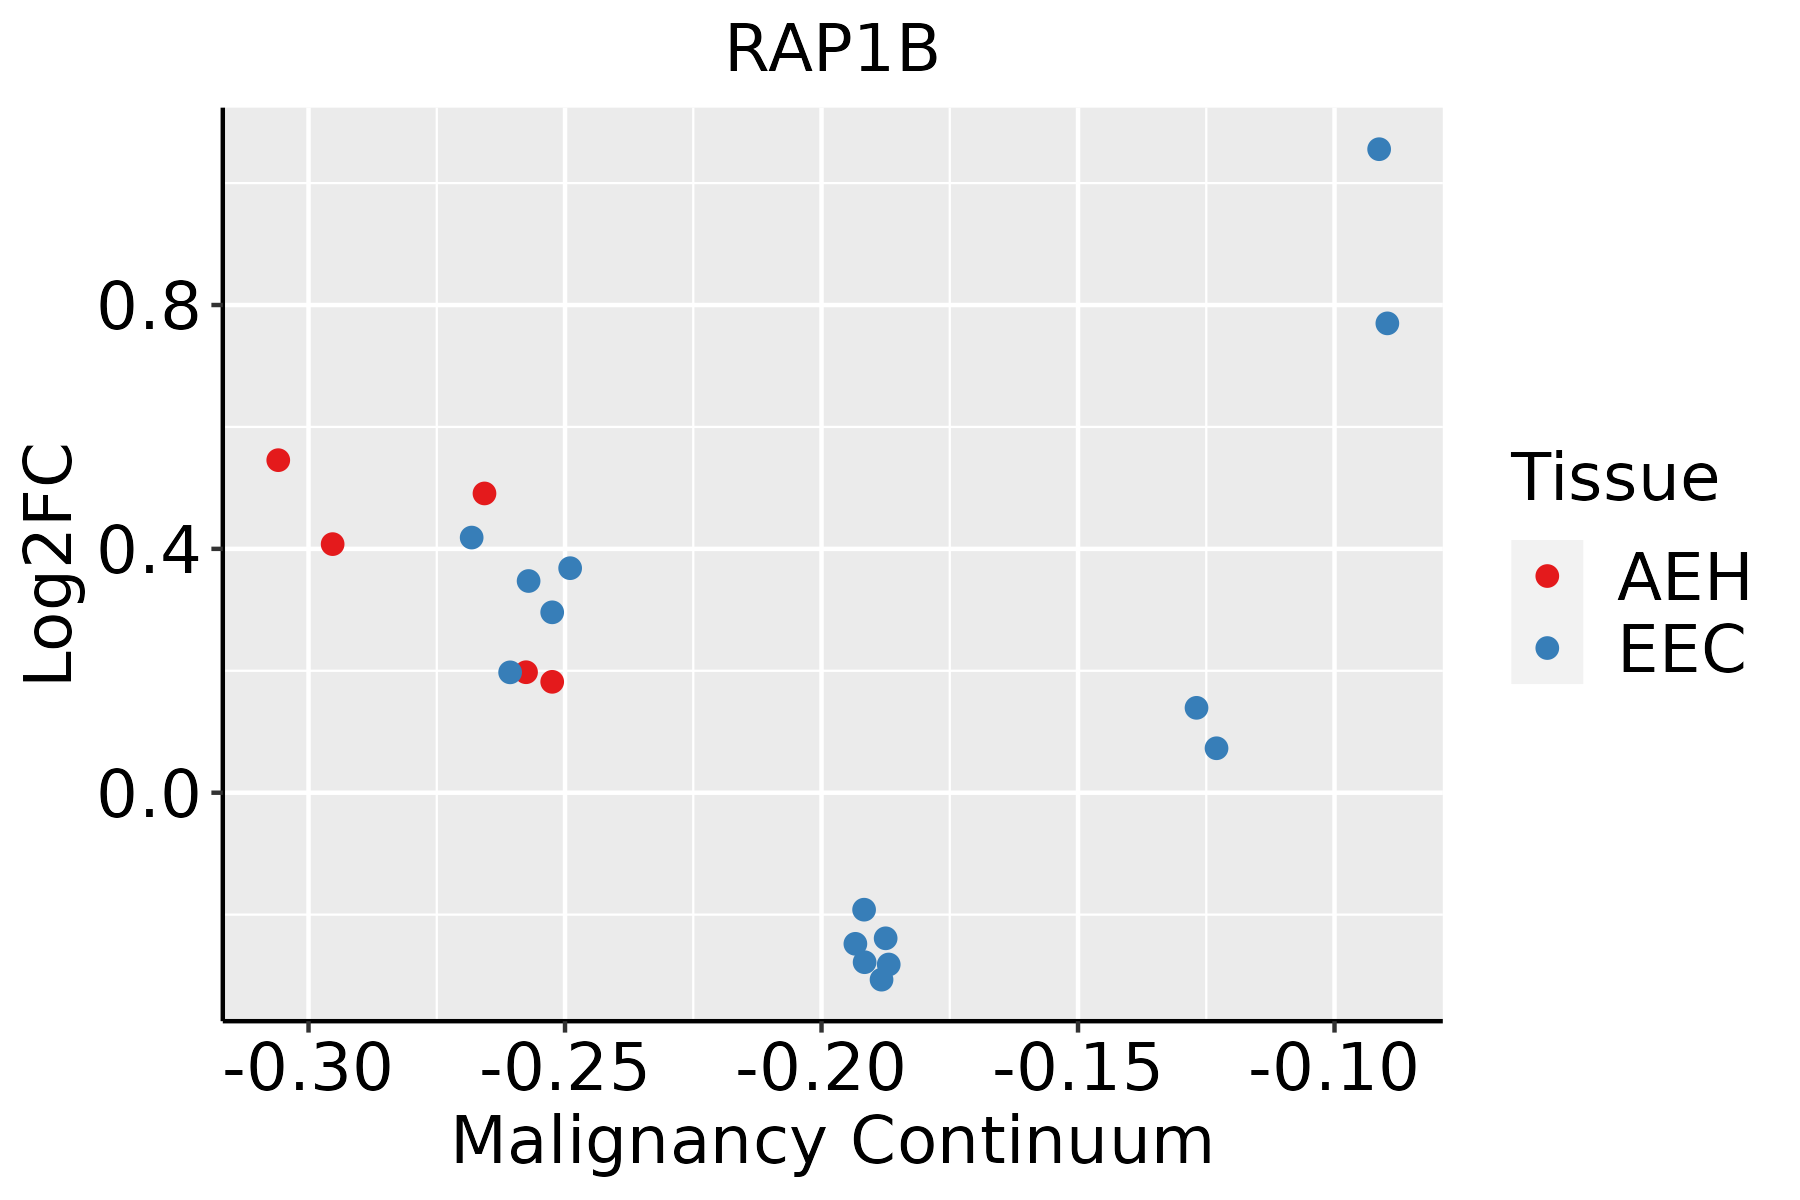 | AEH: Atypical endometrial hyperplasia |
| EEC: Endometrioid Cancer | ||
| Esophagus | 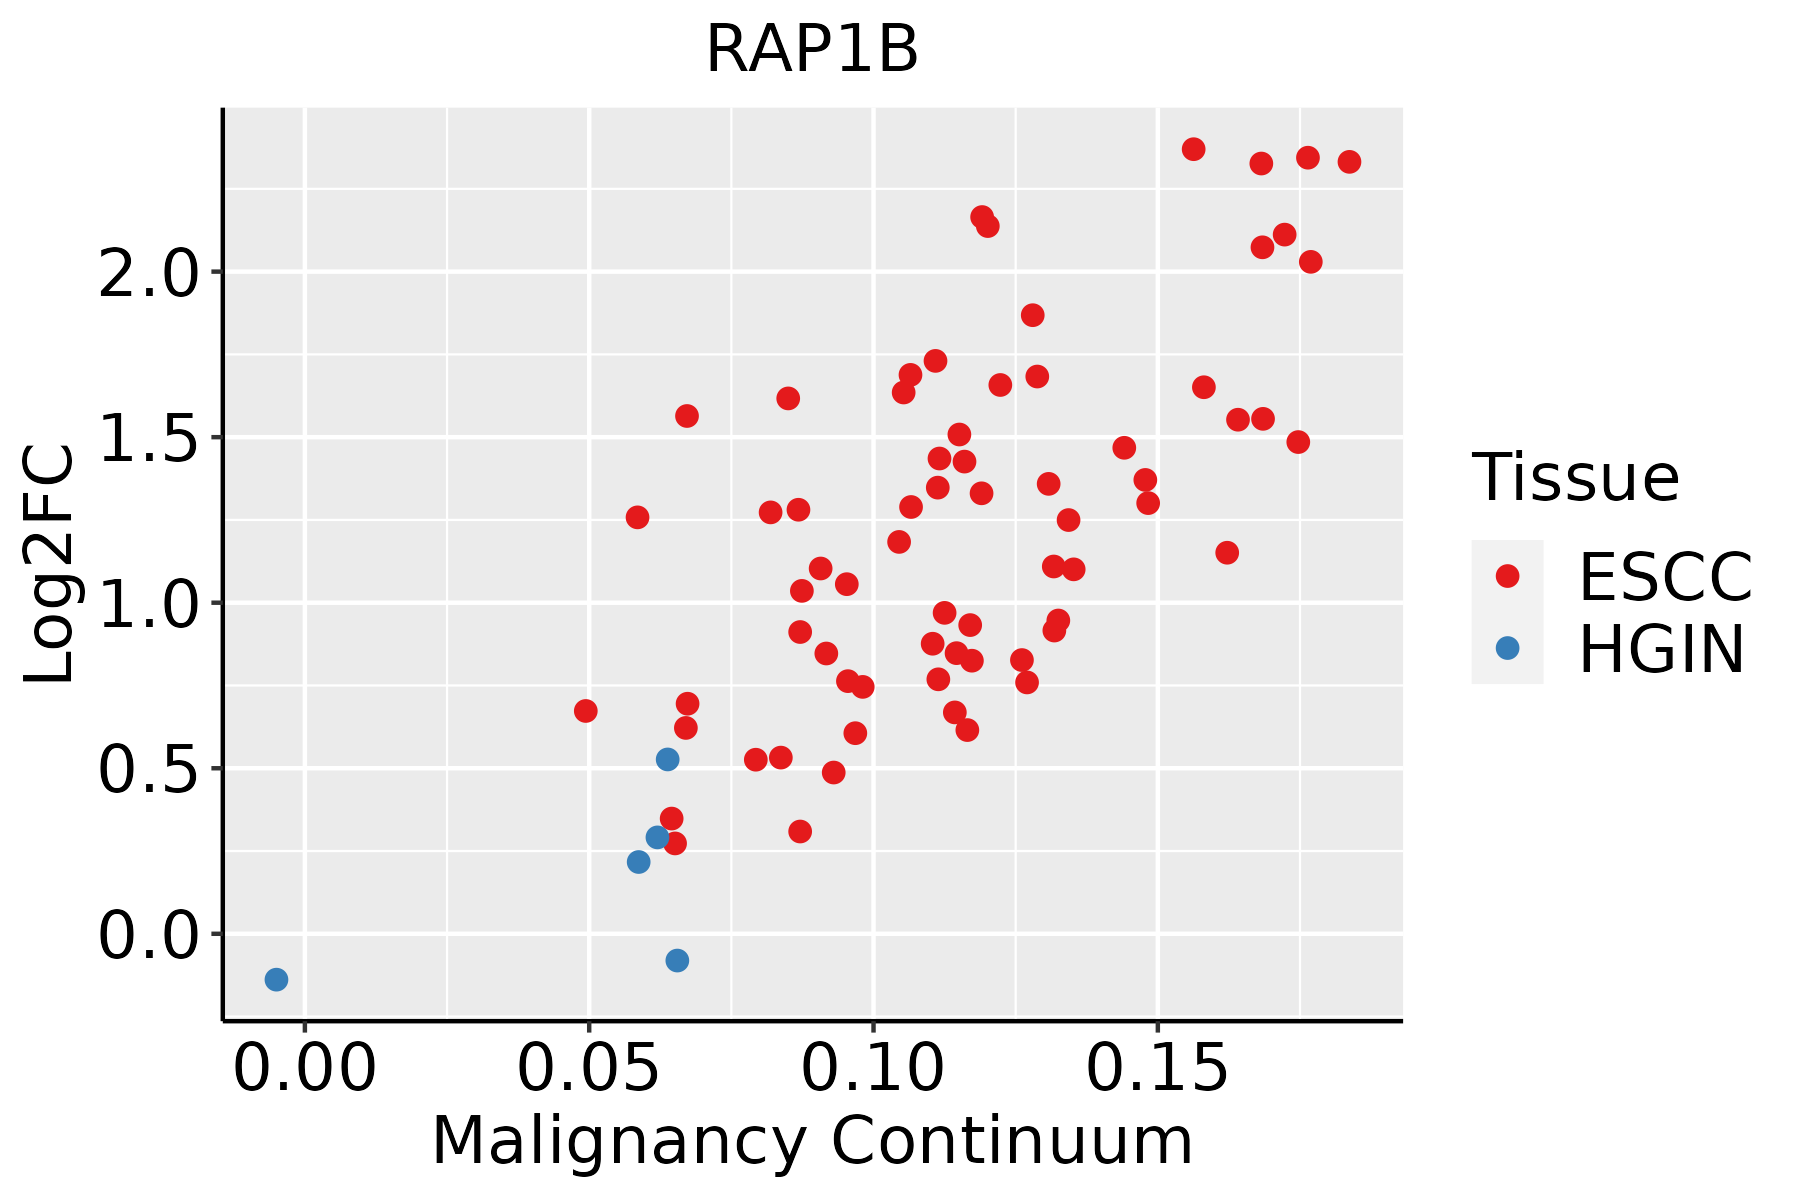 | ESCC: Esophageal squamous cell carcinoma |
| HGIN: High-grade intraepithelial neoplasias | ||
| LGIN: Low-grade intraepithelial neoplasias | ||
| GC | 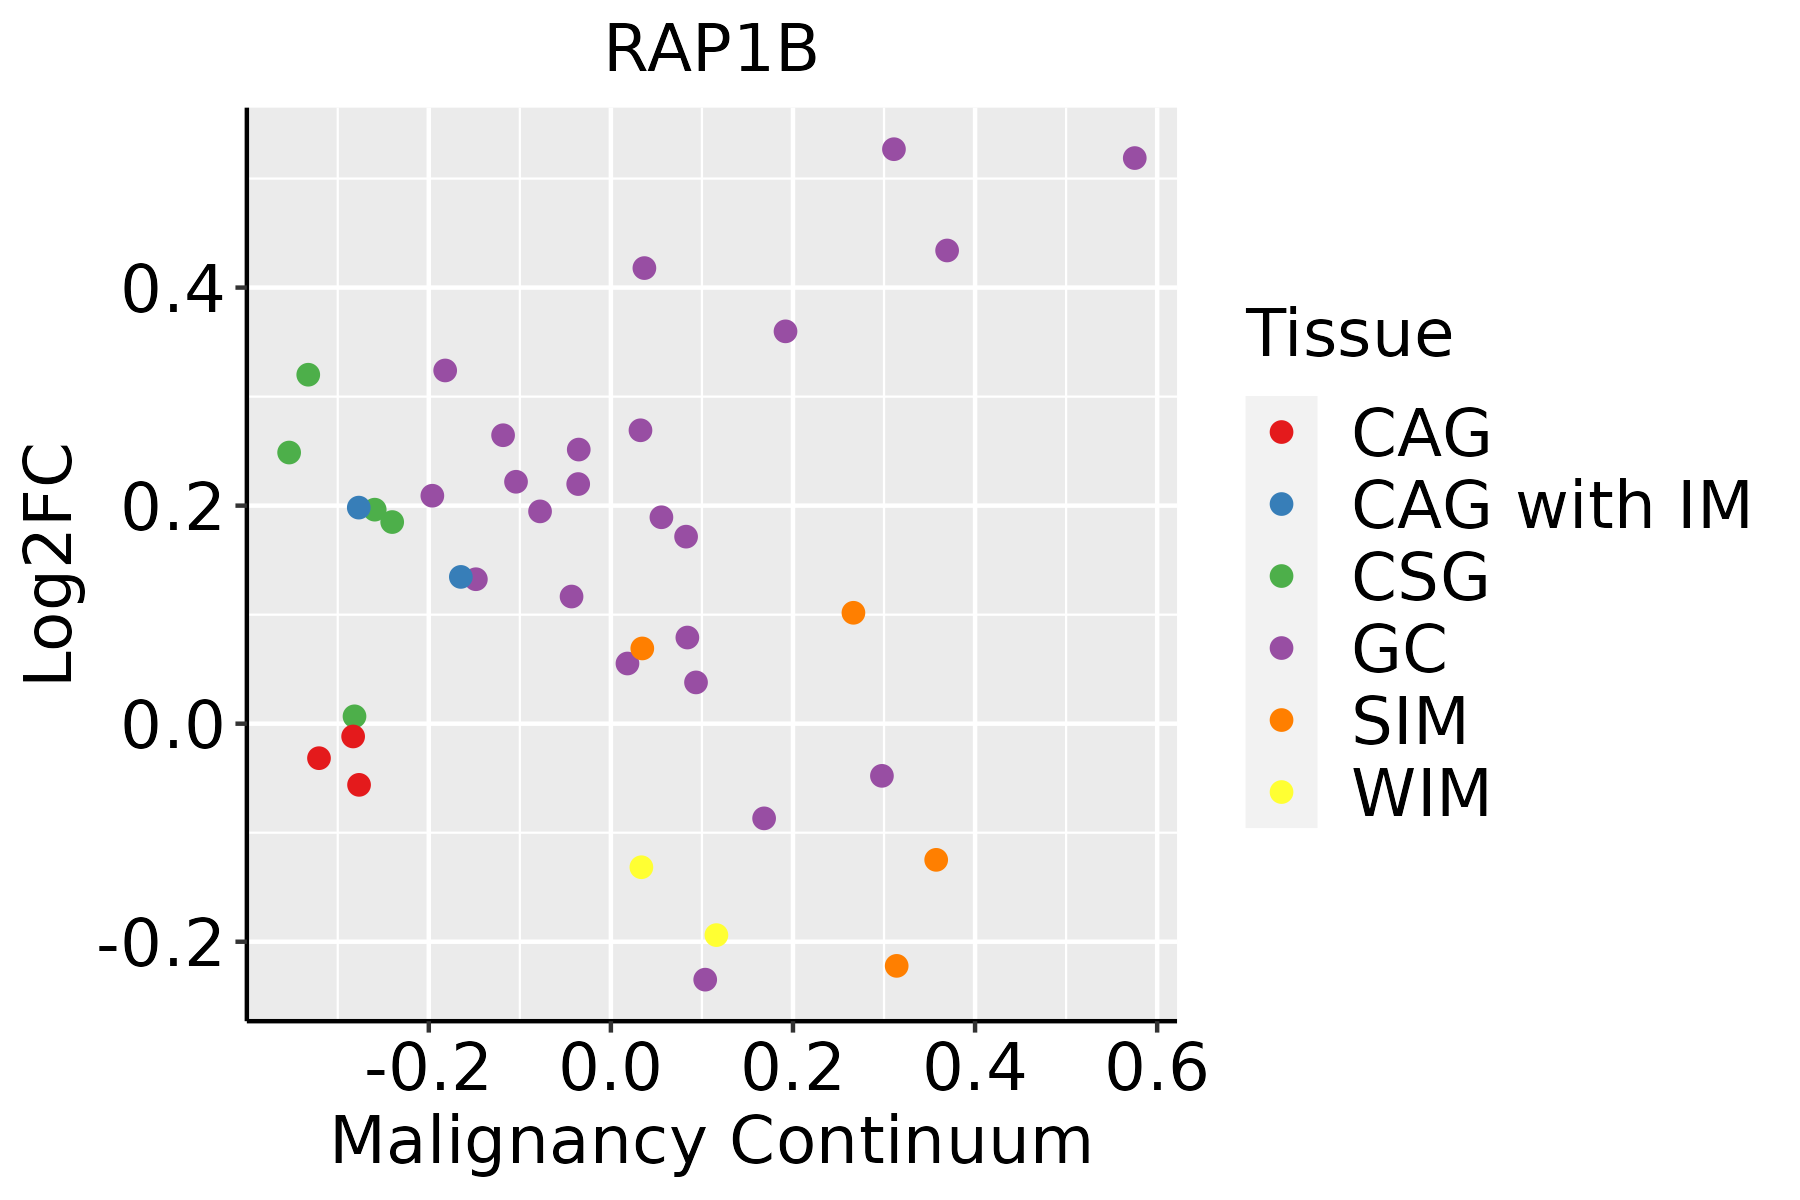 | CAG: Chronic atrophic gastritis |
| CAG with IM: Chronic atrophic gastritis with intestinal metaplasia | ||
| CSG: Chronic superficial gastritis | ||
| GC: Gastric cancer | ||
| SIM: Severe intestinal metaplasia | ||
| WIM: Wild intestinal metaplasia | ||
| Liver | 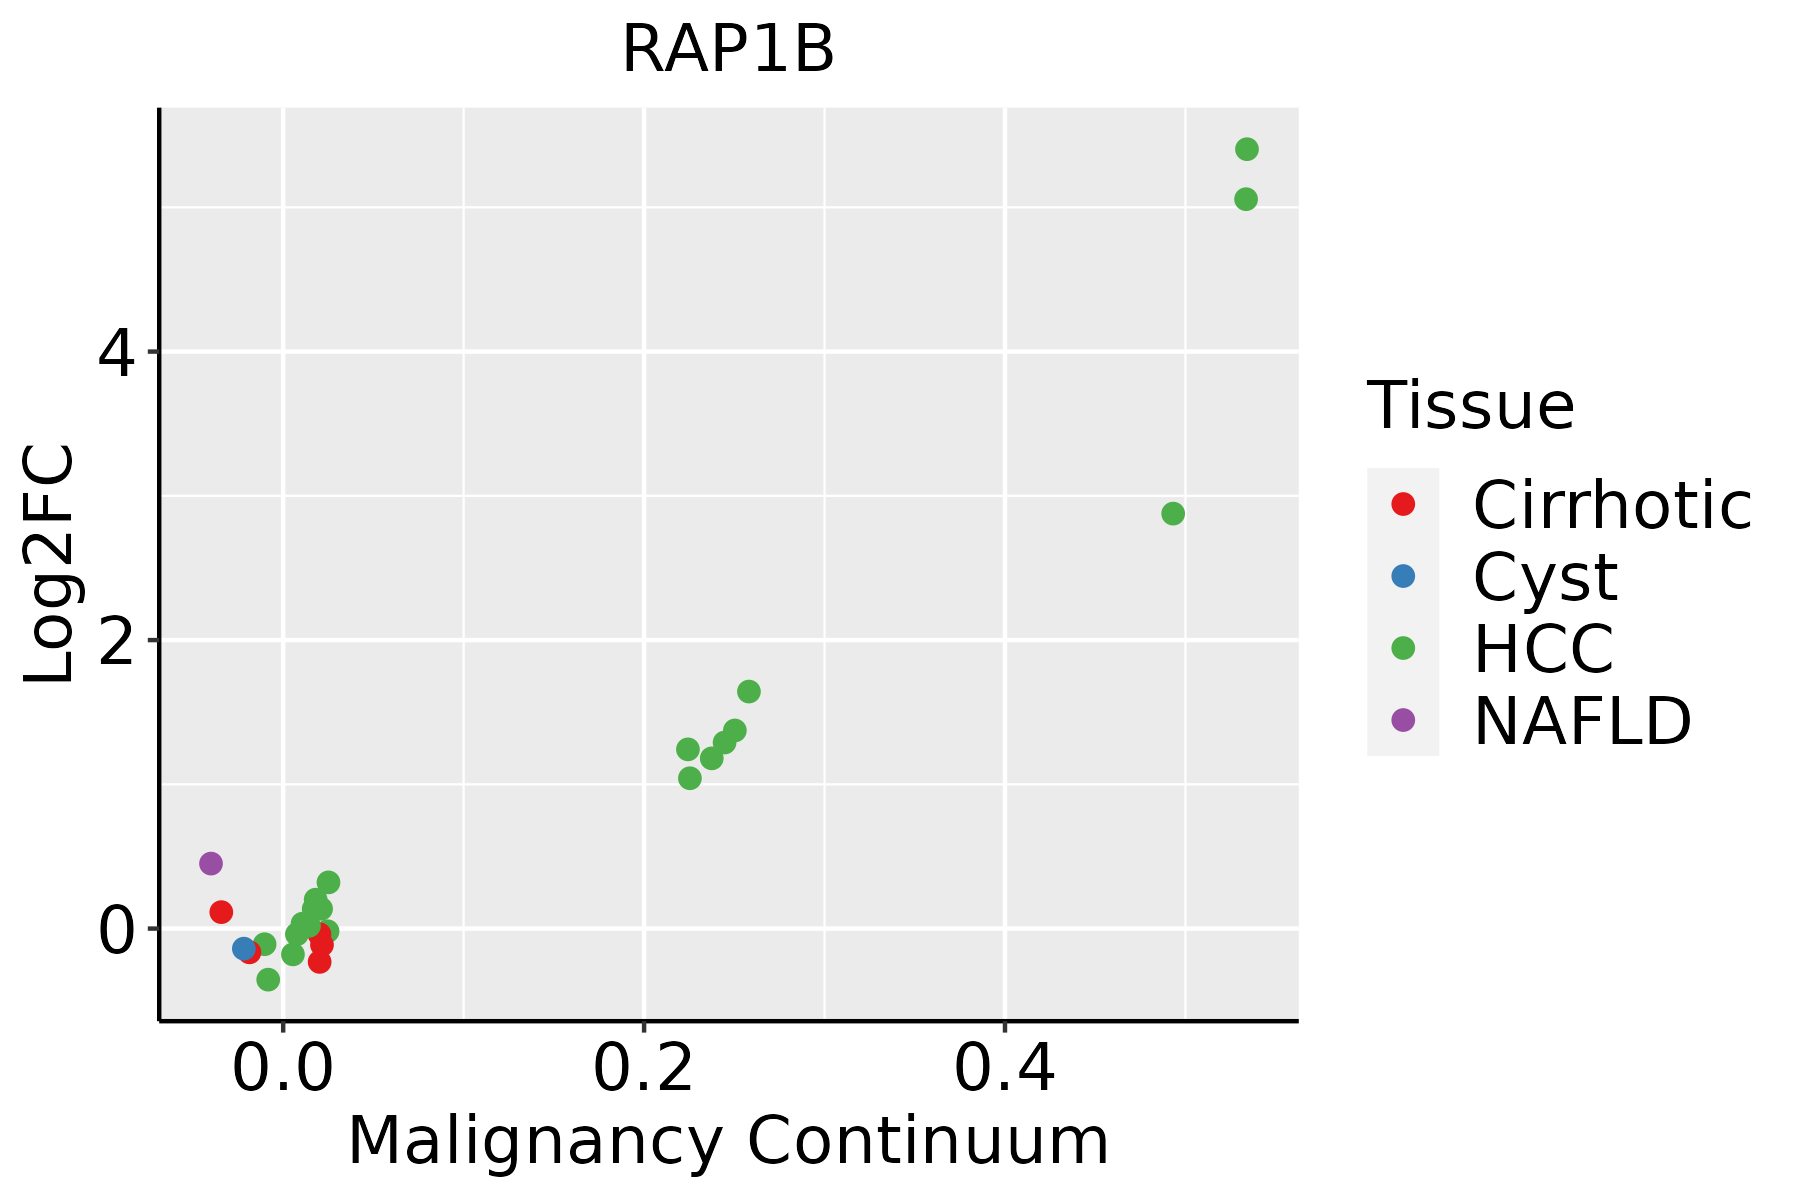 | HCC: Hepatocellular carcinoma |
| NAFLD: Non-alcoholic fatty liver disease | ||
| Lung |  | AAH: Atypical adenomatous hyperplasia |
| AIS: Adenocarcinoma in situ | ||
| IAC: Invasive lung adenocarcinoma | ||
| MIA: Minimally invasive adenocarcinoma | ||
| Oral Cavity | 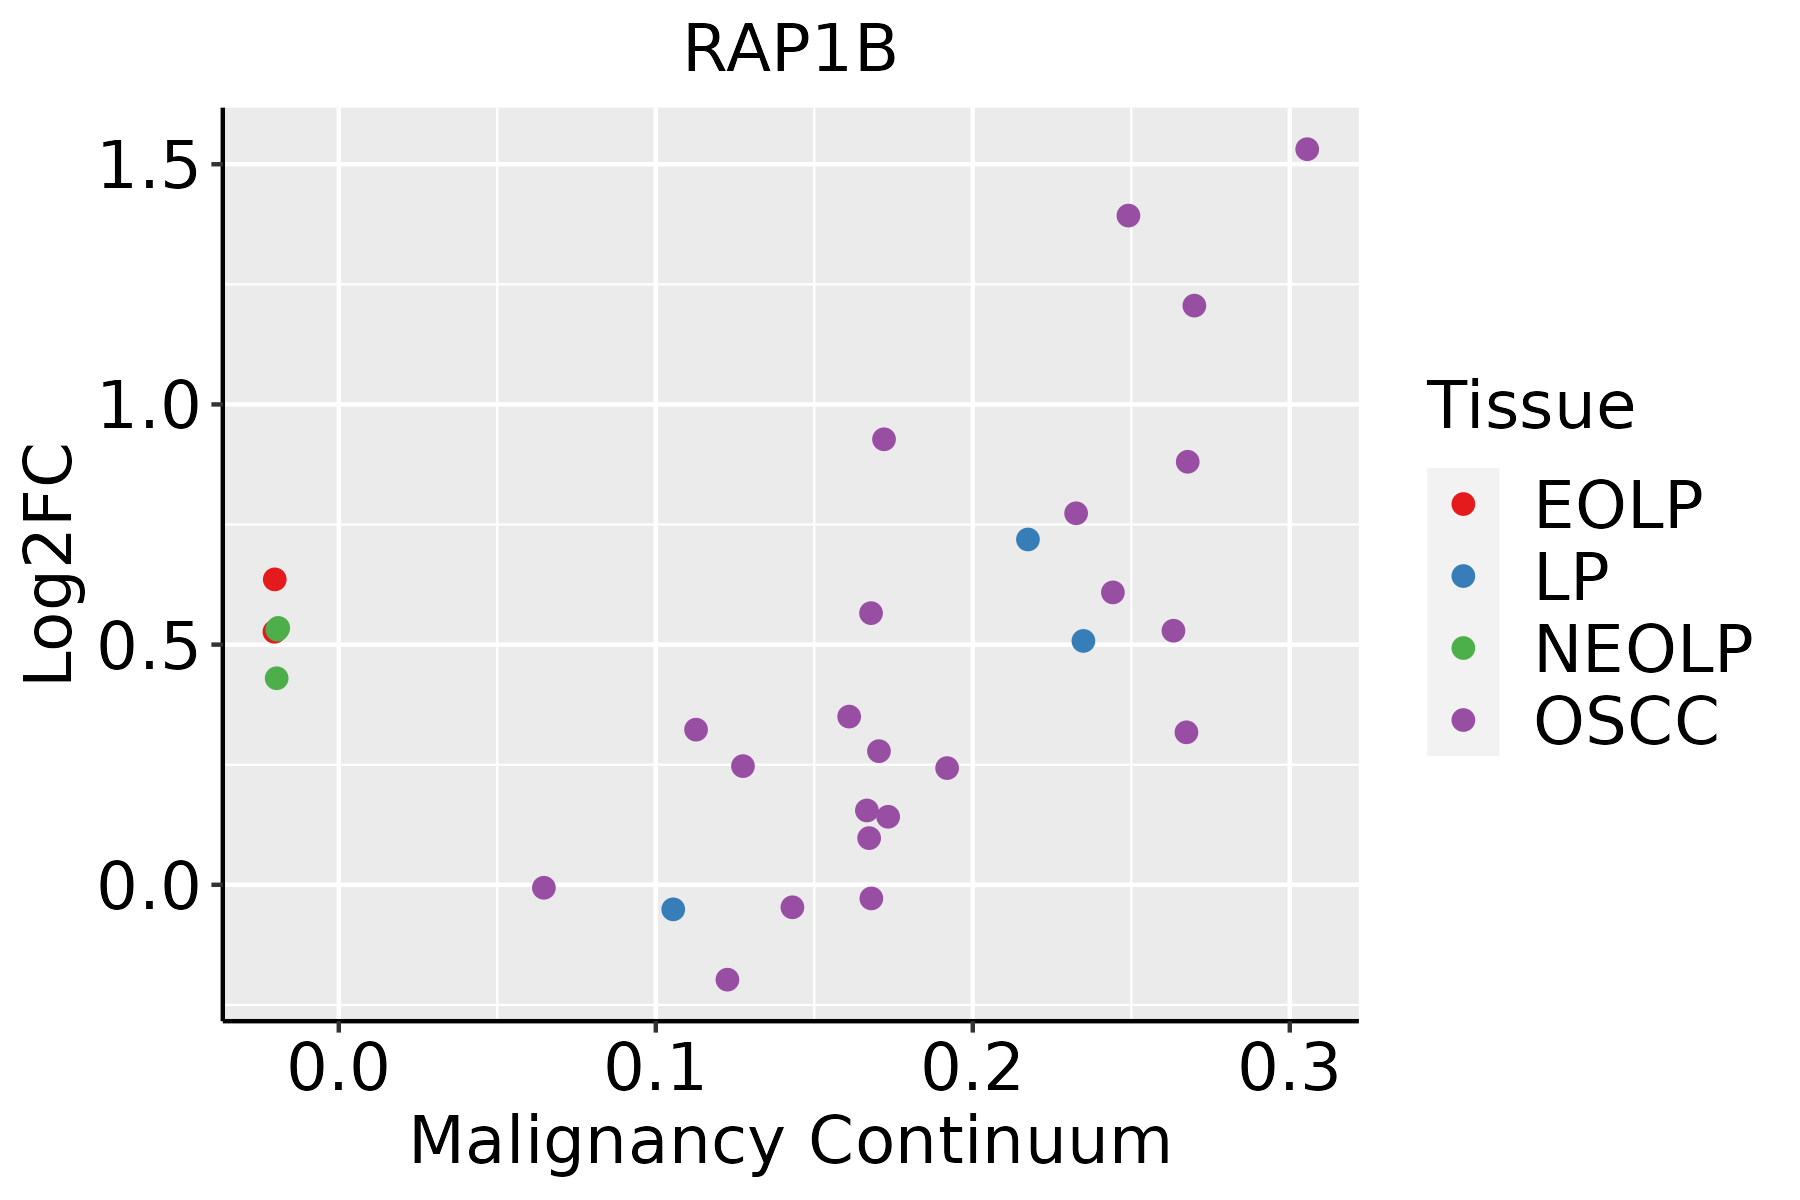 | EOLP: Erosive Oral lichen planus |
| LP: leukoplakia | ||
| NEOLP: Non-erosive oral lichen planus | ||
| OSCC: Oral squamous cell carcinoma | ||
| Prostate |  | BPH: Benign Prostatic Hyperplasia |
| Skin |  | AK: Actinic keratosis |
| cSCC: Cutaneous squamous cell carcinoma | ||
| SCCIS:squamous cell carcinoma in situ | ||
| Thyroid | 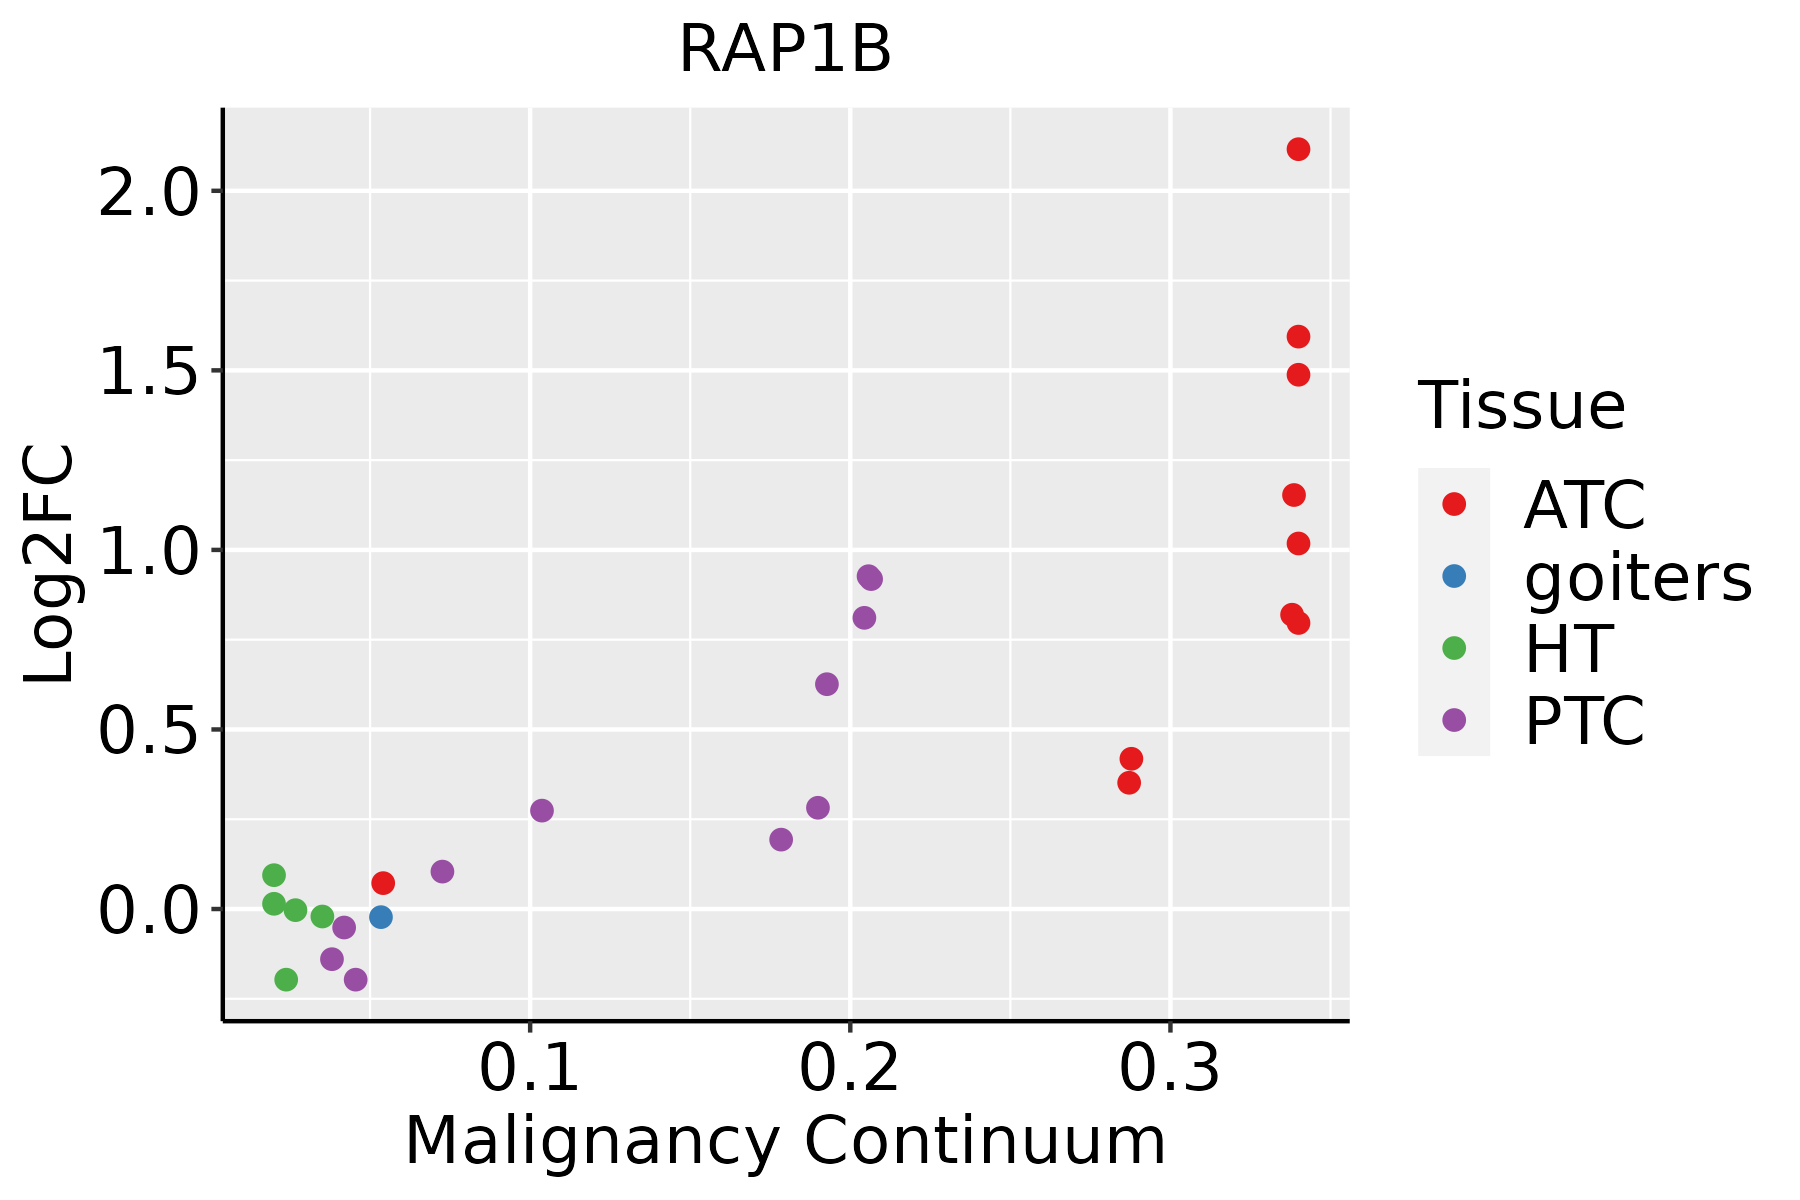 | ATC: Anaplastic thyroid cancer |
| HT: Hashimoto's thyroiditis | ||
| PTC: Papillary thyroid cancer |
| ∗log2FC in expression of this searched gene in stem-like cells from each diseased tissue sample relative to stem-like cells in normal samples in each tissue plotted against the malignancy continuum. Samples are colored based on if they are from different disease stage. |
Top |
Malignant transformation related pathway analysis |
| Find out the enriched GO biological processes and KEGG pathways involved in transition from healthy to precancer to cancer |
| Tissue | Disease Stage | Enriched GO biological Processes |
| Colorectum | AD |  |
| Colorectum | SER |  |
| Colorectum | MSS |  |
| Colorectum | MSI-H |  |
| Colorectum | FAP |  |
| ∗Top 15 enriched GO BP terms are showed in the bar plot of each disease state in each tissue. Each row represents a significant GO biological process which is colored according to the -log10(p.adjust). |
| Page: 1 2 3 4 5 6 7 8 9 |
| GO ID | Tissue | Disease Stage | Description | Gene Ratio | Bg Ratio | pvalue | p.adjust | Count |
| GO:0043254 | Colorectum | AD | regulation of protein-containing complex assembly | 148/3918 | 428/18723 | 2.64e-11 | 3.18e-09 | 148 |
| GO:0002064 | Colorectum | AD | epithelial cell development | 89/3918 | 220/18723 | 2.98e-11 | 3.52e-09 | 89 |
| GO:0031334 | Colorectum | AD | positive regulation of protein-containing complex assembly | 91/3918 | 237/18723 | 4.78e-10 | 3.99e-08 | 91 |
| GO:0034329 | Colorectum | AD | cell junction assembly | 136/3918 | 420/18723 | 2.02e-08 | 1.15e-06 | 136 |
| GO:0007163 | Colorectum | AD | establishment or maintenance of cell polarity | 77/3918 | 218/18723 | 5.72e-07 | 2.08e-05 | 77 |
| GO:1901653 | Colorectum | AD | cellular response to peptide | 114/3918 | 359/18723 | 8.32e-07 | 2.88e-05 | 114 |
| GO:0009743 | Colorectum | AD | response to carbohydrate | 86/3918 | 253/18723 | 8.43e-07 | 2.90e-05 | 86 |
| GO:0071375 | Colorectum | AD | cellular response to peptide hormone stimulus | 95/3918 | 290/18723 | 1.50e-06 | 4.66e-05 | 95 |
| GO:0043434 | Colorectum | AD | response to peptide hormone | 126/3918 | 414/18723 | 2.70e-06 | 7.86e-05 | 126 |
| GO:0007265 | Colorectum | AD | Ras protein signal transduction | 104/3918 | 337/18723 | 1.01e-05 | 2.35e-04 | 104 |
| GO:0061028 | Colorectum | AD | establishment of endothelial barrier | 23/3918 | 46/18723 | 1.14e-05 | 2.57e-04 | 23 |
| GO:0030010 | Colorectum | AD | establishment of cell polarity | 50/3918 | 143/18723 | 6.90e-05 | 1.11e-03 | 50 |
| GO:0001885 | Colorectum | AD | endothelial cell development | 26/3918 | 64/18723 | 2.67e-04 | 3.29e-03 | 26 |
| GO:0009410 | Colorectum | AD | response to xenobiotic stimulus | 128/3918 | 462/18723 | 2.69e-04 | 3.31e-03 | 128 |
| GO:0003158 | Colorectum | AD | endothelium development | 44/3918 | 136/18723 | 1.20e-03 | 1.07e-02 | 44 |
| GO:0045446 | Colorectum | AD | endothelial cell differentiation | 39/3918 | 118/18723 | 1.42e-03 | 1.22e-02 | 39 |
| GO:1901888 | Colorectum | AD | regulation of cell junction assembly | 61/3918 | 204/18723 | 1.50e-03 | 1.27e-02 | 61 |
| GO:0032878 | Colorectum | AD | regulation of establishment or maintenance of cell polarity | 12/3918 | 25/18723 | 2.30e-03 | 1.80e-02 | 12 |
| GO:2000114 | Colorectum | AD | regulation of establishment of cell polarity | 11/3918 | 22/18723 | 2.32e-03 | 1.80e-02 | 11 |
| GO:0006887 | Colorectum | AD | exocytosis | 96/3918 | 352/18723 | 2.48e-03 | 1.90e-02 | 96 |
| Page: 1 2 3 4 5 6 7 8 9 10 11 12 13 14 15 16 17 18 19 20 21 22 23 24 25 26 27 |
| Pathway ID | Tissue | Disease Stage | Description | Gene Ratio | Bg Ratio | pvalue | p.adjust | qvalue | Count |
| hsa04520 | Colorectum | AD | Adherens junction | 50/2092 | 93/8465 | 1.52e-09 | 2.83e-08 | 1.81e-08 | 50 |
| hsa04722 | Colorectum | AD | Neurotrophin signaling pathway | 50/2092 | 119/8465 | 2.28e-05 | 2.24e-04 | 1.43e-04 | 50 |
| hsa05417 | Colorectum | AD | Lipid and atherosclerosis | 73/2092 | 215/8465 | 1.31e-03 | 8.27e-03 | 5.27e-03 | 73 |
| hsa04015 | Colorectum | AD | Rap1 signaling pathway | 71/2092 | 210/8465 | 1.72e-03 | 9.68e-03 | 6.18e-03 | 71 |
| hsa05211 | Colorectum | AD | Renal cell carcinoma | 28/2092 | 69/8465 | 2.58e-03 | 1.37e-02 | 8.75e-03 | 28 |
| hsa04510 | Colorectum | AD | Focal adhesion | 67/2092 | 203/8465 | 4.40e-03 | 2.17e-02 | 1.38e-02 | 67 |
| hsa04670 | Colorectum | AD | Leukocyte transendothelial migration | 41/2092 | 114/8465 | 4.60e-03 | 2.20e-02 | 1.40e-02 | 41 |
| hsa04720 | Colorectum | AD | Long-term potentiation | 26/2092 | 67/8465 | 7.26e-03 | 2.97e-02 | 1.89e-02 | 26 |
| hsa04972 | Colorectum | AD | Pancreatic secretion | 36/2092 | 102/8465 | 1.06e-02 | 3.98e-02 | 2.54e-02 | 36 |
| hsa045201 | Colorectum | AD | Adherens junction | 50/2092 | 93/8465 | 1.52e-09 | 2.83e-08 | 1.81e-08 | 50 |
| hsa047221 | Colorectum | AD | Neurotrophin signaling pathway | 50/2092 | 119/8465 | 2.28e-05 | 2.24e-04 | 1.43e-04 | 50 |
| hsa054171 | Colorectum | AD | Lipid and atherosclerosis | 73/2092 | 215/8465 | 1.31e-03 | 8.27e-03 | 5.27e-03 | 73 |
| hsa040151 | Colorectum | AD | Rap1 signaling pathway | 71/2092 | 210/8465 | 1.72e-03 | 9.68e-03 | 6.18e-03 | 71 |
| hsa052111 | Colorectum | AD | Renal cell carcinoma | 28/2092 | 69/8465 | 2.58e-03 | 1.37e-02 | 8.75e-03 | 28 |
| hsa045101 | Colorectum | AD | Focal adhesion | 67/2092 | 203/8465 | 4.40e-03 | 2.17e-02 | 1.38e-02 | 67 |
| hsa046701 | Colorectum | AD | Leukocyte transendothelial migration | 41/2092 | 114/8465 | 4.60e-03 | 2.20e-02 | 1.40e-02 | 41 |
| hsa047201 | Colorectum | AD | Long-term potentiation | 26/2092 | 67/8465 | 7.26e-03 | 2.97e-02 | 1.89e-02 | 26 |
| hsa049721 | Colorectum | AD | Pancreatic secretion | 36/2092 | 102/8465 | 1.06e-02 | 3.98e-02 | 2.54e-02 | 36 |
| hsa045202 | Colorectum | SER | Adherens junction | 37/1580 | 93/8465 | 1.54e-06 | 2.35e-05 | 1.71e-05 | 37 |
| hsa046702 | Colorectum | SER | Leukocyte transendothelial migration | 37/1580 | 114/8465 | 2.77e-04 | 2.56e-03 | 1.86e-03 | 37 |
| Page: 1 2 3 4 5 6 7 8 9 10 11 12 13 14 15 16 |
Top |
Cell-cell communication analysis |
| Identification of potential cell-cell interactions between two cell types and their ligand-receptor pairs for different disease states |
| Ligand | Receptor | LRpair | Pathway | Tissue | Disease Stage |
| Page: 1 |
Top |
Single-cell gene regulatory network inference analysis |
| Find out the significant the regulons (TFs) and the target genes of each regulon across cell types for different disease states |
| TF | Cell Type | Tissue | Disease Stage | Target Gene | RSS | Regulon Activity |
| ∗The dot plots of a searched regulon are shown for all cell subpopulations in each disease state of each tissue based on the regulon specific score inferred using pySCENIC and by calculating the average expression. |
| Page: 1 |
Top |
Somatic mutation of malignant transformation related genes |
| Annotation of somatic variants for genes involved in malignant transformation |
| Hugo Symbol | Variant Class | Variant Classification | dbSNP RS | HGVSc | HGVSp | HGVSp Short | SWISSPROT | BIOTYPE | SIFT | PolyPhen | Tumor Sample Barcode | Tissue | Histology | Sex | Age | Stage | Therapy Types | Drugs | Outcome |
| RAP1B | SNV | Missense_Mutation | novel | c.160G>C | p.Glu54Gln | p.E54Q | P61224 | protein_coding | deleterious(0) | probably_damaging(0.915) | TCGA-5L-AAT1-01 | Breast | breast invasive carcinoma | Female | <65 | III/IV | Hormone Therapy | letrozol | SD |
| RAP1B | SNV | Missense_Mutation | c.50N>G | p.Ser17Cys | p.S17C | P61224 | protein_coding | deleterious(0.01) | probably_damaging(1) | TCGA-D8-A1J8-01 | Breast | breast invasive carcinoma | Female | >=65 | I/II | Hormone Therapy | nolvadex | SD | |
| RAP1B | SNV | Missense_Mutation | novel | c.44N>A | p.Gly15Glu | p.G15E | P61224 | protein_coding | deleterious(0.01) | probably_damaging(1) | TCGA-2W-A8YY-01 | Cervix | cervical & endocervical cancer | Female | <65 | I/II | Chemotherapy | cisplatin | CR |
| RAP1B | SNV | Missense_Mutation | c.116N>G | p.Ser39Cys | p.S39C | P61224 | protein_coding | deleterious(0) | probably_damaging(0.992) | TCGA-IR-A3LK-01 | Cervix | cervical & endocervical cancer | Female | >=65 | I/II | Chemotherapy | cisplatin | PD | |
| RAP1B | SNV | Missense_Mutation | novel | c.371N>C | p.Arg124Thr | p.R124T | P61224 | protein_coding | deleterious(0) | probably_damaging(0.998) | TCGA-MA-AA3Y-01 | Cervix | cervical & endocervical cancer | Female | <65 | I/II | Unknown | Unknown | SD |
| RAP1B | SNV | Missense_Mutation | c.104N>T | p.Thr35Met | p.T35M | P61224 | protein_coding | deleterious(0) | possibly_damaging(0.645) | TCGA-AA-3966-01 | Colorectum | colon adenocarcinoma | Female | >=65 | I/II | Unknown | Unknown | SD | |
| RAP1B | SNV | Missense_Mutation | c.116C>A | p.Ser39Tyr | p.S39Y | P61224 | protein_coding | deleterious(0) | probably_damaging(0.997) | TCGA-A5-A0G2-01 | Endometrium | uterine corpus endometrioid carcinoma | Female | <65 | III/IV | Unknown | Unknown | SD | |
| RAP1B | SNV | Missense_Mutation | c.305N>A | p.Arg102Gln | p.R102Q | P61224 | protein_coding | deleterious(0.03) | benign(0.124) | TCGA-AX-A05Z-01 | Endometrium | uterine corpus endometrioid carcinoma | Female | <65 | III/IV | Chemotherapy | adriamycin | SD | |
| RAP1B | SNV | Missense_Mutation | novel | c.125N>G | p.Lys42Arg | p.K42R | P61224 | protein_coding | deleterious(0.04) | possibly_damaging(0.85) | TCGA-FI-A2F4-01 | Endometrium | uterine corpus endometrioid carcinoma | Female | <65 | I/II | Unknown | Unknown | SD |
| RAP1B | SNV | Missense_Mutation | c.550C>T | p.Leu184Phe | p.L184F | P61224 | protein_coding | tolerated(0.15) | benign(0.093) | TCGA-55-7727-01 | Lung | lung adenocarcinoma | Male | >=65 | III/IV | Unknown | Unknown | SD |
| Page: 1 2 |
Top |
Related drugs of malignant transformation related genes |
| Identification of chemicals and drugs interact with genes involved in malignant transfromation |
| (DGIdb 4.0) |
| Entrez ID | Symbol | Category | Interaction Types | Drug Claim Name | Drug Name | PMIDs |
| Page: 1 |

Copyright 2023-Present -The University of Texas Health Science Center at Houston |