
|
|||||
|
 | |
| |
| |
| |
| |
| |
|
Gene: RANGRF |
Gene summary for RANGRF |
| Gene information | Species | Human | Gene symbol | RANGRF | Gene ID | 29098 |
| Gene name | RAN guanine nucleotide release factor | |
| Gene Alias | HSPC165 | |
| Cytomap | 17p13.1 | |
| Gene Type | protein-coding | GO ID | GO:0000226 | UniProtAcc | Q9HD47 |
Top |
Malignant transformation analysis |
| Identification of the aberrant gene expression in precancerous and cancerous lesions by comparing the gene expression of stem-like cells in diseased tissues with normal stem cells |
| Entrez ID | Symbol | Replicates | Species | Organ | Tissue | Adj P-value | Log2FC | Malignancy |
| 29098 | RANGRF | LZE2T | Human | Esophagus | ESCC | 7.35e-04 | 4.09e-01 | 0.082 |
| 29098 | RANGRF | LZE4T | Human | Esophagus | ESCC | 1.94e-25 | 5.81e-01 | 0.0811 |
| 29098 | RANGRF | LZE7T | Human | Esophagus | ESCC | 2.01e-10 | 4.20e-01 | 0.0667 |
| 29098 | RANGRF | LZE8T | Human | Esophagus | ESCC | 1.65e-06 | 1.87e-01 | 0.067 |
| 29098 | RANGRF | LZE24T | Human | Esophagus | ESCC | 4.20e-12 | 2.22e-01 | 0.0596 |
| 29098 | RANGRF | LZE6T | Human | Esophagus | ESCC | 2.07e-07 | 2.98e-01 | 0.0845 |
| 29098 | RANGRF | P1T-E | Human | Esophagus | ESCC | 1.12e-04 | 1.84e-01 | 0.0875 |
| 29098 | RANGRF | P2T-E | Human | Esophagus | ESCC | 2.16e-27 | 5.08e-01 | 0.1177 |
| 29098 | RANGRF | P4T-E | Human | Esophagus | ESCC | 1.75e-33 | 8.22e-01 | 0.1323 |
| 29098 | RANGRF | P5T-E | Human | Esophagus | ESCC | 8.80e-16 | 3.63e-01 | 0.1327 |
| 29098 | RANGRF | P8T-E | Human | Esophagus | ESCC | 1.09e-25 | 5.13e-01 | 0.0889 |
| 29098 | RANGRF | P9T-E | Human | Esophagus | ESCC | 1.43e-18 | 3.22e-01 | 0.1131 |
| 29098 | RANGRF | P10T-E | Human | Esophagus | ESCC | 3.01e-21 | 4.06e-01 | 0.116 |
| 29098 | RANGRF | P11T-E | Human | Esophagus | ESCC | 1.43e-17 | 6.90e-01 | 0.1426 |
| 29098 | RANGRF | P12T-E | Human | Esophagus | ESCC | 5.43e-34 | 6.56e-01 | 0.1122 |
| 29098 | RANGRF | P15T-E | Human | Esophagus | ESCC | 2.16e-08 | 1.79e-01 | 0.1149 |
| 29098 | RANGRF | P16T-E | Human | Esophagus | ESCC | 3.63e-33 | 6.73e-01 | 0.1153 |
| 29098 | RANGRF | P17T-E | Human | Esophagus | ESCC | 1.96e-11 | 3.99e-01 | 0.1278 |
| 29098 | RANGRF | P19T-E | Human | Esophagus | ESCC | 8.93e-19 | 1.02e+00 | 0.1662 |
| 29098 | RANGRF | P20T-E | Human | Esophagus | ESCC | 1.02e-07 | 1.02e-01 | 0.1124 |
| Page: 1 2 3 4 5 |
| Tissue | Expression Dynamics | Abbreviation |
| Esophagus | 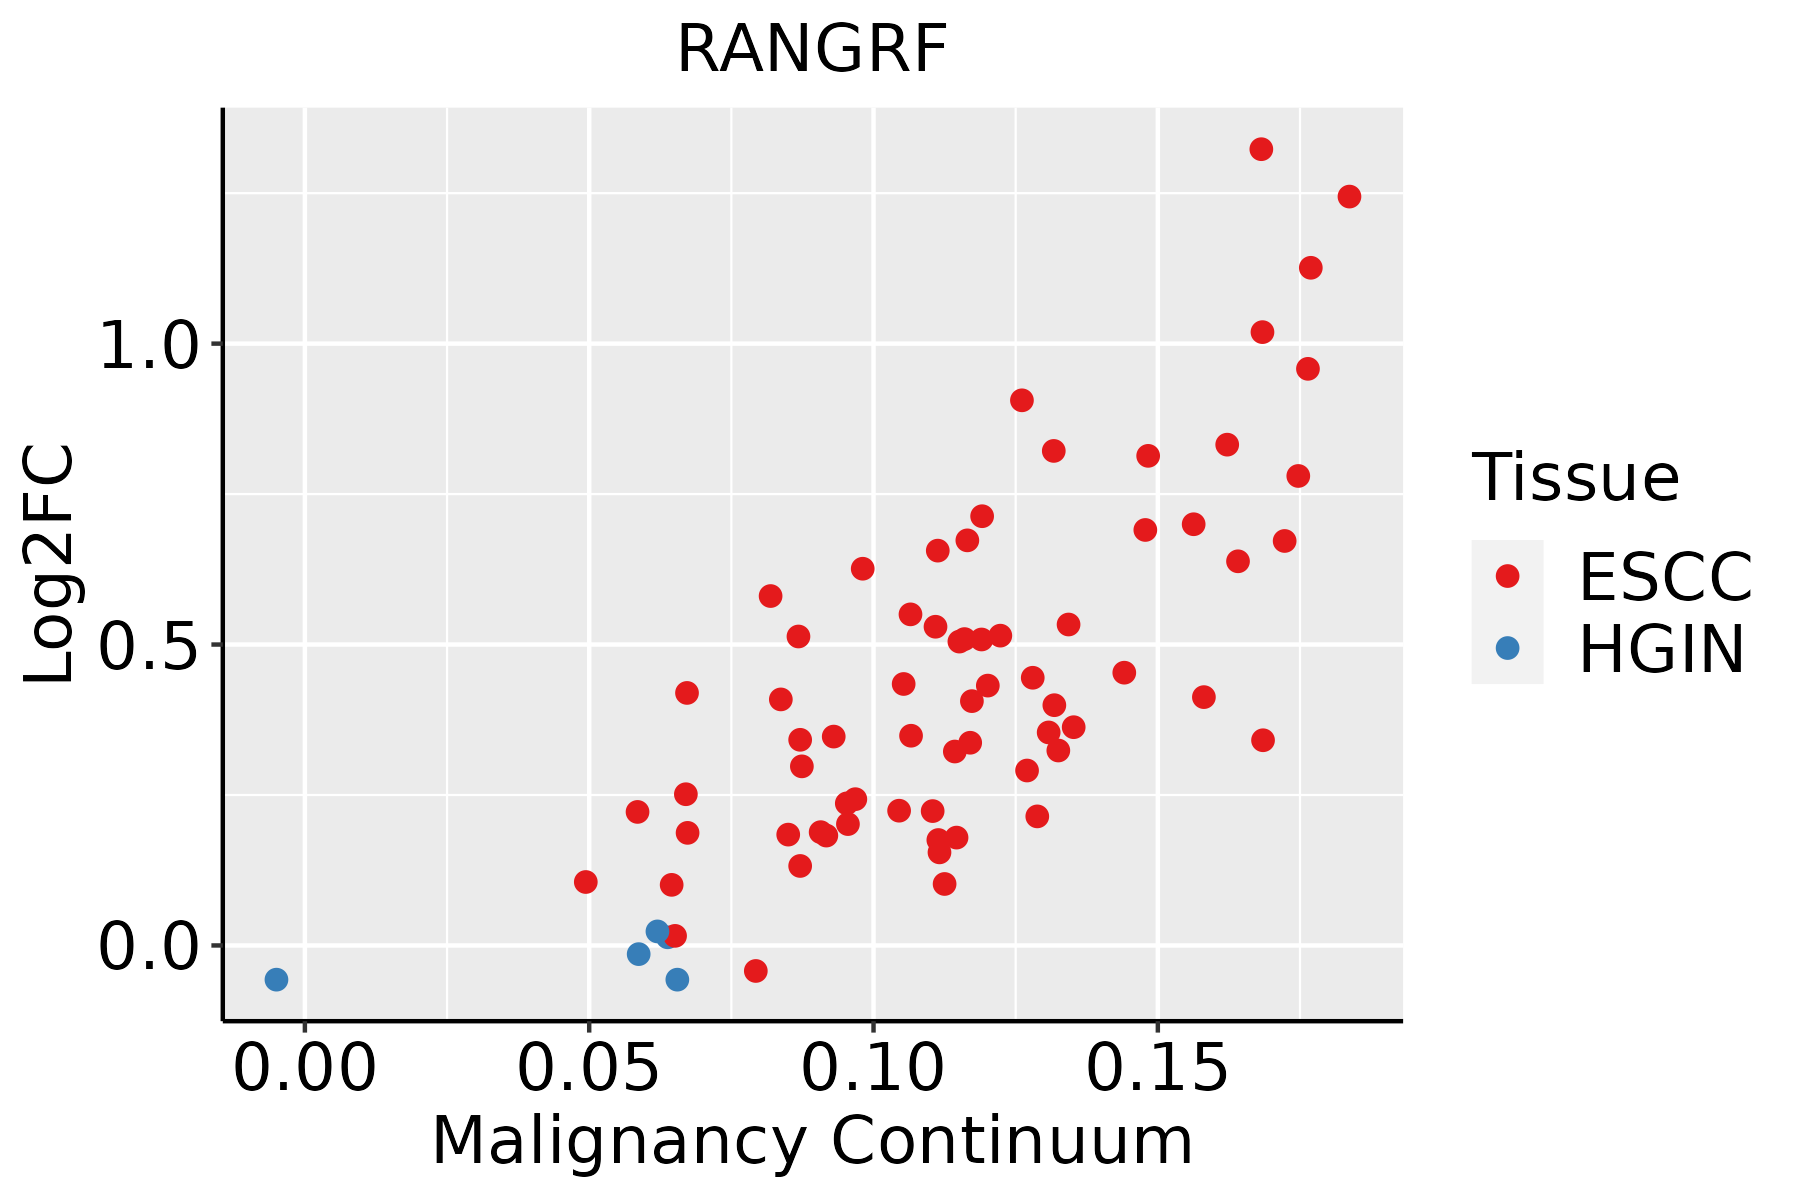 | ESCC: Esophageal squamous cell carcinoma |
| HGIN: High-grade intraepithelial neoplasias | ||
| LGIN: Low-grade intraepithelial neoplasias | ||
| Oral Cavity | 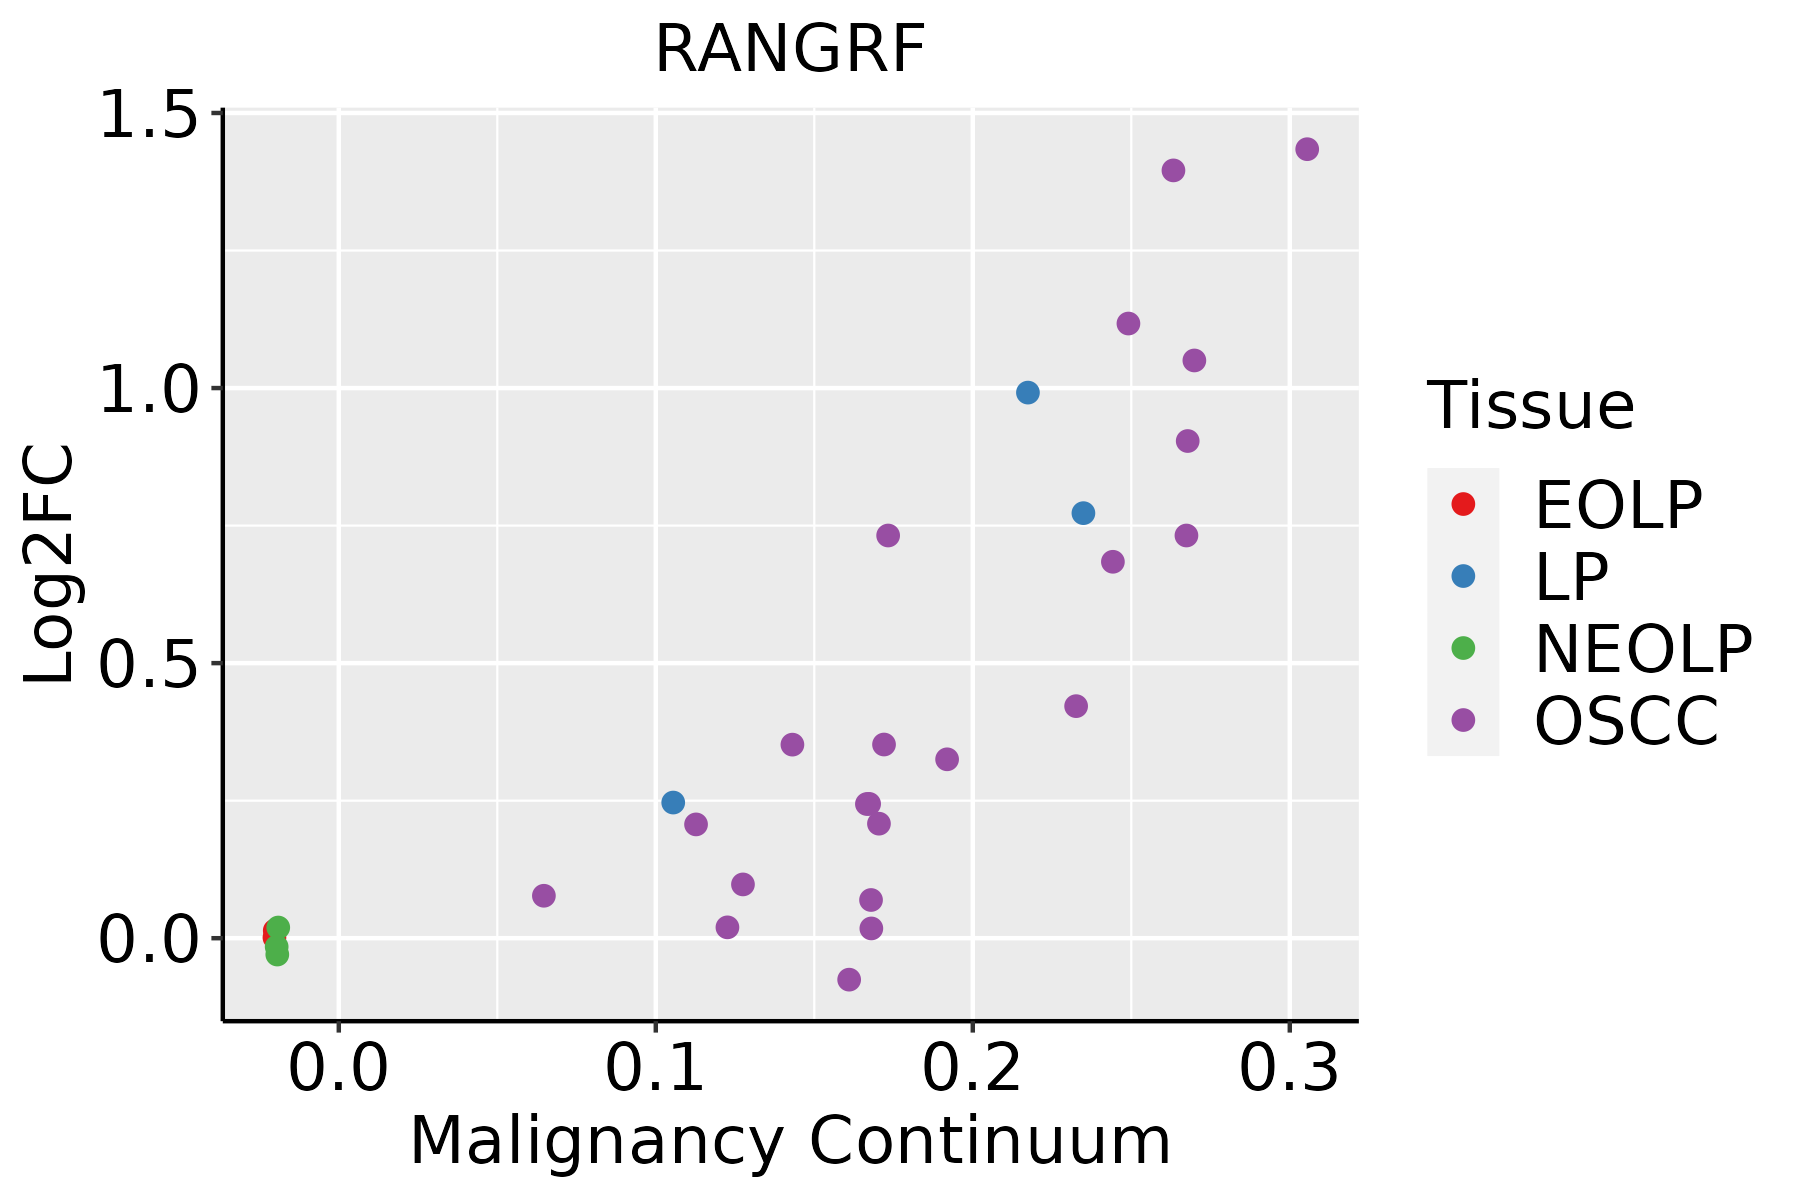 | EOLP: Erosive Oral lichen planus |
| LP: leukoplakia | ||
| NEOLP: Non-erosive oral lichen planus | ||
| OSCC: Oral squamous cell carcinoma | ||
| Skin | 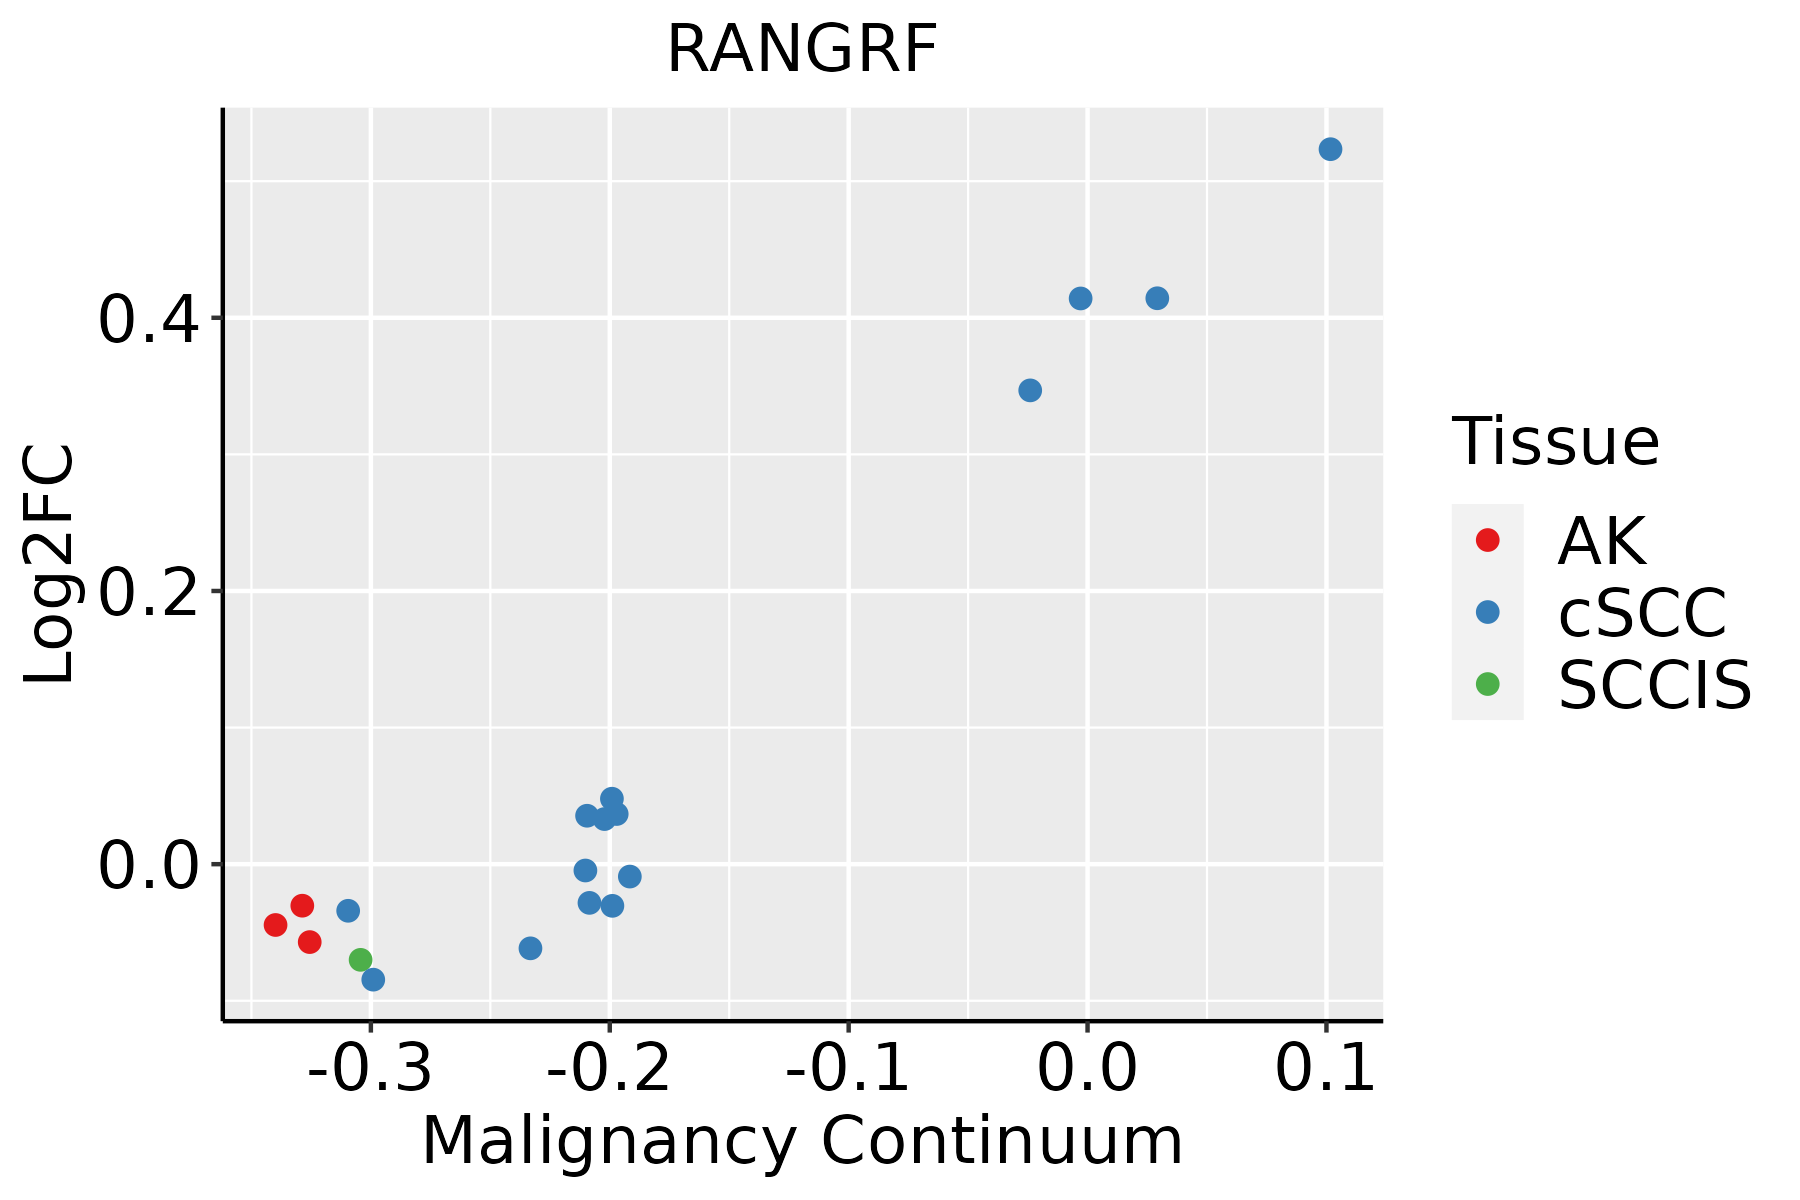 | AK: Actinic keratosis |
| cSCC: Cutaneous squamous cell carcinoma | ||
| SCCIS:squamous cell carcinoma in situ |
| ∗log2FC in expression of this searched gene in stem-like cells from each diseased tissue sample relative to stem-like cells in normal samples in each tissue plotted against the malignancy continuum. Samples are colored based on if they are from different disease stage. |
Top |
Malignant transformation related pathway analysis |
| Find out the enriched GO biological processes and KEGG pathways involved in transition from healthy to precancer to cancer |
| Tissue | Disease Stage | Enriched GO biological Processes |
| Colorectum | AD |  |
| Colorectum | SER |  |
| Colorectum | MSS |  |
| Colorectum | MSI-H |  |
| Colorectum | FAP |  |
| ∗Top 15 enriched GO BP terms are showed in the bar plot of each disease state in each tissue. Each row represents a significant GO biological process which is colored according to the -log10(p.adjust). |
| Page: 1 2 3 4 5 6 7 8 9 |
| GO ID | Tissue | Disease Stage | Description | Gene Ratio | Bg Ratio | pvalue | p.adjust | Count |
| GO:0072594110 | Esophagus | ESCC | establishment of protein localization to organelle | 311/8552 | 422/18723 | 3.02e-32 | 2.13e-29 | 311 |
| GO:004819318 | Esophagus | ESCC | Golgi vesicle transport | 231/8552 | 296/18723 | 1.82e-30 | 9.63e-28 | 231 |
| GO:0006913110 | Esophagus | ESCC | nucleocytoplasmic transport | 230/8552 | 301/18723 | 6.04e-28 | 2.02e-25 | 230 |
| GO:0051169110 | Esophagus | ESCC | nuclear transport | 230/8552 | 301/18723 | 6.04e-28 | 2.02e-25 | 230 |
| GO:003450418 | Esophagus | ESCC | protein localization to nucleus | 211/8552 | 290/18723 | 4.06e-21 | 6.60e-19 | 211 |
| GO:1903829111 | Esophagus | ESCC | positive regulation of cellular protein localization | 199/8552 | 276/18723 | 2.99e-19 | 3.45e-17 | 199 |
| GO:0043254111 | Esophagus | ESCC | regulation of protein-containing complex assembly | 278/8552 | 428/18723 | 3.81e-16 | 2.77e-14 | 278 |
| GO:001703818 | Esophagus | ESCC | protein import | 149/8552 | 206/18723 | 5.90e-15 | 3.31e-13 | 149 |
| GO:000688815 | Esophagus | ESCC | endoplasmic reticulum to Golgi vesicle-mediated transport | 102/8552 | 130/18723 | 1.73e-14 | 9.22e-13 | 102 |
| GO:0072659110 | Esophagus | ESCC | protein localization to plasma membrane | 193/8552 | 284/18723 | 1.95e-14 | 1.03e-12 | 193 |
| GO:199077819 | Esophagus | ESCC | protein localization to cell periphery | 217/8552 | 333/18723 | 4.08e-13 | 1.88e-11 | 217 |
| GO:1902903111 | Esophagus | ESCC | regulation of supramolecular fiber organization | 237/8552 | 383/18723 | 9.06e-11 | 2.75e-09 | 237 |
| GO:005117014 | Esophagus | ESCC | import into nucleus | 111/8552 | 159/18723 | 5.69e-10 | 1.44e-08 | 111 |
| GO:000660613 | Esophagus | ESCC | protein import into nucleus | 108/8552 | 155/18723 | 1.16e-09 | 2.77e-08 | 108 |
| GO:190547519 | Esophagus | ESCC | regulation of protein localization to membrane | 117/8552 | 175/18723 | 1.14e-08 | 2.26e-07 | 117 |
| GO:0051258111 | Esophagus | ESCC | protein polymerization | 183/8552 | 297/18723 | 1.94e-08 | 3.75e-07 | 183 |
| GO:00705078 | Esophagus | ESCC | regulation of microtubule cytoskeleton organization | 99/8552 | 148/18723 | 1.43e-07 | 2.29e-06 | 99 |
| GO:000726510 | Esophagus | ESCC | Ras protein signal transduction | 201/8552 | 337/18723 | 1.44e-07 | 2.30e-06 | 201 |
| GO:0032970111 | Esophagus | ESCC | regulation of actin filament-based process | 231/8552 | 397/18723 | 2.91e-07 | 4.20e-06 | 231 |
| GO:190437519 | Esophagus | ESCC | regulation of protein localization to cell periphery | 85/8552 | 125/18723 | 3.63e-07 | 5.06e-06 | 85 |
| Page: 1 2 3 4 5 6 7 |
| Pathway ID | Tissue | Disease Stage | Description | Gene Ratio | Bg Ratio | pvalue | p.adjust | qvalue | Count |
| Page: 1 |
Top |
Cell-cell communication analysis |
| Identification of potential cell-cell interactions between two cell types and their ligand-receptor pairs for different disease states |
| Ligand | Receptor | LRpair | Pathway | Tissue | Disease Stage |
| Page: 1 |
Top |
Single-cell gene regulatory network inference analysis |
| Find out the significant the regulons (TFs) and the target genes of each regulon across cell types for different disease states |
| TF | Cell Type | Tissue | Disease Stage | Target Gene | RSS | Regulon Activity |
| ∗The dot plots of a searched regulon are shown for all cell subpopulations in each disease state of each tissue based on the regulon specific score inferred using pySCENIC and by calculating the average expression. |
| Page: 1 |
Top |
Somatic mutation of malignant transformation related genes |
| Annotation of somatic variants for genes involved in malignant transformation |
| Hugo Symbol | Variant Class | Variant Classification | dbSNP RS | HGVSc | HGVSp | HGVSp Short | SWISSPROT | BIOTYPE | SIFT | PolyPhen | Tumor Sample Barcode | Tissue | Histology | Sex | Age | Stage | Therapy Types | Drugs | Outcome |
| RANGRF | SNV | Missense_Mutation | c.317N>A | p.Ser106Tyr | p.S106Y | Q9HD47 | protein_coding | deleterious(0.01) | probably_damaging(0.947) | TCGA-AC-A23H-01 | Breast | breast invasive carcinoma | Female | >=65 | I/II | Unknown | Unknown | PD | |
| RANGRF | SNV | Missense_Mutation | rs552055941 | c.466N>A | p.Glu156Lys | p.E156K | Q9HD47 | protein_coding | tolerated(0.83) | benign(0.003) | TCGA-PE-A5DE-01 | Breast | breast invasive carcinoma | Female | <65 | I/II | Chemotherapy | taxotere | CR |
| RANGRF | SNV | Missense_Mutation | c.60G>A | p.Met20Ile | p.M20I | Q9HD47 | protein_coding | tolerated(0.15) | benign(0.001) | TCGA-AA-3821-01 | Colorectum | colon adenocarcinoma | Female | >=65 | I/II | Unknown | Unknown | SD | |
| RANGRF | SNV | Missense_Mutation | novel | c.275A>G | p.Asn92Ser | p.N92S | Q9HD47 | protein_coding | tolerated(0.59) | benign(0.005) | TCGA-D1-A175-01 | Endometrium | uterine corpus endometrioid carcinoma | Female | <65 | I/II | Chemotherapy | paclitaxel | SD |
| RANGRF | SNV | Missense_Mutation | c.221N>C | p.Val74Ala | p.V74A | Q9HD47 | protein_coding | tolerated(0.51) | benign(0.022) | TCGA-D1-A177-01 | Endometrium | uterine corpus endometrioid carcinoma | Female | >=65 | I/II | Unknown | Unknown | PD | |
| RANGRF | SNV | Missense_Mutation | c.443A>G | p.Asp148Gly | p.D148G | Q9HD47 | protein_coding | tolerated(0.41) | benign(0) | TCGA-53-7813-01 | Lung | lung adenocarcinoma | Female | <65 | III/IV | Chemotherapy | cisplatin | SD | |
| RANGRF | deletion | In_Frame_Del | novel | c.251_280delNNNNNNNNNNNNNNNNNNNNNNNNNNNNNN | p.Val85_Ala94del | p.V85_A94del | Q9HD47 | protein_coding | TCGA-05-5715-01 | Lung | lung adenocarcinoma | Female | >=65 | I/II | Unknown | Unknown | SD | ||
| RANGRF | SNV | Missense_Mutation | rs552055941 | c.466N>A | p.Glu156Lys | p.E156K | Q9HD47 | protein_coding | tolerated(0.83) | benign(0.003) | TCGA-XK-AAIW-01 | Prostate | prostate adenocarcinoma | Male | >=65 | 9 | Unknown | Unknown | PD |
| Page: 1 |
Top |
Related drugs of malignant transformation related genes |
| Identification of chemicals and drugs interact with genes involved in malignant transfromation |
| (DGIdb 4.0) |
| Entrez ID | Symbol | Category | Interaction Types | Drug Claim Name | Drug Name | PMIDs |
| Page: 1 |

Copyright 2023-Present -The University of Texas Health Science Center at Houston |