
|
|||||
|
 | |
| |
| |
| |
| |
| |
|
Gene: RANGAP1 |
Gene summary for RANGAP1 |
| Gene information | Species | Human | Gene symbol | RANGAP1 | Gene ID | 5905 |
| Gene name | Ran GTPase activating protein 1 | |
| Gene Alias | Fug1 | |
| Cytomap | 22q13.2 | |
| Gene Type | protein-coding | GO ID | GO:0006611 | UniProtAcc | A0A024R1U0 |
Top |
Malignant transformation analysis |
| Identification of the aberrant gene expression in precancerous and cancerous lesions by comparing the gene expression of stem-like cells in diseased tissues with normal stem cells |
| Entrez ID | Symbol | Replicates | Species | Organ | Tissue | Adj P-value | Log2FC | Malignancy |
| 5905 | RANGAP1 | LZE2T | Human | Esophagus | ESCC | 9.72e-03 | 8.97e-01 | 0.082 |
| 5905 | RANGAP1 | LZE4T | Human | Esophagus | ESCC | 6.62e-10 | 3.37e-01 | 0.0811 |
| 5905 | RANGAP1 | LZE7T | Human | Esophagus | ESCC | 1.89e-06 | 3.24e-01 | 0.0667 |
| 5905 | RANGAP1 | LZE8T | Human | Esophagus | ESCC | 7.88e-04 | 1.17e-01 | 0.067 |
| 5905 | RANGAP1 | LZE20T | Human | Esophagus | ESCC | 2.20e-06 | 1.54e-01 | 0.0662 |
| 5905 | RANGAP1 | LZE22T | Human | Esophagus | ESCC | 4.27e-11 | 4.01e-01 | 0.068 |
| 5905 | RANGAP1 | LZE24T | Human | Esophagus | ESCC | 3.41e-03 | 1.61e-01 | 0.0596 |
| 5905 | RANGAP1 | LZE21T | Human | Esophagus | ESCC | 1.24e-03 | 3.72e-01 | 0.0655 |
| 5905 | RANGAP1 | LZE6T | Human | Esophagus | ESCC | 1.47e-02 | 1.74e-01 | 0.0845 |
| 5905 | RANGAP1 | P1T-E | Human | Esophagus | ESCC | 1.68e-07 | 4.76e-01 | 0.0875 |
| 5905 | RANGAP1 | P2T-E | Human | Esophagus | ESCC | 2.24e-21 | 3.97e-01 | 0.1177 |
| 5905 | RANGAP1 | P4T-E | Human | Esophagus | ESCC | 4.25e-25 | 5.95e-01 | 0.1323 |
| 5905 | RANGAP1 | P5T-E | Human | Esophagus | ESCC | 2.21e-08 | 3.16e-01 | 0.1327 |
| 5905 | RANGAP1 | P8T-E | Human | Esophagus | ESCC | 1.18e-11 | 1.70e-01 | 0.0889 |
| 5905 | RANGAP1 | P9T-E | Human | Esophagus | ESCC | 6.15e-09 | 1.65e-01 | 0.1131 |
| 5905 | RANGAP1 | P10T-E | Human | Esophagus | ESCC | 4.04e-15 | 5.15e-01 | 0.116 |
| 5905 | RANGAP1 | P11T-E | Human | Esophagus | ESCC | 9.93e-04 | 3.77e-01 | 0.1426 |
| 5905 | RANGAP1 | P12T-E | Human | Esophagus | ESCC | 4.85e-17 | 4.65e-01 | 0.1122 |
| 5905 | RANGAP1 | P15T-E | Human | Esophagus | ESCC | 2.35e-25 | 5.84e-01 | 0.1149 |
| 5905 | RANGAP1 | P16T-E | Human | Esophagus | ESCC | 4.05e-22 | 5.31e-01 | 0.1153 |
| Page: 1 2 3 4 5 6 |
| Tissue | Expression Dynamics | Abbreviation |
| Esophagus | 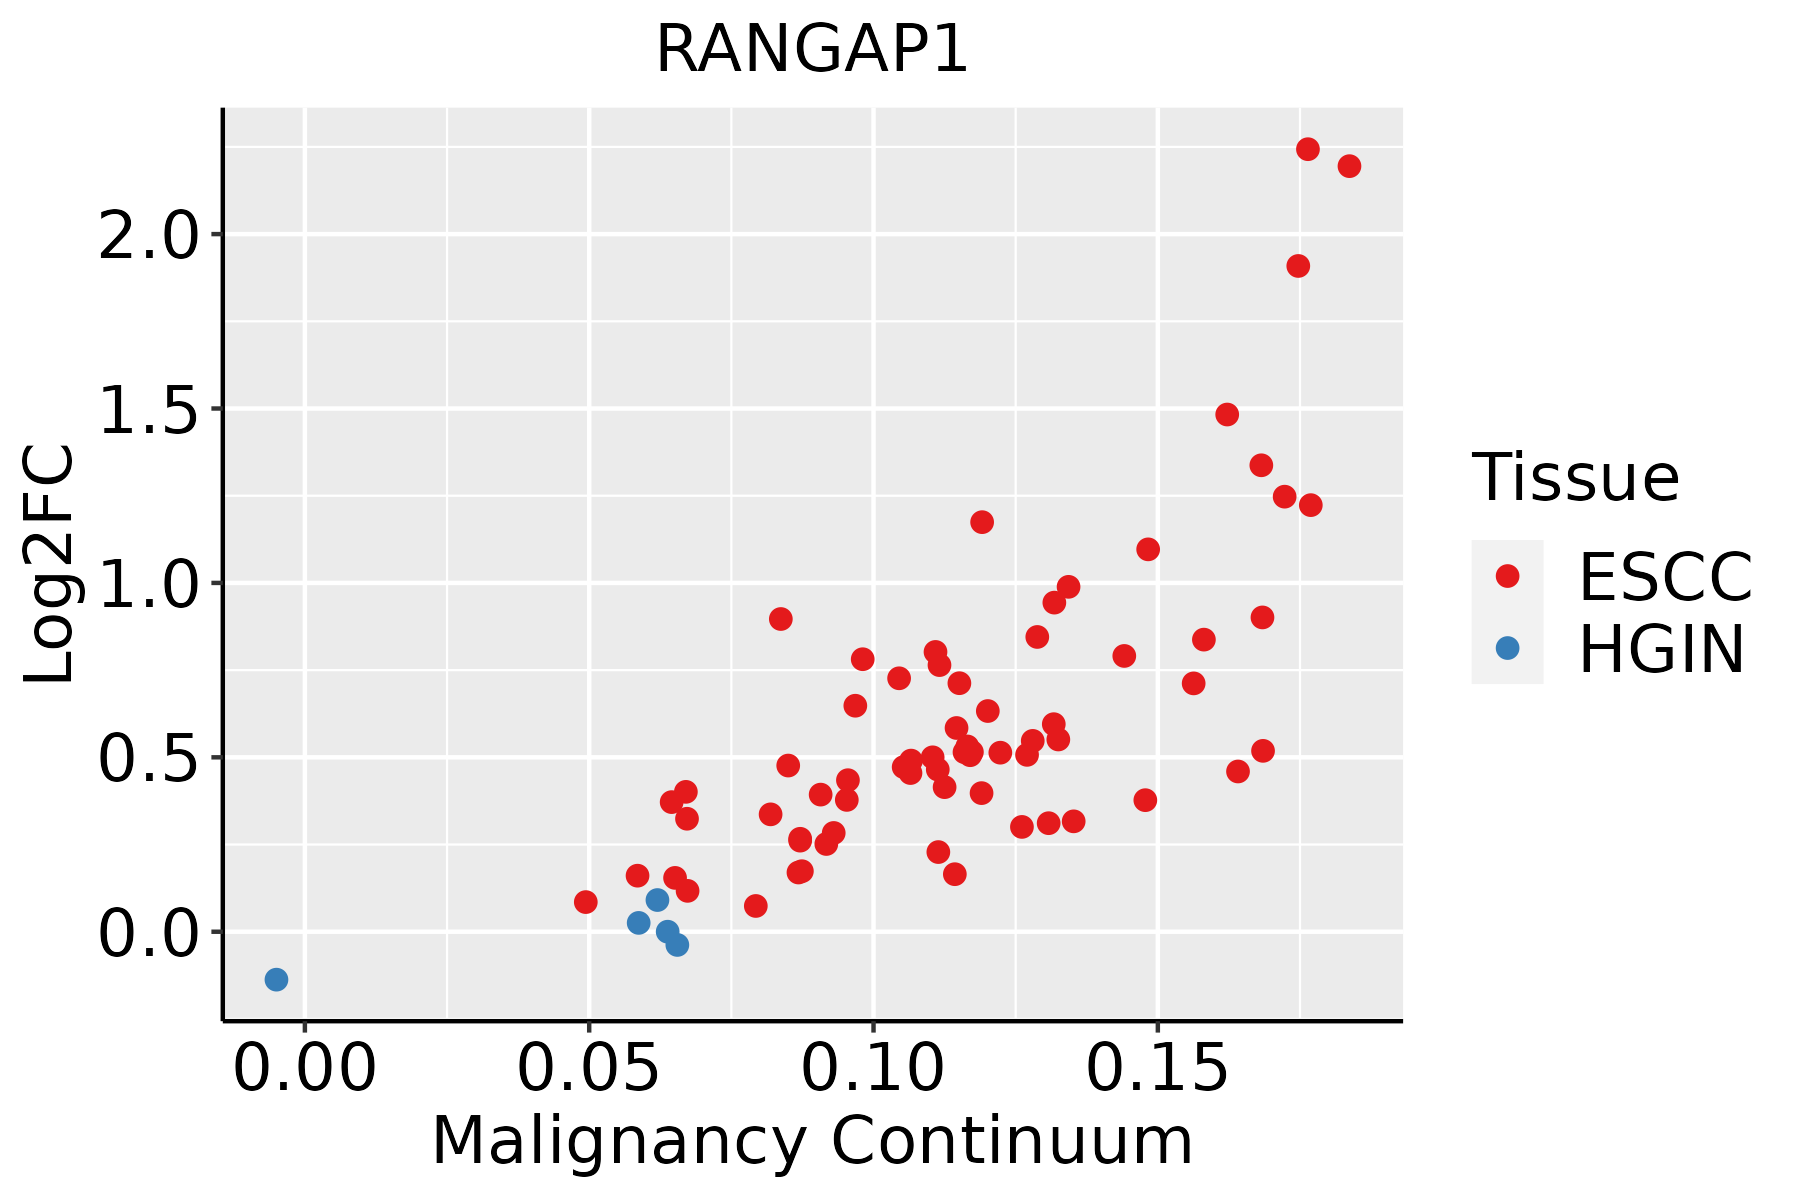 | ESCC: Esophageal squamous cell carcinoma |
| HGIN: High-grade intraepithelial neoplasias | ||
| LGIN: Low-grade intraepithelial neoplasias | ||
| Liver | 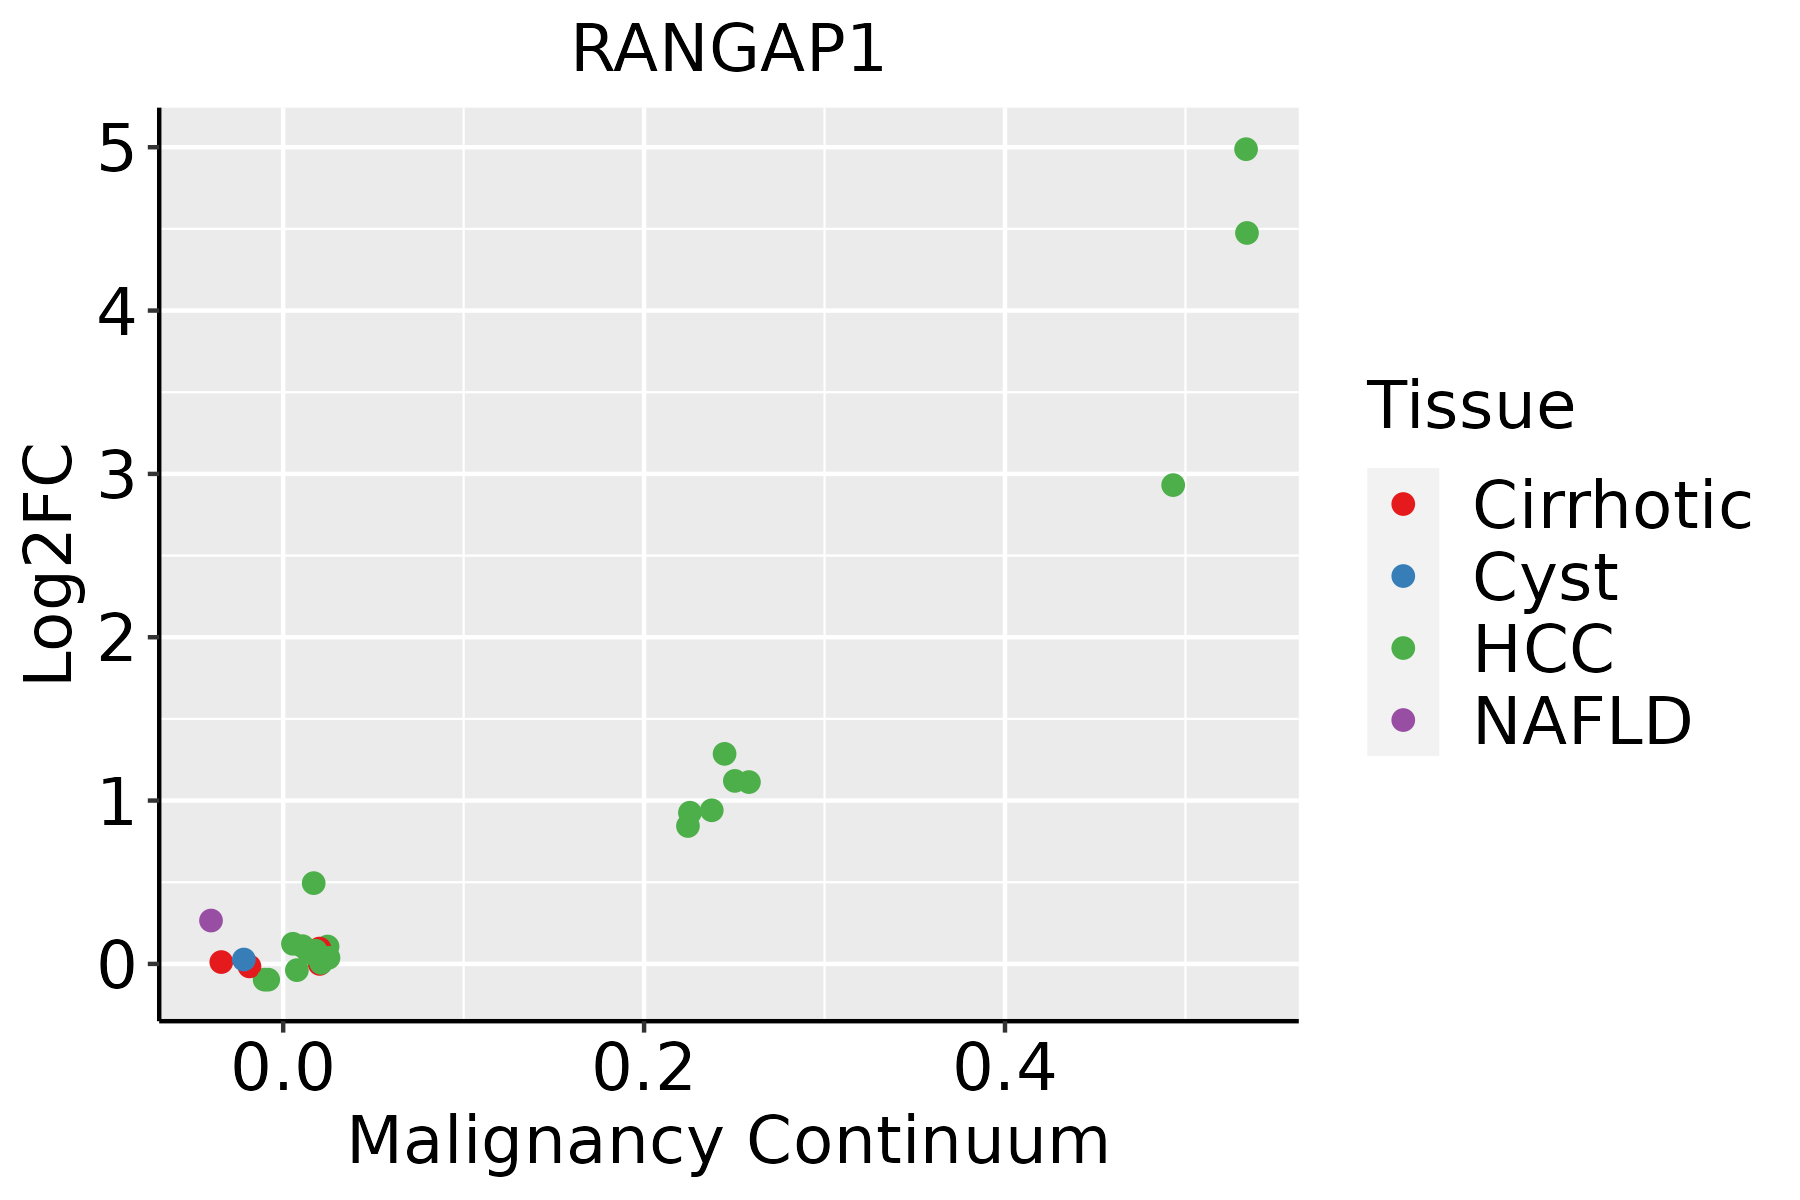 | HCC: Hepatocellular carcinoma |
| NAFLD: Non-alcoholic fatty liver disease | ||
| Oral Cavity |  | EOLP: Erosive Oral lichen planus |
| LP: leukoplakia | ||
| NEOLP: Non-erosive oral lichen planus | ||
| OSCC: Oral squamous cell carcinoma | ||
| Skin |  | AK: Actinic keratosis |
| cSCC: Cutaneous squamous cell carcinoma | ||
| SCCIS:squamous cell carcinoma in situ | ||
| Thyroid | 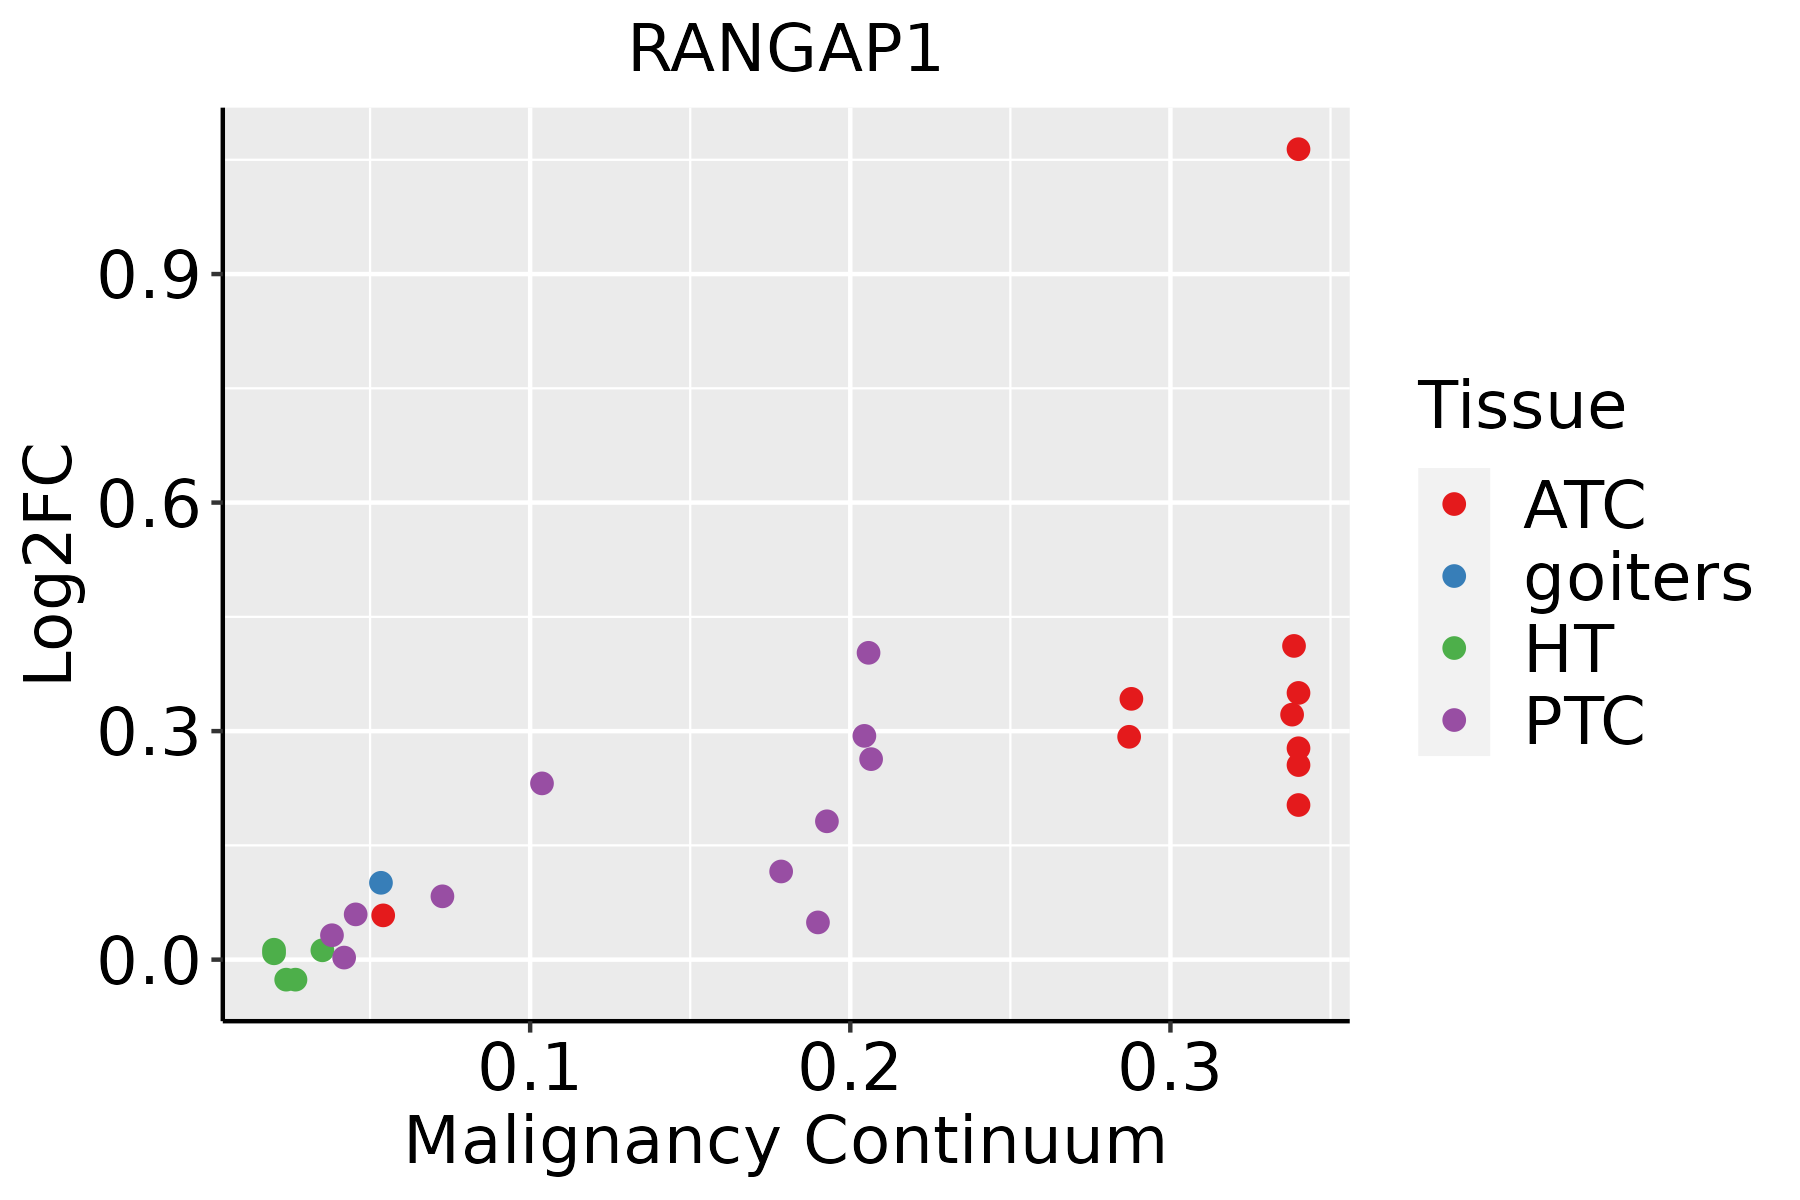 | ATC: Anaplastic thyroid cancer |
| HT: Hashimoto's thyroiditis | ||
| PTC: Papillary thyroid cancer |
| ∗log2FC in expression of this searched gene in stem-like cells from each diseased tissue sample relative to stem-like cells in normal samples in each tissue plotted against the malignancy continuum. Samples are colored based on if they are from different disease stage. |
Top |
Malignant transformation related pathway analysis |
| Find out the enriched GO biological processes and KEGG pathways involved in transition from healthy to precancer to cancer |
| Tissue | Disease Stage | Enriched GO biological Processes |
| Colorectum | AD |  |
| Colorectum | SER |  |
| Colorectum | MSS |  |
| Colorectum | MSI-H |  |
| Colorectum | FAP |  |
| ∗Top 15 enriched GO BP terms are showed in the bar plot of each disease state in each tissue. Each row represents a significant GO biological process which is colored according to the -log10(p.adjust). |
| Page: 1 2 3 4 5 6 7 8 9 |
| GO ID | Tissue | Disease Stage | Description | Gene Ratio | Bg Ratio | pvalue | p.adjust | Count |
| GO:0006913110 | Esophagus | ESCC | nucleocytoplasmic transport | 230/8552 | 301/18723 | 6.04e-28 | 2.02e-25 | 230 |
| GO:0051169110 | Esophagus | ESCC | nuclear transport | 230/8552 | 301/18723 | 6.04e-28 | 2.02e-25 | 230 |
| GO:003238618 | Esophagus | ESCC | regulation of intracellular transport | 243/8552 | 337/18723 | 3.20e-23 | 7.25e-21 | 243 |
| GO:003450418 | Esophagus | ESCC | protein localization to nucleus | 211/8552 | 290/18723 | 4.06e-21 | 6.60e-19 | 211 |
| GO:0051168110 | Esophagus | ESCC | nuclear export | 126/8552 | 154/18723 | 1.88e-20 | 2.65e-18 | 126 |
| GO:0033157110 | Esophagus | ESCC | regulation of intracellular protein transport | 169/8552 | 229/18723 | 3.31e-18 | 3.23e-16 | 169 |
| GO:0046822110 | Esophagus | ESCC | regulation of nucleocytoplasmic transport | 88/8552 | 106/18723 | 1.88e-15 | 1.19e-13 | 88 |
| GO:000661117 | Esophagus | ESCC | protein export from nucleus | 48/8552 | 57/18723 | 1.92e-09 | 4.39e-08 | 48 |
| GO:0045185111 | Esophagus | ESCC | maintenance of protein location | 71/8552 | 94/18723 | 3.41e-09 | 7.24e-08 | 71 |
| GO:0051235110 | Esophagus | ESCC | maintenance of location | 200/8552 | 327/18723 | 1.01e-08 | 2.02e-07 | 200 |
| GO:0032507110 | Esophagus | ESCC | maintenance of protein location in cell | 52/8552 | 65/18723 | 1.41e-08 | 2.77e-07 | 52 |
| GO:007259517 | Esophagus | ESCC | maintenance of protein localization in organelle | 36/8552 | 42/18723 | 8.46e-08 | 1.44e-06 | 36 |
| GO:190165319 | Esophagus | ESCC | cellular response to peptide | 208/8552 | 359/18723 | 1.68e-06 | 2.01e-05 | 208 |
| GO:0046825110 | Esophagus | ESCC | regulation of protein export from nucleus | 26/8552 | 30/18723 | 3.79e-06 | 4.12e-05 | 26 |
| GO:0043434111 | Esophagus | ESCC | response to peptide hormone | 234/8552 | 414/18723 | 4.93e-06 | 5.21e-05 | 234 |
| GO:19038289 | Esophagus | ESCC | negative regulation of cellular protein localization | 76/8552 | 117/18723 | 1.97e-05 | 1.72e-04 | 76 |
| GO:007137516 | Esophagus | ESCC | cellular response to peptide hormone stimulus | 166/8552 | 290/18723 | 4.48e-05 | 3.55e-04 | 166 |
| GO:005145712 | Esophagus | ESCC | maintenance of protein location in nucleus | 20/8552 | 23/18723 | 4.97e-05 | 3.86e-04 | 20 |
| GO:0051651111 | Esophagus | ESCC | maintenance of location in cell | 126/8552 | 214/18723 | 6.57e-05 | 5.00e-04 | 126 |
| GO:00486785 | Esophagus | ESCC | response to axon injury | 51/8552 | 83/18723 | 2.74e-03 | 1.16e-02 | 51 |
| Page: 1 2 3 4 5 6 7 8 9 10 |
| Pathway ID | Tissue | Disease Stage | Description | Gene Ratio | Bg Ratio | pvalue | p.adjust | qvalue | Count |
| hsa0301321 | Esophagus | ESCC | Nucleocytoplasmic transport | 89/4205 | 108/8465 | 1.20e-12 | 2.37e-11 | 1.21e-11 | 89 |
| hsa0301331 | Esophagus | ESCC | Nucleocytoplasmic transport | 89/4205 | 108/8465 | 1.20e-12 | 2.37e-11 | 1.21e-11 | 89 |
| hsa03013 | Liver | HCC | Nucleocytoplasmic transport | 81/4020 | 108/8465 | 4.28e-09 | 6.83e-08 | 3.80e-08 | 81 |
| hsa030131 | Liver | HCC | Nucleocytoplasmic transport | 81/4020 | 108/8465 | 4.28e-09 | 6.83e-08 | 3.80e-08 | 81 |
| hsa030136 | Oral cavity | OSCC | Nucleocytoplasmic transport | 82/3704 | 108/8465 | 7.93e-12 | 1.33e-10 | 6.77e-11 | 82 |
| hsa0301311 | Oral cavity | OSCC | Nucleocytoplasmic transport | 82/3704 | 108/8465 | 7.93e-12 | 1.33e-10 | 6.77e-11 | 82 |
| hsa030132 | Oral cavity | LP | Nucleocytoplasmic transport | 53/2418 | 108/8465 | 4.68e-06 | 4.10e-05 | 2.64e-05 | 53 |
| hsa030133 | Oral cavity | LP | Nucleocytoplasmic transport | 53/2418 | 108/8465 | 4.68e-06 | 4.10e-05 | 2.64e-05 | 53 |
| Page: 1 |
Top |
Cell-cell communication analysis |
| Identification of potential cell-cell interactions between two cell types and their ligand-receptor pairs for different disease states |
| Ligand | Receptor | LRpair | Pathway | Tissue | Disease Stage |
| Page: 1 |
Top |
Single-cell gene regulatory network inference analysis |
| Find out the significant the regulons (TFs) and the target genes of each regulon across cell types for different disease states |
| TF | Cell Type | Tissue | Disease Stage | Target Gene | RSS | Regulon Activity |
| ∗The dot plots of a searched regulon are shown for all cell subpopulations in each disease state of each tissue based on the regulon specific score inferred using pySCENIC and by calculating the average expression. |
| Page: 1 |
Top |
Somatic mutation of malignant transformation related genes |
| Annotation of somatic variants for genes involved in malignant transformation |
| Hugo Symbol | Variant Class | Variant Classification | dbSNP RS | HGVSc | HGVSp | HGVSp Short | SWISSPROT | BIOTYPE | SIFT | PolyPhen | Tumor Sample Barcode | Tissue | Histology | Sex | Age | Stage | Therapy Types | Drugs | Outcome |
| RANGAP1 | SNV | Missense_Mutation | novel | c.563N>C | p.Gly188Ala | p.G188A | P46060 | protein_coding | deleterious(0) | probably_damaging(1) | TCGA-A8-A07W-01 | Breast | breast invasive carcinoma | Female | >=65 | III/IV | Hormone Therapy | exemestane | SD |
| RANGAP1 | SNV | Missense_Mutation | novel | c.215N>T | p.Ala72Val | p.A72V | P46060 | protein_coding | tolerated(0.07) | benign(0.049) | TCGA-A8-A083-01 | Breast | breast invasive carcinoma | Female | >=65 | I/II | Unknown | Unknown | SD |
| RANGAP1 | SNV | Missense_Mutation | c.1052N>T | p.Ala351Val | p.A351V | P46060 | protein_coding | tolerated(0.12) | benign(0.013) | TCGA-AN-A0XN-01 | Breast | breast invasive carcinoma | Female | >=65 | III/IV | Unknown | Unknown | SD | |
| RANGAP1 | SNV | Missense_Mutation | c.49N>G | p.Gln17Glu | p.Q17E | P46060 | protein_coding | tolerated(0.29) | benign(0.021) | TCGA-BH-A0DZ-01 | Breast | breast invasive carcinoma | Female | <65 | I/II | Chemotherapy | docetaxel | SD | |
| RANGAP1 | insertion | Frame_Shift_Ins | novel | c.1188_1189insTTCTCCAGAGCCTCTGTGCCCCTACTTCCCAG | p.Glu397PhefsTer64 | p.E397Ffs*64 | P46060 | protein_coding | TCGA-A8-A07U-01 | Breast | breast invasive carcinoma | Female | >=65 | III/IV | Chemotherapy | 5-fluorouracil | SD | ||
| RANGAP1 | insertion | Frame_Shift_Ins | novel | c.1186_1187insGGGTCCGG | p.Glu396GlyfsTer57 | p.E396Gfs*57 | P46060 | protein_coding | TCGA-A8-A07U-01 | Breast | breast invasive carcinoma | Female | >=65 | III/IV | Chemotherapy | 5-fluorouracil | SD | ||
| RANGAP1 | insertion | Frame_Shift_Ins | novel | c.561_562insCACGTGCCCTCTCCAAGCCTGTTAACCCATCCGAAAATGA | p.Gly188HisfsTer21 | p.G188Hfs*21 | P46060 | protein_coding | TCGA-A8-A07W-01 | Breast | breast invasive carcinoma | Female | >=65 | III/IV | Hormone Therapy | exemestane | SD | ||
| RANGAP1 | insertion | Nonsense_Mutation | novel | c.213_214insTTCTCTTTTTTTGTTTTTTGAGACGGAGTCTCACTCTGTC | p.Ala72PhefsTer7 | p.A72Ffs*7 | P46060 | protein_coding | TCGA-A8-A083-01 | Breast | breast invasive carcinoma | Female | >=65 | I/II | Unknown | Unknown | SD | ||
| RANGAP1 | insertion | In_Frame_Ins | novel | c.1189_1190insTTCAAGTGATTCTTATGCCTCAGCCTCCCA | p.Glu397delinsValGlnValIleLeuMetProGlnProProLys | p.E397delinsVQVILMPQPPK | P46060 | protein_coding | TCGA-AN-A03X-01 | Breast | breast invasive carcinoma | Female | >=65 | I/II | Unknown | Unknown | SD | ||
| RANGAP1 | SNV | Missense_Mutation | rs776060557 | c.277N>T | p.Arg93Trp | p.R93W | P46060 | protein_coding | deleterious(0) | probably_damaging(0.973) | TCGA-A6-2686-01 | Colorectum | colon adenocarcinoma | Female | >=65 | I/II | Unknown | Unknown | SD |
| Page: 1 2 3 4 5 |
Top |
Related drugs of malignant transformation related genes |
| Identification of chemicals and drugs interact with genes involved in malignant transfromation |
| (DGIdb 4.0) |
| Entrez ID | Symbol | Category | Interaction Types | Drug Claim Name | Drug Name | PMIDs |
| Page: 1 |

Copyright 2023-Present -The University of Texas Health Science Center at Houston |