
|
|||||
|
 | |
| |
| |
| |
| |
| |
|
Gene: RANBP17 |
Gene summary for RANBP17 |
| Gene information | Species | Human | Gene symbol | RANBP17 | Gene ID | 64901 |
| Gene name | RAN binding protein 17 | |
| Gene Alias | RANBP17 | |
| Cytomap | 5q35.1 | |
| Gene Type | protein-coding | GO ID | GO:0006403 | UniProtAcc | Q546R4 |
Top |
Malignant transformation analysis |
| Identification of the aberrant gene expression in precancerous and cancerous lesions by comparing the gene expression of stem-like cells in diseased tissues with normal stem cells |
| Entrez ID | Symbol | Replicates | Species | Organ | Tissue | Adj P-value | Log2FC | Malignancy |
| 64901 | RANBP17 | HSIL_HPV_2 | Human | Cervix | HSIL_HPV | 6.89e-12 | 2.72e-01 | 0.0208 |
| 64901 | RANBP17 | CCI_1 | Human | Cervix | CC | 6.67e-10 | 6.85e-01 | 0.528 |
| 64901 | RANBP17 | CCI_2 | Human | Cervix | CC | 3.85e-18 | 1.40e+00 | 0.5249 |
| 64901 | RANBP17 | CCI_3 | Human | Cervix | CC | 2.97e-35 | 1.17e+00 | 0.516 |
| 64901 | RANBP17 | T3 | Human | Cervix | CC | 9.49e-06 | 1.15e-01 | 0.1389 |
| 64901 | RANBP17 | HTA11_3410_2000001011 | Human | Colorectum | AD | 7.91e-20 | -6.44e-01 | 0.0155 |
| 64901 | RANBP17 | HTA11_2487_2000001011 | Human | Colorectum | SER | 6.76e-07 | -6.01e-01 | -0.1808 |
| 64901 | RANBP17 | HTA11_3361_2000001011 | Human | Colorectum | AD | 2.75e-05 | -6.08e-01 | -0.1207 |
| 64901 | RANBP17 | HTA11_83_2000001011 | Human | Colorectum | SER | 1.31e-06 | -6.44e-01 | -0.1526 |
| 64901 | RANBP17 | HTA11_696_2000001011 | Human | Colorectum | AD | 5.93e-11 | -4.84e-01 | -0.1464 |
| 64901 | RANBP17 | HTA11_866_2000001011 | Human | Colorectum | AD | 1.13e-06 | -4.27e-01 | -0.1001 |
| 64901 | RANBP17 | HTA11_2992_2000001011 | Human | Colorectum | SER | 2.02e-02 | -6.62e-01 | -0.1706 |
| 64901 | RANBP17 | HTA11_5212_2000001011 | Human | Colorectum | AD | 9.13e-06 | -8.00e-01 | -0.2061 |
| 64901 | RANBP17 | HTA11_5216_2000001011 | Human | Colorectum | SER | 9.48e-03 | -7.44e-01 | -0.1462 |
| 64901 | RANBP17 | HTA11_866_3004761011 | Human | Colorectum | AD | 1.59e-13 | -6.04e-01 | 0.096 |
| 64901 | RANBP17 | HTA11_8622_2000001021 | Human | Colorectum | SER | 2.20e-02 | -5.68e-01 | 0.0528 |
| 64901 | RANBP17 | HTA11_10711_2000001011 | Human | Colorectum | AD | 1.21e-06 | -5.91e-01 | 0.0338 |
| 64901 | RANBP17 | HTA11_7696_3000711011 | Human | Colorectum | AD | 7.50e-07 | -3.90e-01 | 0.0674 |
| 64901 | RANBP17 | HTA11_99999970781_79442 | Human | Colorectum | MSS | 2.94e-06 | -3.57e-01 | 0.294 |
| 64901 | RANBP17 | HTA11_99999971662_82457 | Human | Colorectum | MSS | 6.77e-09 | -4.97e-01 | 0.3859 |
| Page: 1 2 3 4 5 6 |
| Tissue | Expression Dynamics | Abbreviation |
| Cervix | 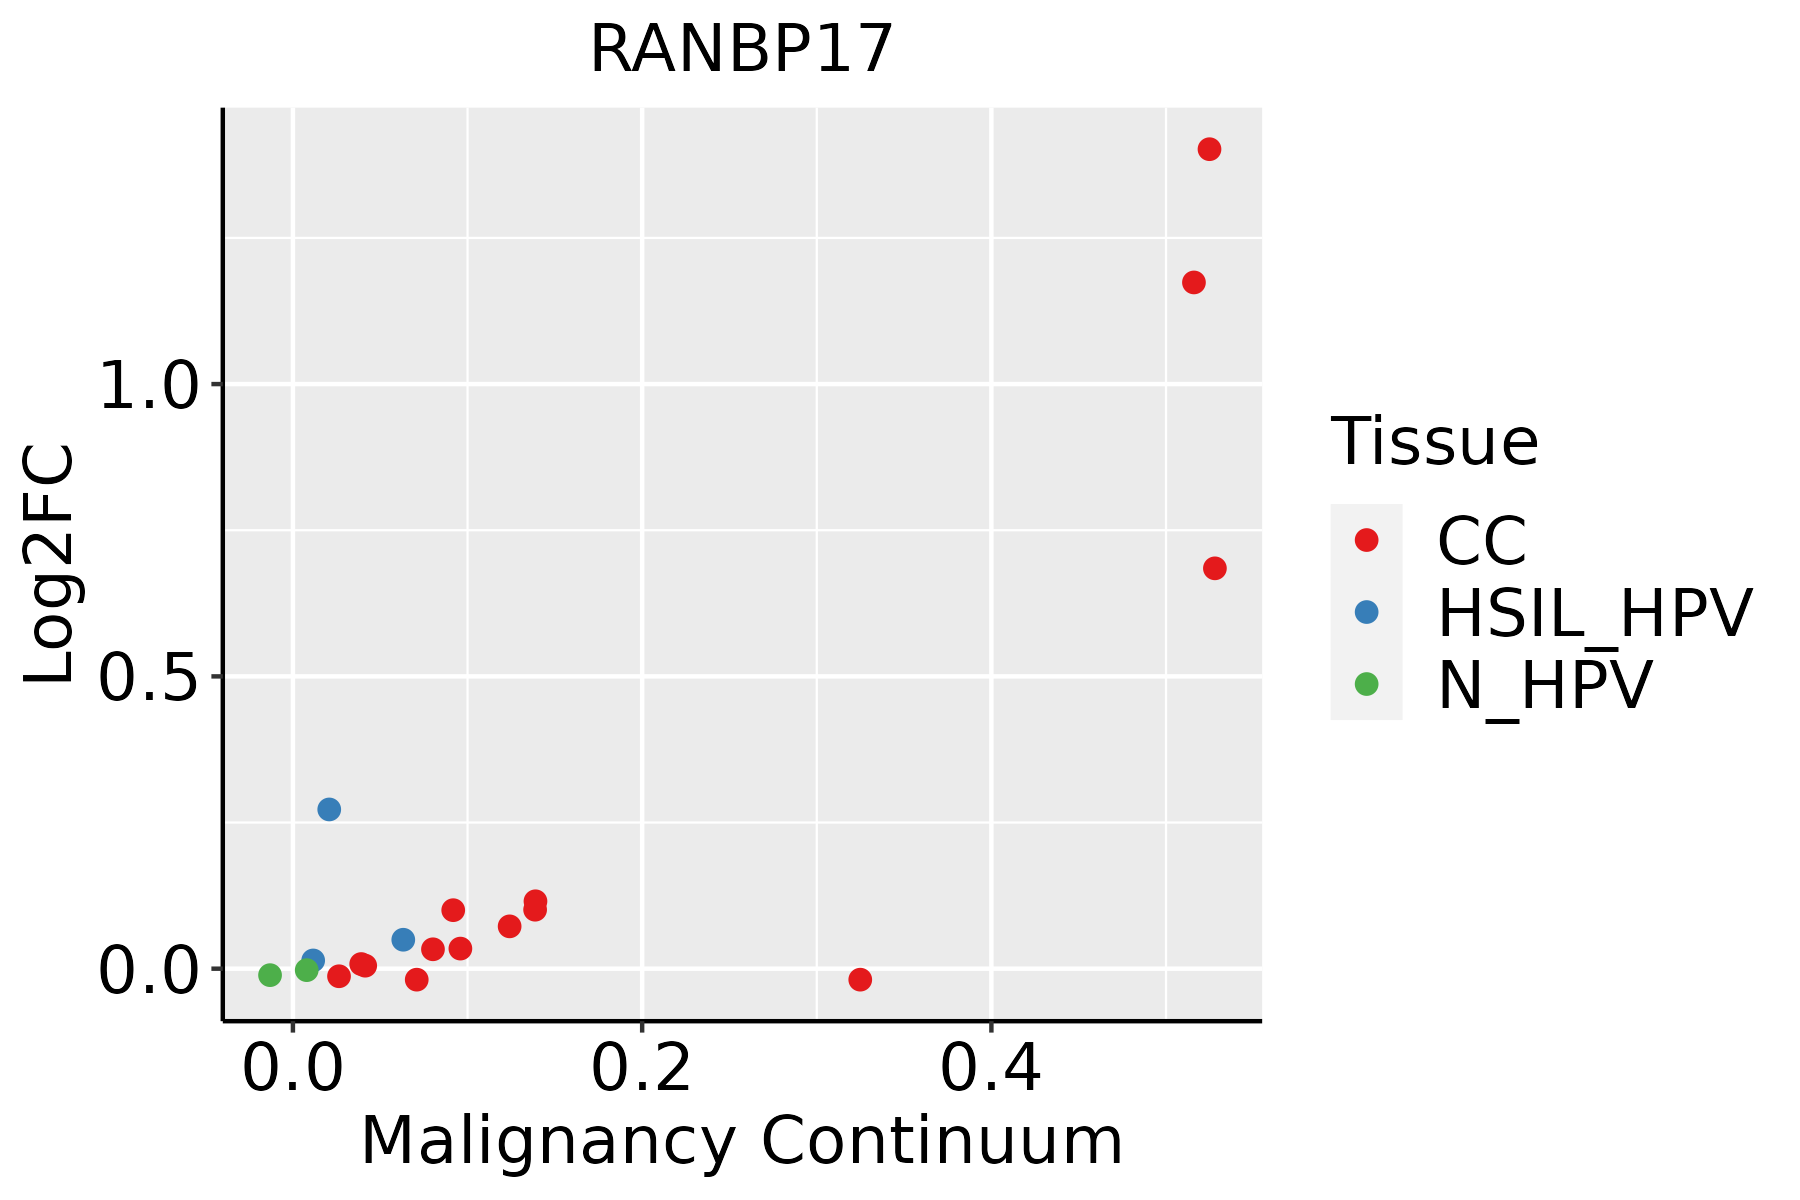 | CC: Cervix cancer |
| HSIL_HPV: HPV-infected high-grade squamous intraepithelial lesions | ||
| N_HPV: HPV-infected normal cervix | ||
| Colorectum (GSE201348) |  | FAP: Familial adenomatous polyposis |
| CRC: Colorectal cancer | ||
| Colorectum (HTA11) |  | AD: Adenomas |
| SER: Sessile serrated lesions | ||
| MSI-H: Microsatellite-high colorectal cancer | ||
| MSS: Microsatellite stable colorectal cancer | ||
| Endometrium | 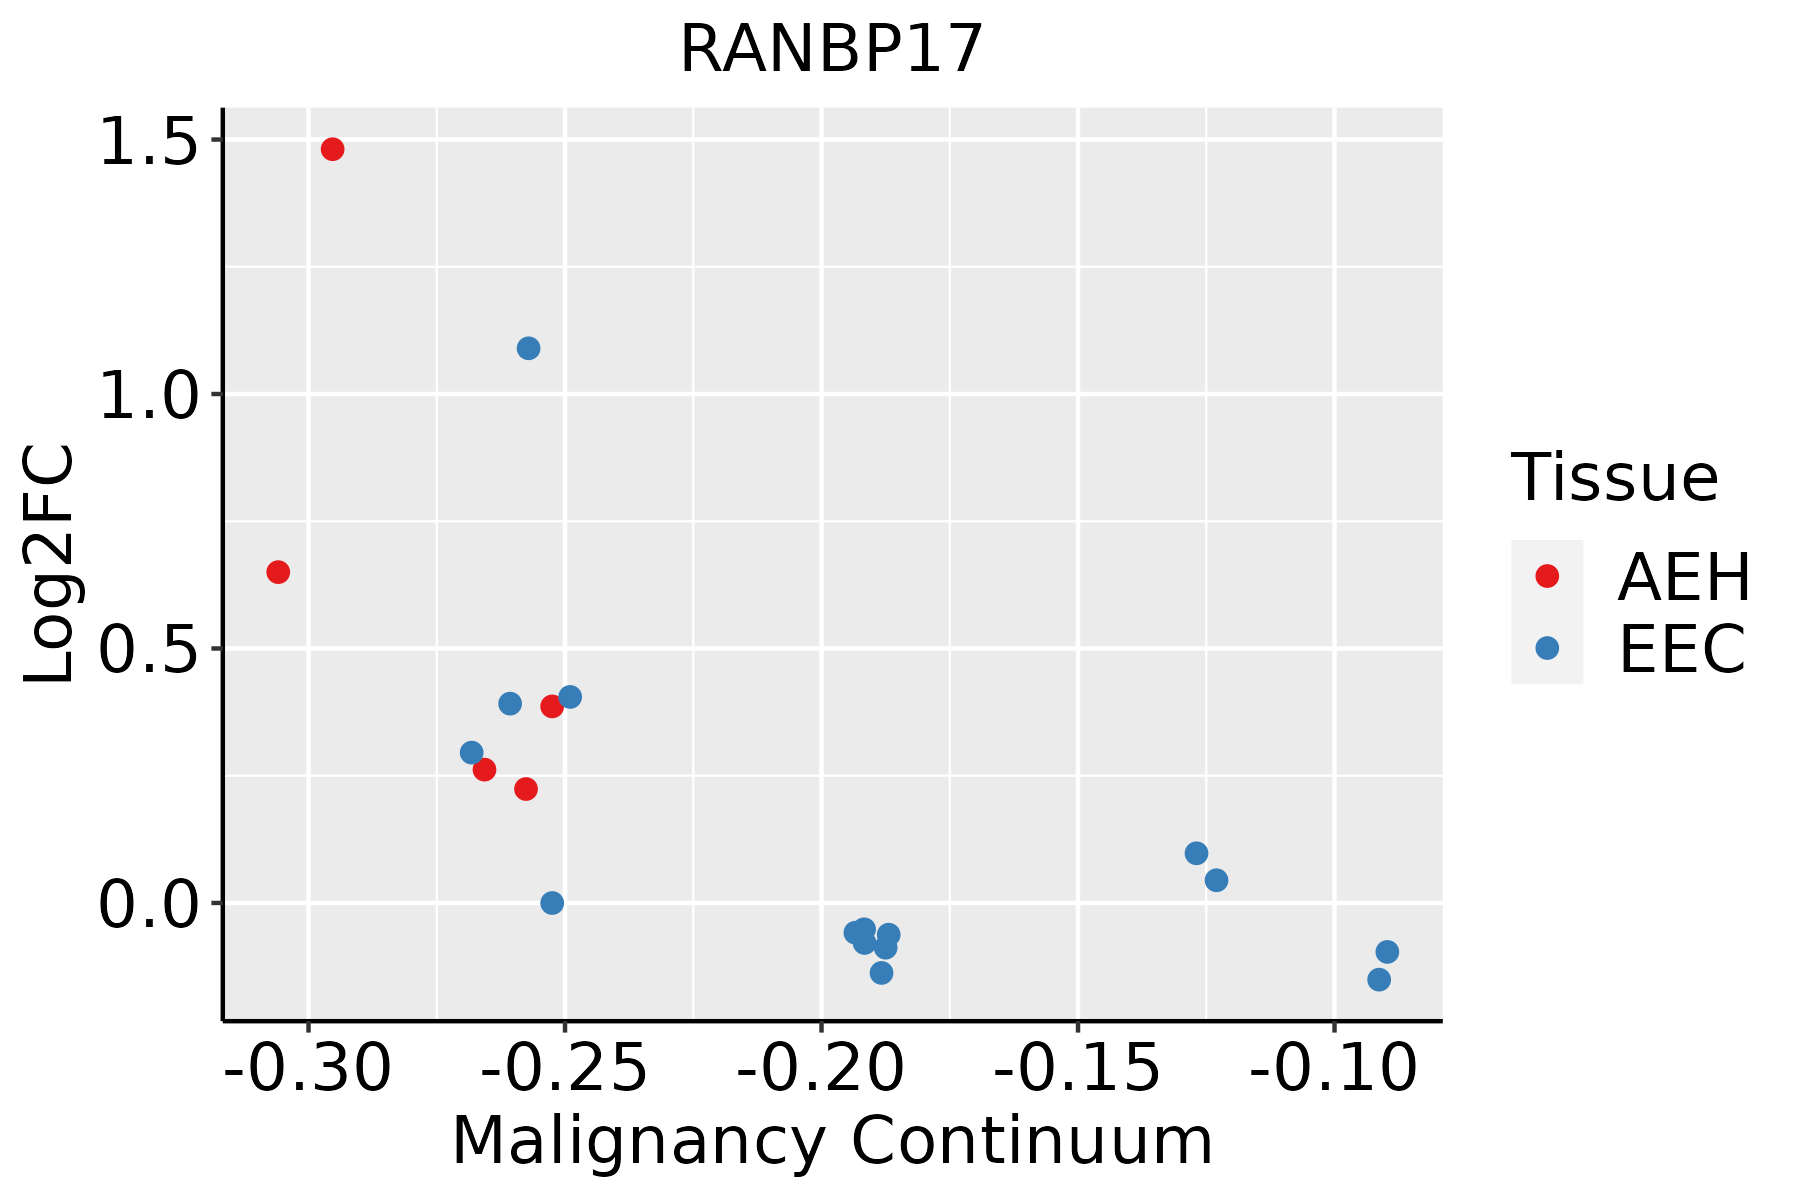 | AEH: Atypical endometrial hyperplasia |
| EEC: Endometrioid Cancer | ||
| Lung | 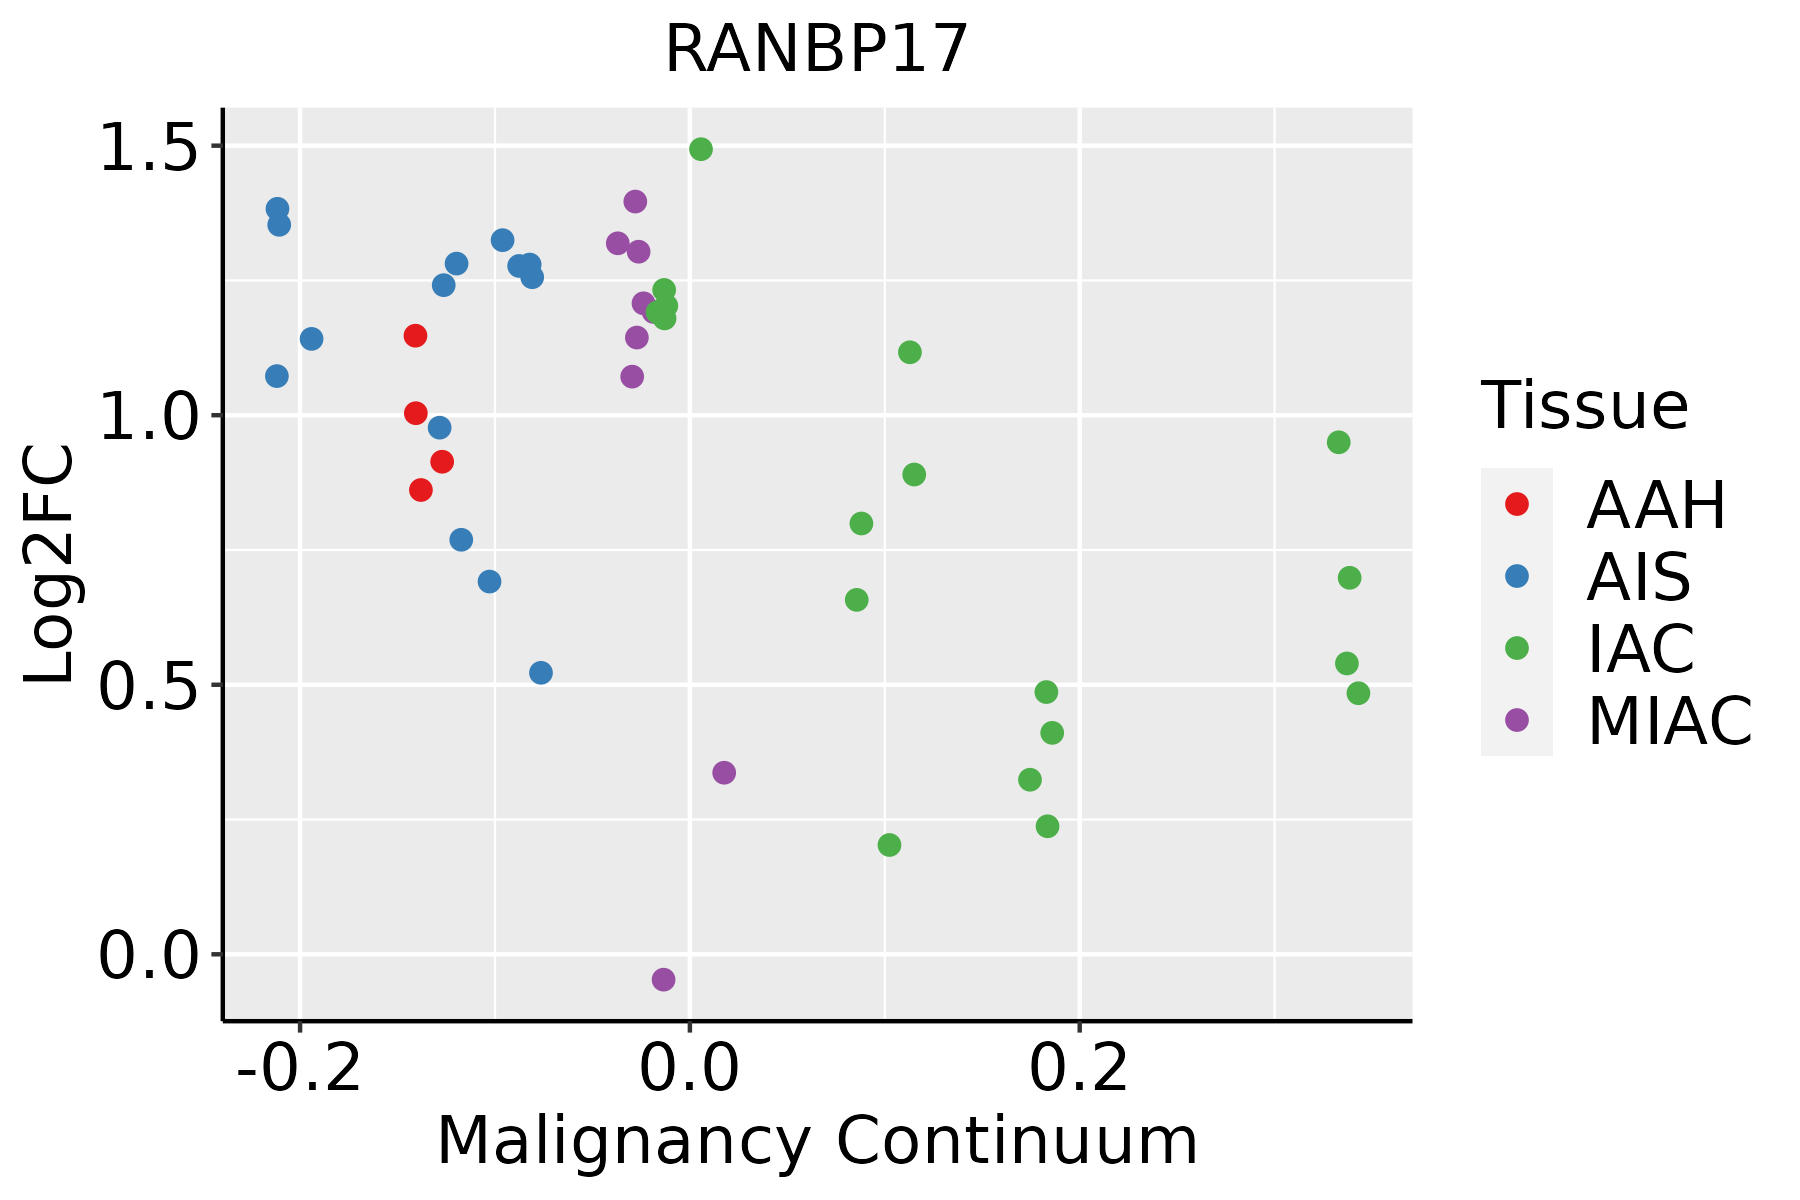 | AAH: Atypical adenomatous hyperplasia |
| AIS: Adenocarcinoma in situ | ||
| IAC: Invasive lung adenocarcinoma | ||
| MIA: Minimally invasive adenocarcinoma | ||
| Thyroid | 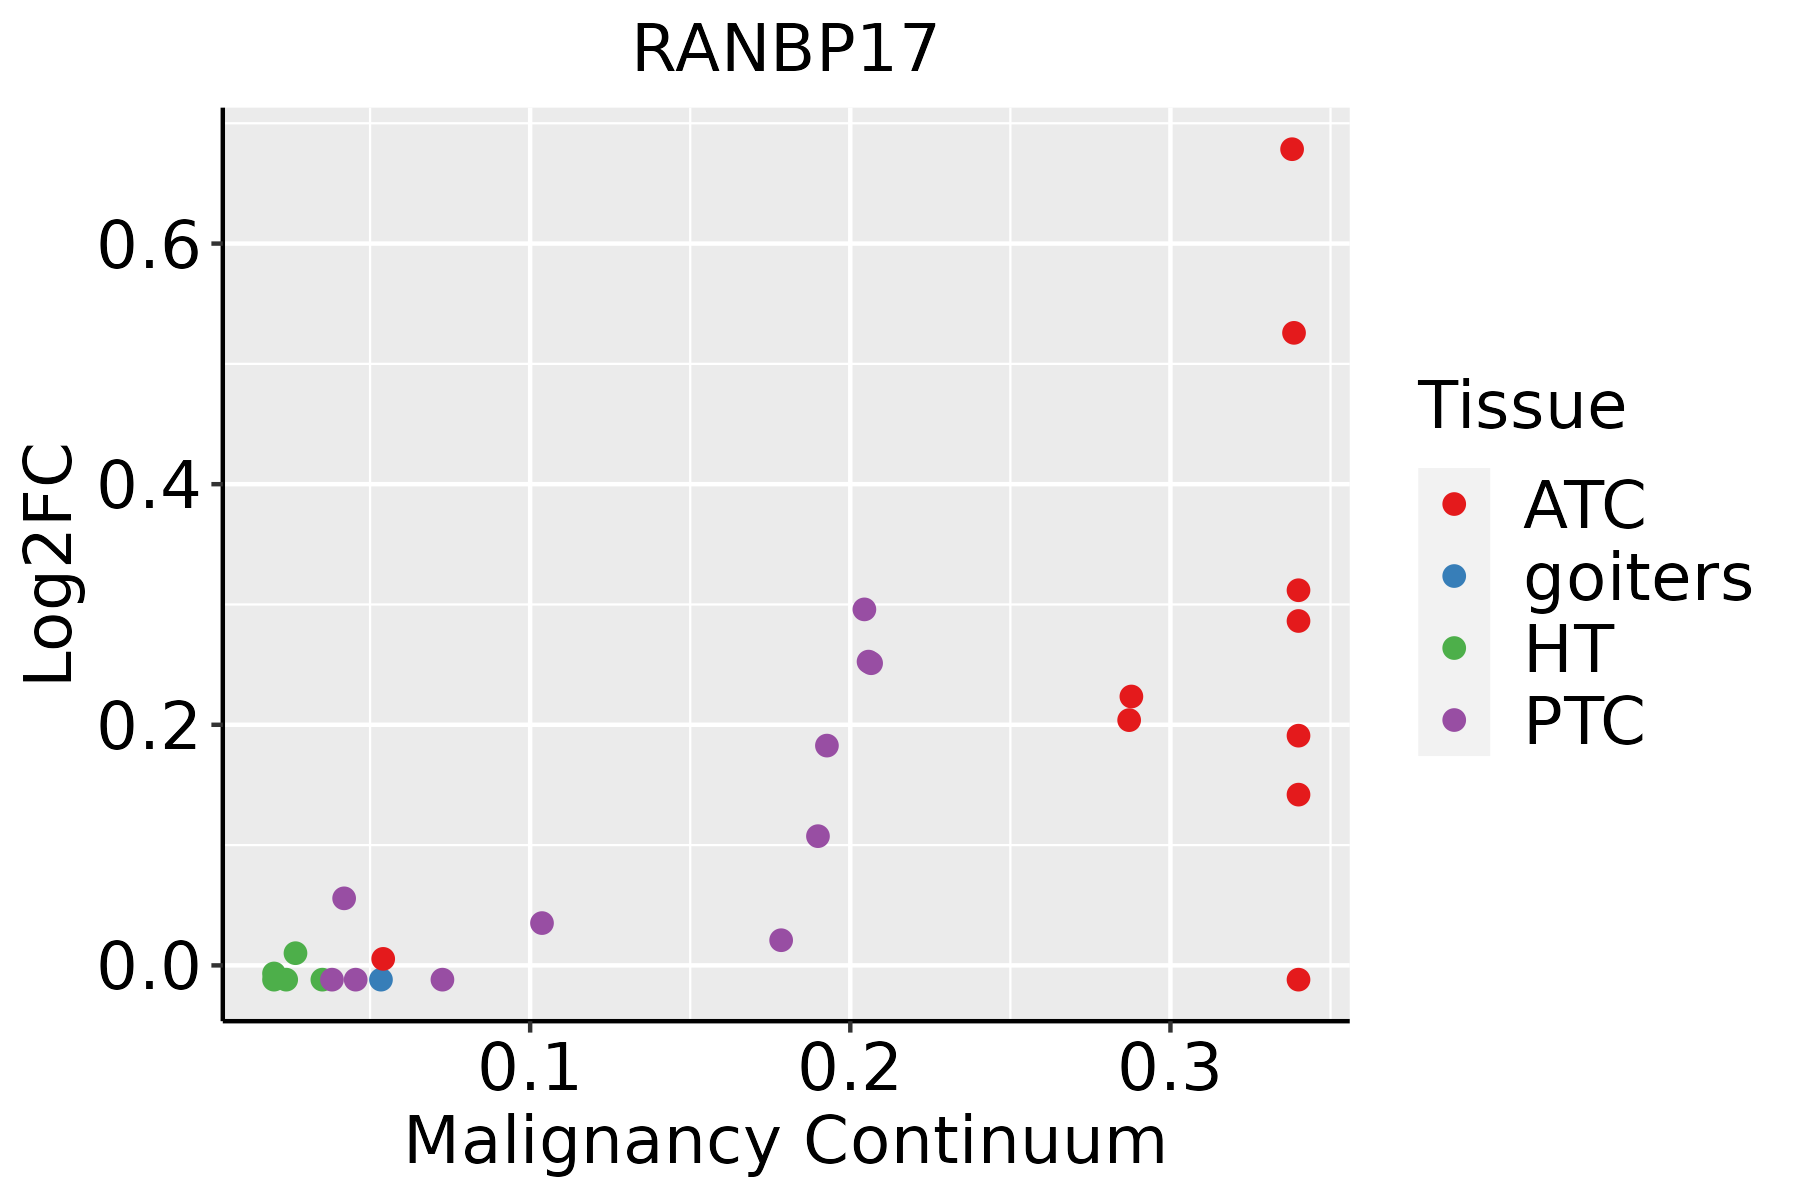 | ATC: Anaplastic thyroid cancer |
| HT: Hashimoto's thyroiditis | ||
| PTC: Papillary thyroid cancer |
| ∗log2FC in expression of this searched gene in stem-like cells from each diseased tissue sample relative to stem-like cells in normal samples in each tissue plotted against the malignancy continuum. Samples are colored based on if they are from different disease stage. |
Top |
Malignant transformation related pathway analysis |
| Find out the enriched GO biological processes and KEGG pathways involved in transition from healthy to precancer to cancer |
| Tissue | Disease Stage | Enriched GO biological Processes |
| Colorectum | AD |  |
| Colorectum | SER |  |
| Colorectum | MSS |  |
| Colorectum | MSI-H |  |
| Colorectum | FAP |  |
| ∗Top 15 enriched GO BP terms are showed in the bar plot of each disease state in each tissue. Each row represents a significant GO biological process which is colored according to the -log10(p.adjust). |
| Page: 1 2 3 4 5 6 7 8 9 |
| GO ID | Tissue | Disease Stage | Description | Gene Ratio | Bg Ratio | pvalue | p.adjust | Count |
| GO:00725949 | Cervix | CC | establishment of protein localization to organelle | 99/2311 | 422/18723 | 1.23e-10 | 2.11e-08 | 99 |
| GO:00069139 | Cervix | CC | nucleocytoplasmic transport | 71/2311 | 301/18723 | 4.04e-08 | 2.54e-06 | 71 |
| GO:00511699 | Cervix | CC | nuclear transport | 71/2311 | 301/18723 | 4.04e-08 | 2.54e-06 | 71 |
| GO:00345048 | Cervix | CC | protein localization to nucleus | 68/2311 | 290/18723 | 9.91e-08 | 5.25e-06 | 68 |
| GO:00170388 | Cervix | CC | protein import | 48/2311 | 206/18723 | 8.62e-06 | 1.98e-04 | 48 |
| GO:00511689 | Cervix | CC | nuclear export | 38/2311 | 154/18723 | 1.86e-05 | 3.46e-04 | 38 |
| GO:00511707 | Cervix | CC | import into nucleus | 38/2311 | 159/18723 | 3.98e-05 | 6.18e-04 | 38 |
| GO:00512368 | Cervix | CC | establishment of RNA localization | 39/2311 | 166/18723 | 4.76e-05 | 7.25e-04 | 39 |
| GO:00066067 | Cervix | CC | protein import into nucleus | 37/2311 | 155/18723 | 5.13e-05 | 7.71e-04 | 37 |
| GO:00506578 | Cervix | CC | nucleic acid transport | 38/2311 | 163/18723 | 7.06e-05 | 9.85e-04 | 38 |
| GO:00506588 | Cervix | CC | RNA transport | 38/2311 | 163/18723 | 7.06e-05 | 9.85e-04 | 38 |
| GO:000640310 | Cervix | CC | RNA localization | 43/2311 | 201/18723 | 2.00e-04 | 2.29e-03 | 43 |
| GO:00510284 | Cervix | CC | mRNA transport | 31/2311 | 130/18723 | 2.05e-04 | 2.33e-03 | 31 |
| GO:00066116 | Cervix | CC | protein export from nucleus | 17/2311 | 57/18723 | 3.61e-04 | 3.75e-03 | 17 |
| GO:00159318 | Cervix | CC | nucleobase-containing compound transport | 43/2311 | 222/18723 | 1.72e-03 | 1.30e-02 | 43 |
| GO:007259414 | Cervix | HSIL_HPV | establishment of protein localization to organelle | 29/737 | 422/18723 | 2.71e-03 | 2.58e-02 | 29 |
| GO:003450412 | Cervix | HSIL_HPV | protein localization to nucleus | 21/737 | 290/18723 | 5.53e-03 | 4.45e-02 | 21 |
| GO:0072594 | Colorectum | AD | establishment of protein localization to organelle | 148/3918 | 422/18723 | 7.95e-12 | 1.04e-09 | 148 |
| GO:0006913 | Colorectum | AD | nucleocytoplasmic transport | 102/3918 | 301/18723 | 1.00e-07 | 4.85e-06 | 102 |
| GO:0051169 | Colorectum | AD | nuclear transport | 102/3918 | 301/18723 | 1.00e-07 | 4.85e-06 | 102 |
| Page: 1 2 3 4 5 6 7 8 |
| Pathway ID | Tissue | Disease Stage | Description | Gene Ratio | Bg Ratio | pvalue | p.adjust | qvalue | Count |
| Page: 1 |
Top |
Cell-cell communication analysis |
| Identification of potential cell-cell interactions between two cell types and their ligand-receptor pairs for different disease states |
| Ligand | Receptor | LRpair | Pathway | Tissue | Disease Stage |
| Page: 1 |
Top |
Single-cell gene regulatory network inference analysis |
| Find out the significant the regulons (TFs) and the target genes of each regulon across cell types for different disease states |
| TF | Cell Type | Tissue | Disease Stage | Target Gene | RSS | Regulon Activity |
| ∗The dot plots of a searched regulon are shown for all cell subpopulations in each disease state of each tissue based on the regulon specific score inferred using pySCENIC and by calculating the average expression. |
| Page: 1 |
Top |
Somatic mutation of malignant transformation related genes |
| Annotation of somatic variants for genes involved in malignant transformation |
| Hugo Symbol | Variant Class | Variant Classification | dbSNP RS | HGVSc | HGVSp | HGVSp Short | SWISSPROT | BIOTYPE | SIFT | PolyPhen | Tumor Sample Barcode | Tissue | Histology | Sex | Age | Stage | Therapy Types | Drugs | Outcome |
| RANBP17 | SNV | Missense_Mutation | c.1711N>T | p.Val571Leu | p.V571L | Q9H2T7 | protein_coding | tolerated(0.4) | benign(0.02) | TCGA-AO-A0J6-01 | Breast | breast invasive carcinoma | Female | <65 | I/II | Chemotherapy | doxorubicin | SD | |
| RANBP17 | SNV | Missense_Mutation | c.1546G>A | p.Asp516Asn | p.D516N | Q9H2T7 | protein_coding | deleterious(0.05) | possibly_damaging(0.803) | TCGA-BH-A0C0-01 | Breast | breast invasive carcinoma | Female | <65 | I/II | Chemotherapy | carboplatin | SD | |
| RANBP17 | SNV | Missense_Mutation | rs374800221 | c.562N>A | p.Val188Ile | p.V188I | Q9H2T7 | protein_coding | tolerated(1) | benign(0) | TCGA-BH-A0C7-01 | Breast | breast invasive carcinoma | Female | <65 | I/II | Chemotherapy | adriamycin | CR |
| RANBP17 | SNV | Missense_Mutation | c.353G>T | p.Gly118Val | p.G118V | Q9H2T7 | protein_coding | deleterious(0) | probably_damaging(0.924) | TCGA-C8-A275-01 | Breast | breast invasive carcinoma | Female | <65 | I/II | Unknown | Unknown | SD | |
| RANBP17 | SNV | Missense_Mutation | novel | c.1893G>C | p.Lys631Asn | p.K631N | Q9H2T7 | protein_coding | deleterious(0) | probably_damaging(0.969) | TCGA-C8-A8HQ-01 | Breast | breast invasive carcinoma | Female | <65 | I/II | Unknown | Unknown | SD |
| RANBP17 | SNV | Missense_Mutation | rs201284839 | c.2348N>A | p.Arg783His | p.R783H | Q9H2T7 | protein_coding | deleterious(0) | probably_damaging(0.998) | TCGA-D8-A145-01 | Breast | breast invasive carcinoma | Female | >=65 | I/II | Hormone Therapy | tamoxiphen | SD |
| RANBP17 | SNV | Missense_Mutation | novel | c.1603N>G | p.Thr535Ala | p.T535A | Q9H2T7 | protein_coding | tolerated(0.38) | benign(0) | TCGA-D8-A1JP-01 | Breast | breast invasive carcinoma | Female | >=65 | I/II | Hormone Therapy | tamoxiphen | SD |
| RANBP17 | SNV | Missense_Mutation | rs146643977 | c.2758G>A | p.Glu920Lys | p.E920K | Q9H2T7 | protein_coding | tolerated(0.27) | benign(0.022) | TCGA-E2-A159-01 | Breast | breast invasive carcinoma | Female | <65 | I/II | Chemotherapy | cyclophosphamide | SD |
| RANBP17 | SNV | Missense_Mutation | rs201196825 | c.1910N>G | p.Phe637Cys | p.F637C | Q9H2T7 | protein_coding | deleterious(0) | probably_damaging(0.99) | TCGA-A6-4107-01 | Colorectum | colon adenocarcinoma | Female | <65 | III/IV | Chemotherapy | 5 | SD |
| RANBP17 | SNV | Missense_Mutation | c.1343N>G | p.Val448Gly | p.V448G | Q9H2T7 | protein_coding | deleterious(0) | possibly_damaging(0.703) | TCGA-AA-3696-01 | Colorectum | colon adenocarcinoma | Female | >=65 | III/IV | Unknown | Unknown | PD |
| Page: 1 2 3 4 5 6 7 8 9 10 11 |
Top |
Related drugs of malignant transformation related genes |
| Identification of chemicals and drugs interact with genes involved in malignant transfromation |
| (DGIdb 4.0) |
| Entrez ID | Symbol | Category | Interaction Types | Drug Claim Name | Drug Name | PMIDs |
| Page: 1 |

Copyright 2023-Present -The University of Texas Health Science Center at Houston |