| Tissue | Expression Dynamics | Abbreviation |
| Breast | 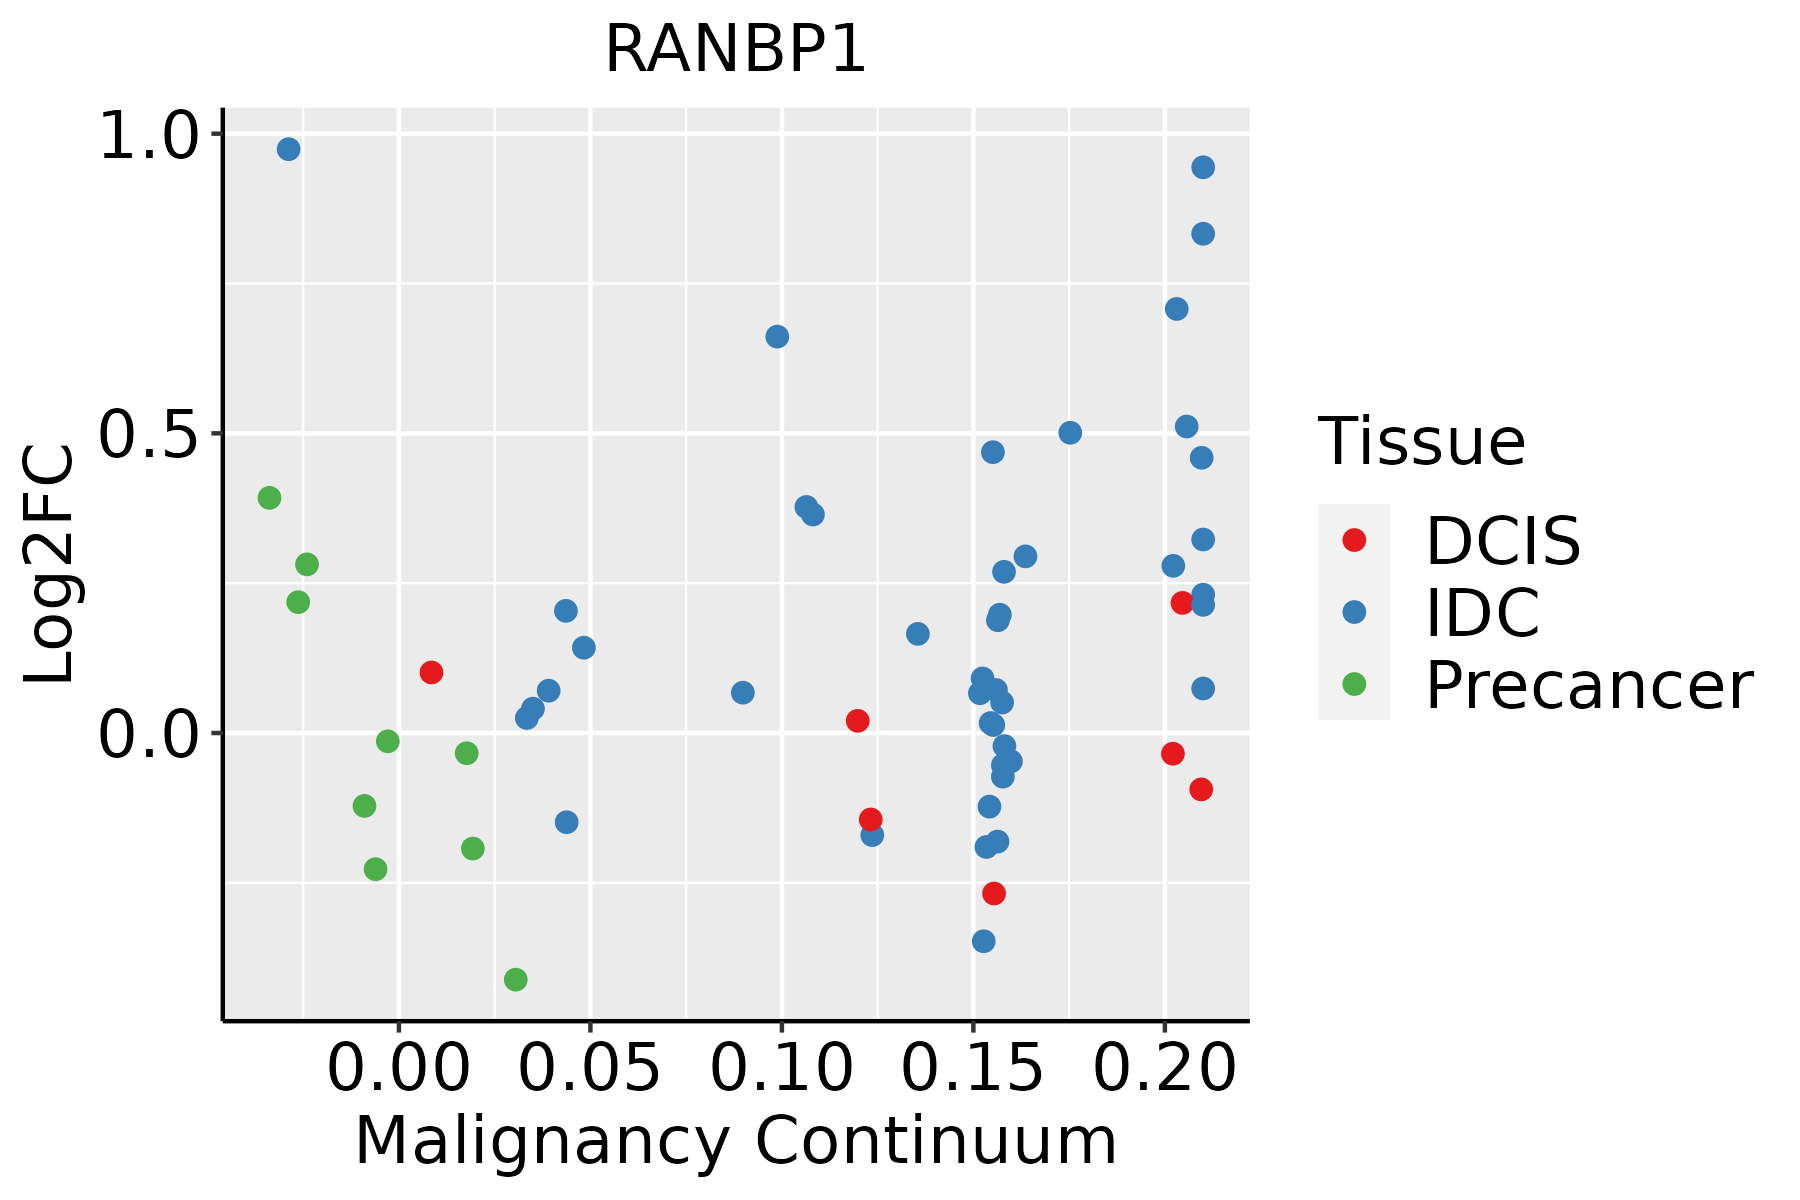 | IDC: Invasive ductal carcinoma |
| DCIS: Ductal carcinoma in situ |
| Precancer(BRCA1-mut): Precancerous lesion from BRCA1 mutation carriers |
| Colorectum (GSE201348) |  | FAP: Familial adenomatous polyposis |
| CRC: Colorectal cancer |
| Colorectum (HTA11) |  | AD: Adenomas |
| SER: Sessile serrated lesions |
| MSI-H: Microsatellite-high colorectal cancer |
| MSS: Microsatellite stable colorectal cancer |
| Endometrium | 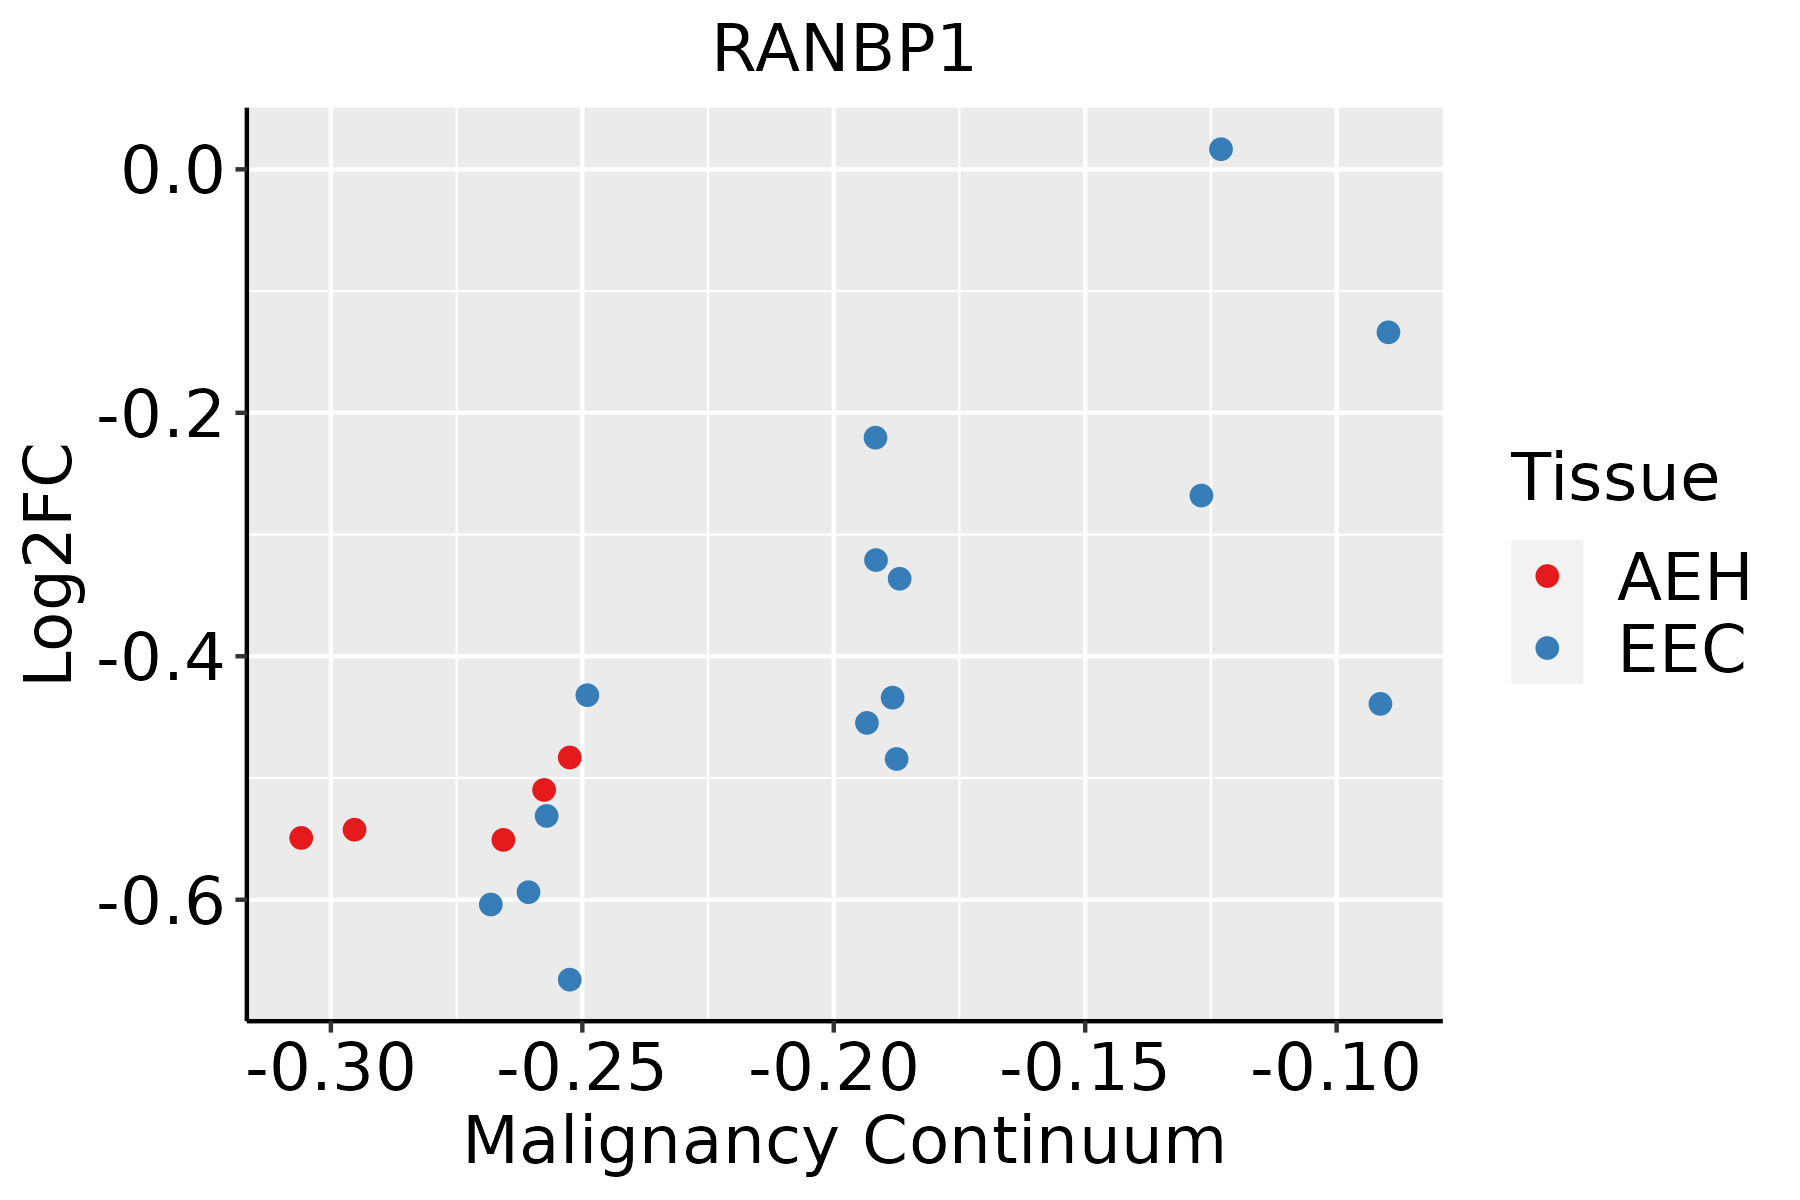 | AEH: Atypical endometrial hyperplasia |
| EEC: Endometrioid Cancer |
| Esophagus | 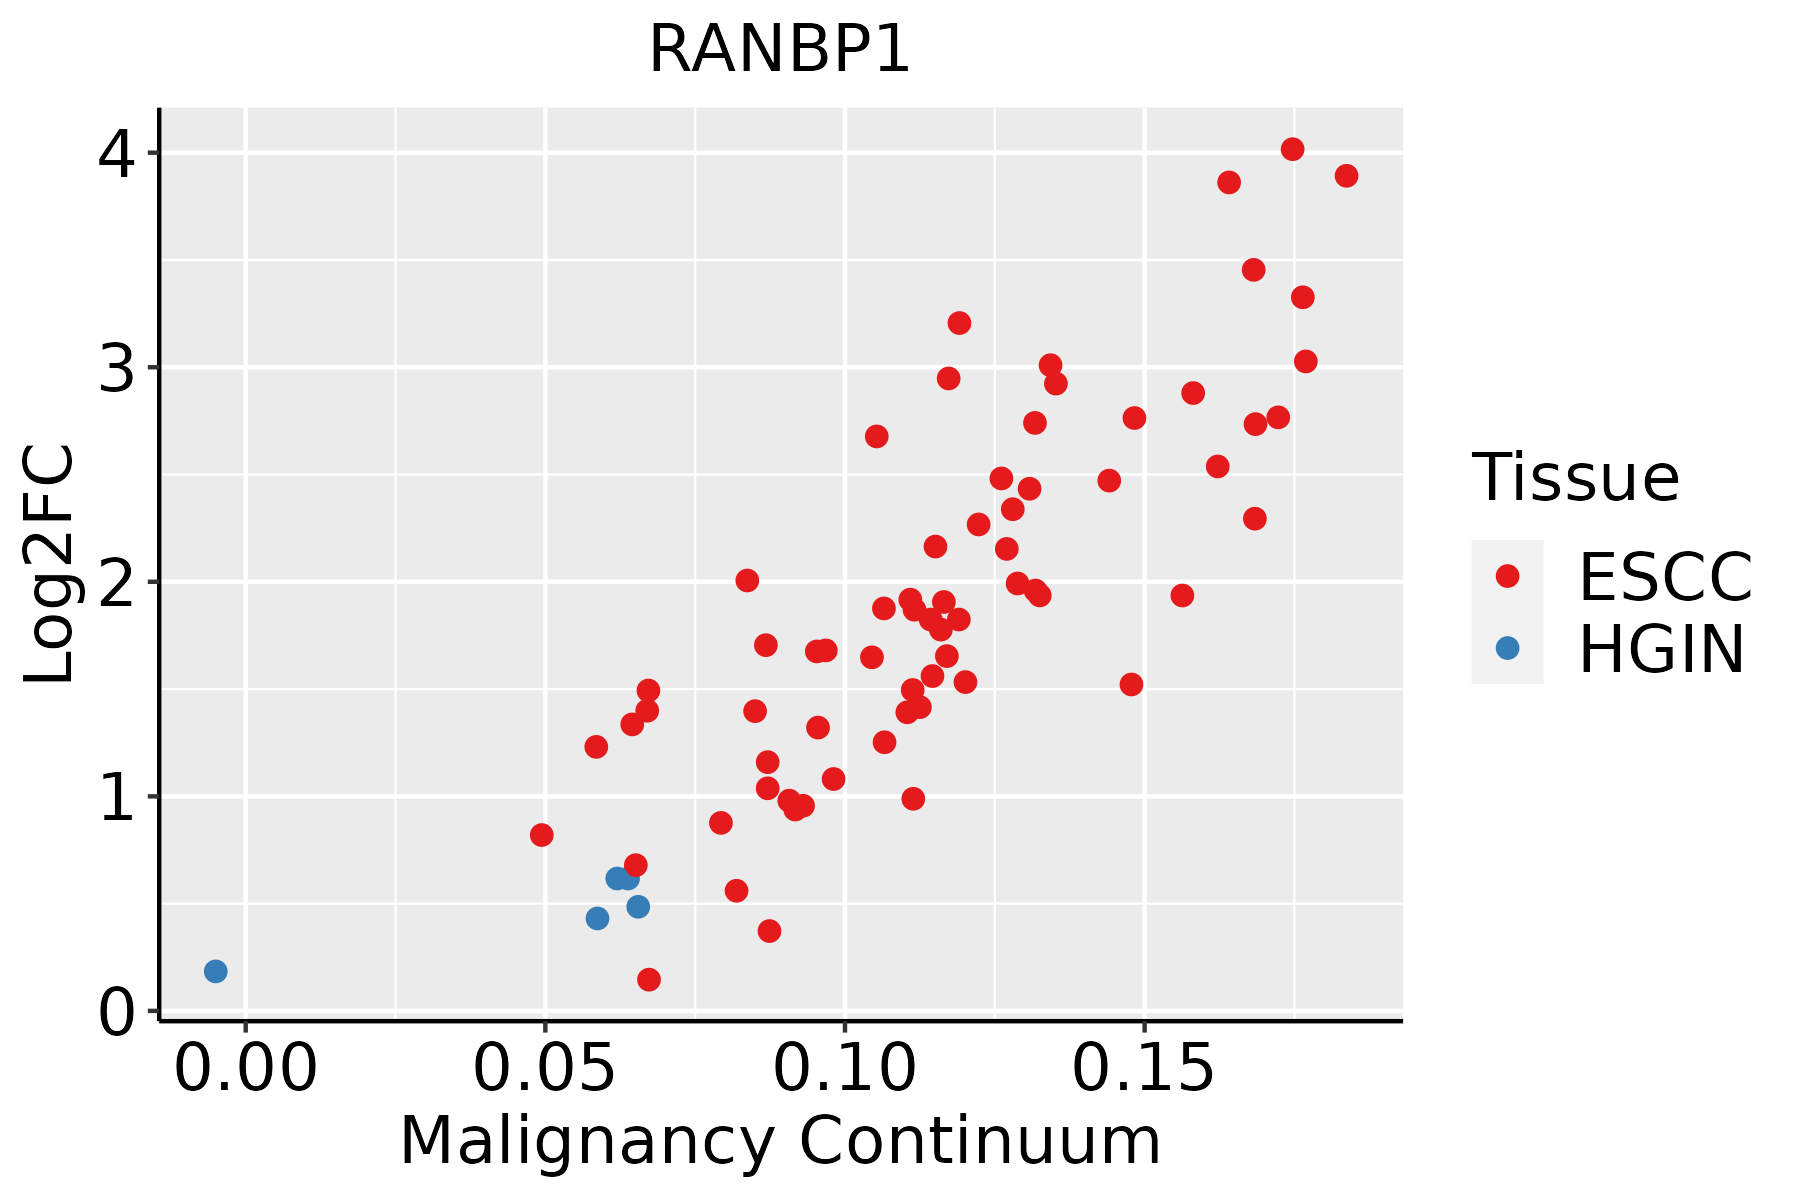 | ESCC: Esophageal squamous cell carcinoma |
| HGIN: High-grade intraepithelial neoplasias |
| LGIN: Low-grade intraepithelial neoplasias |
| GC | 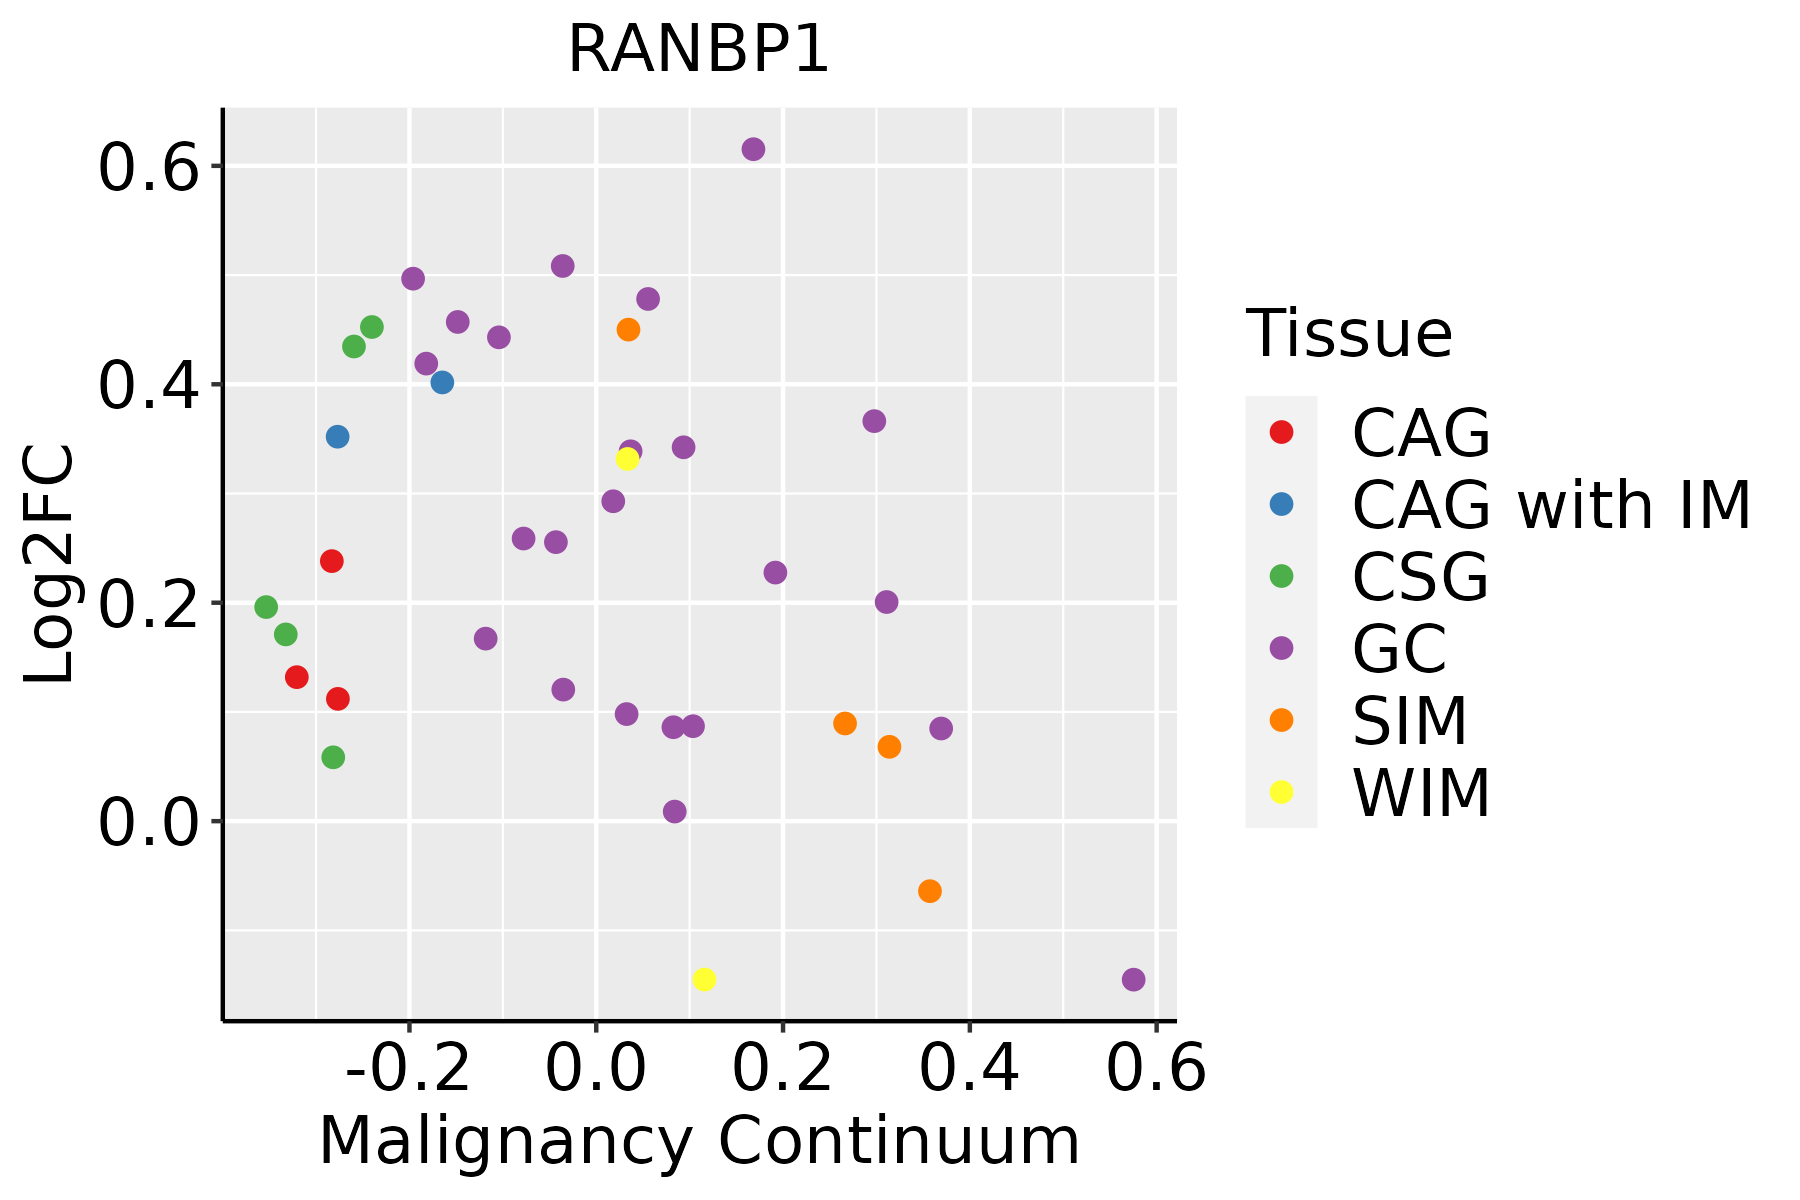 | CAG: Chronic atrophic gastritis |
| CAG with IM: Chronic atrophic gastritis with intestinal metaplasia |
| CSG: Chronic superficial gastritis |
| GC: Gastric cancer |
| SIM: Severe intestinal metaplasia |
| WIM: Wild intestinal metaplasia |
| Liver |  | HCC: Hepatocellular carcinoma |
| NAFLD: Non-alcoholic fatty liver disease |
| Oral Cavity | 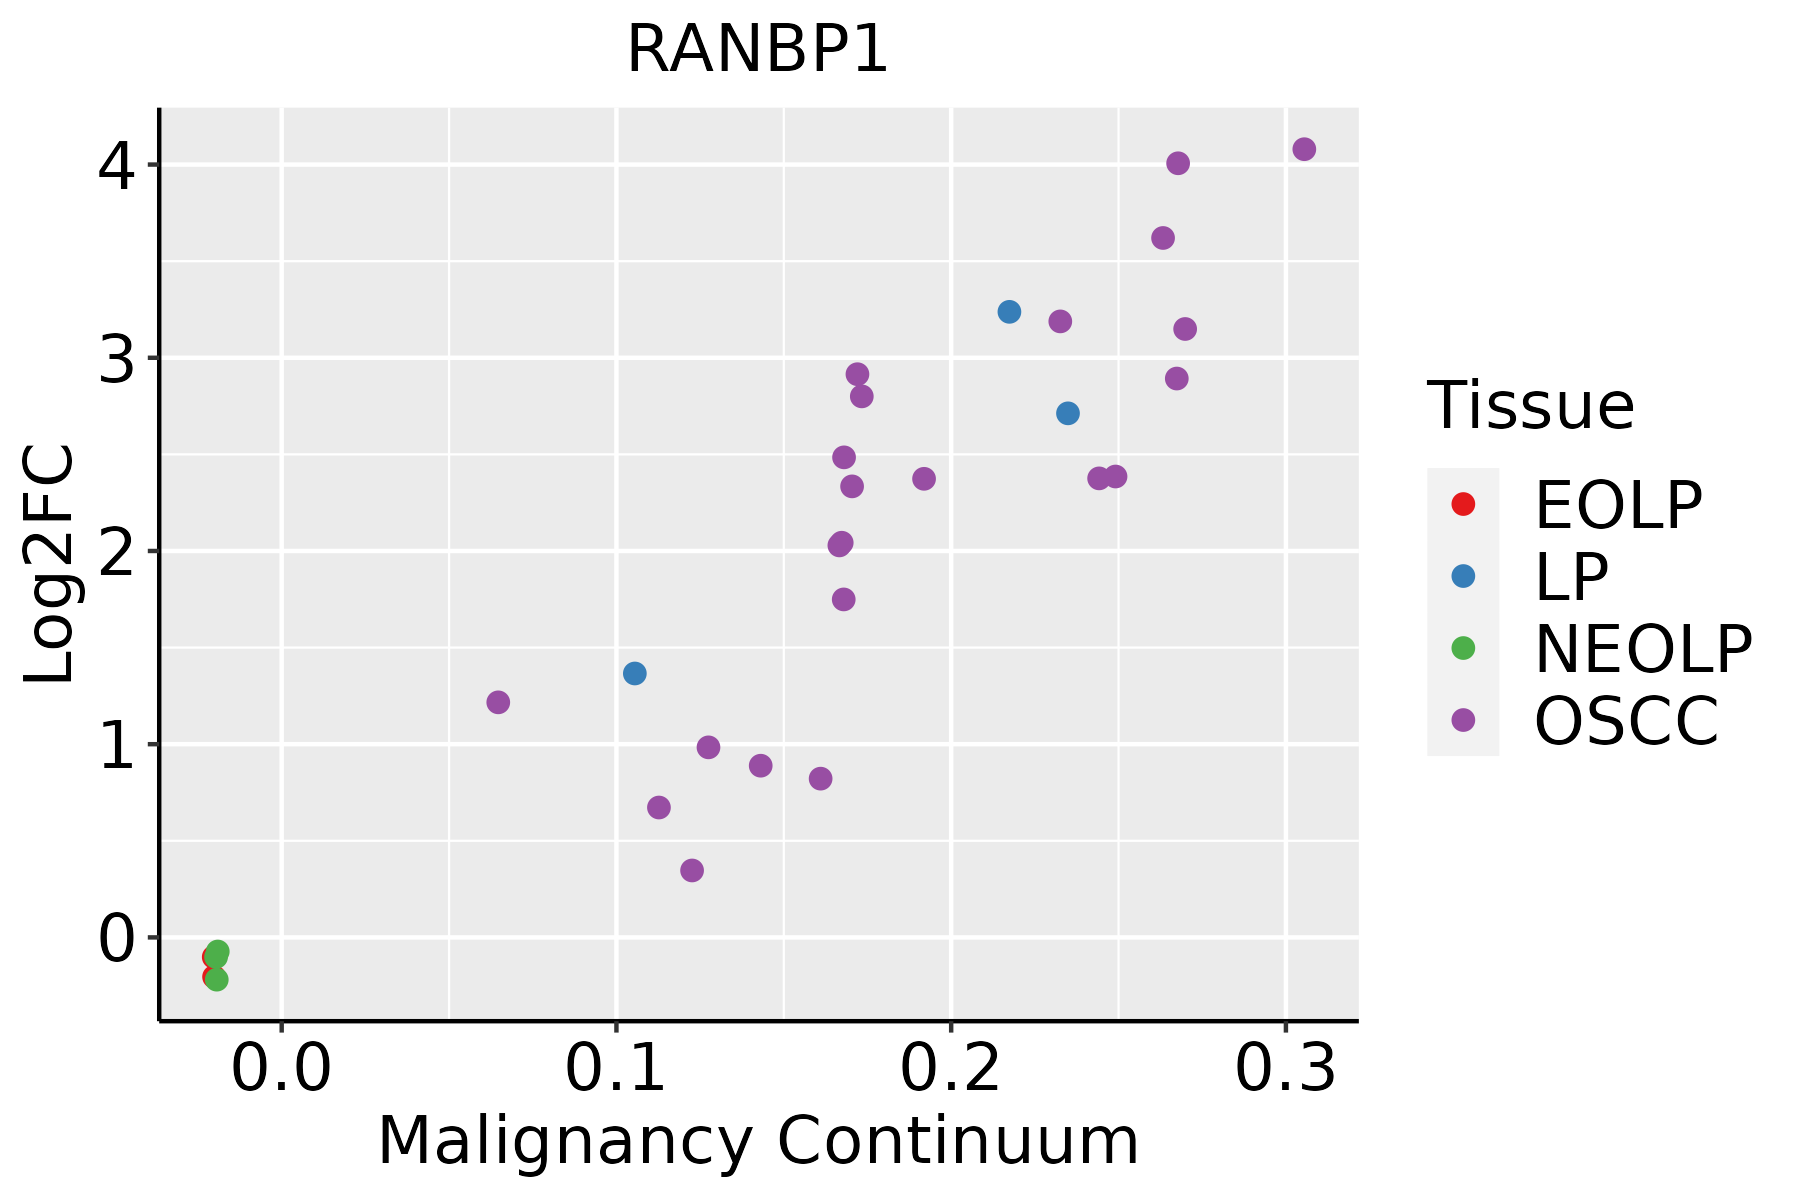 | EOLP: Erosive Oral lichen planus |
| LP: leukoplakia |
| NEOLP: Non-erosive oral lichen planus |
| OSCC: Oral squamous cell carcinoma |
| Prostate | 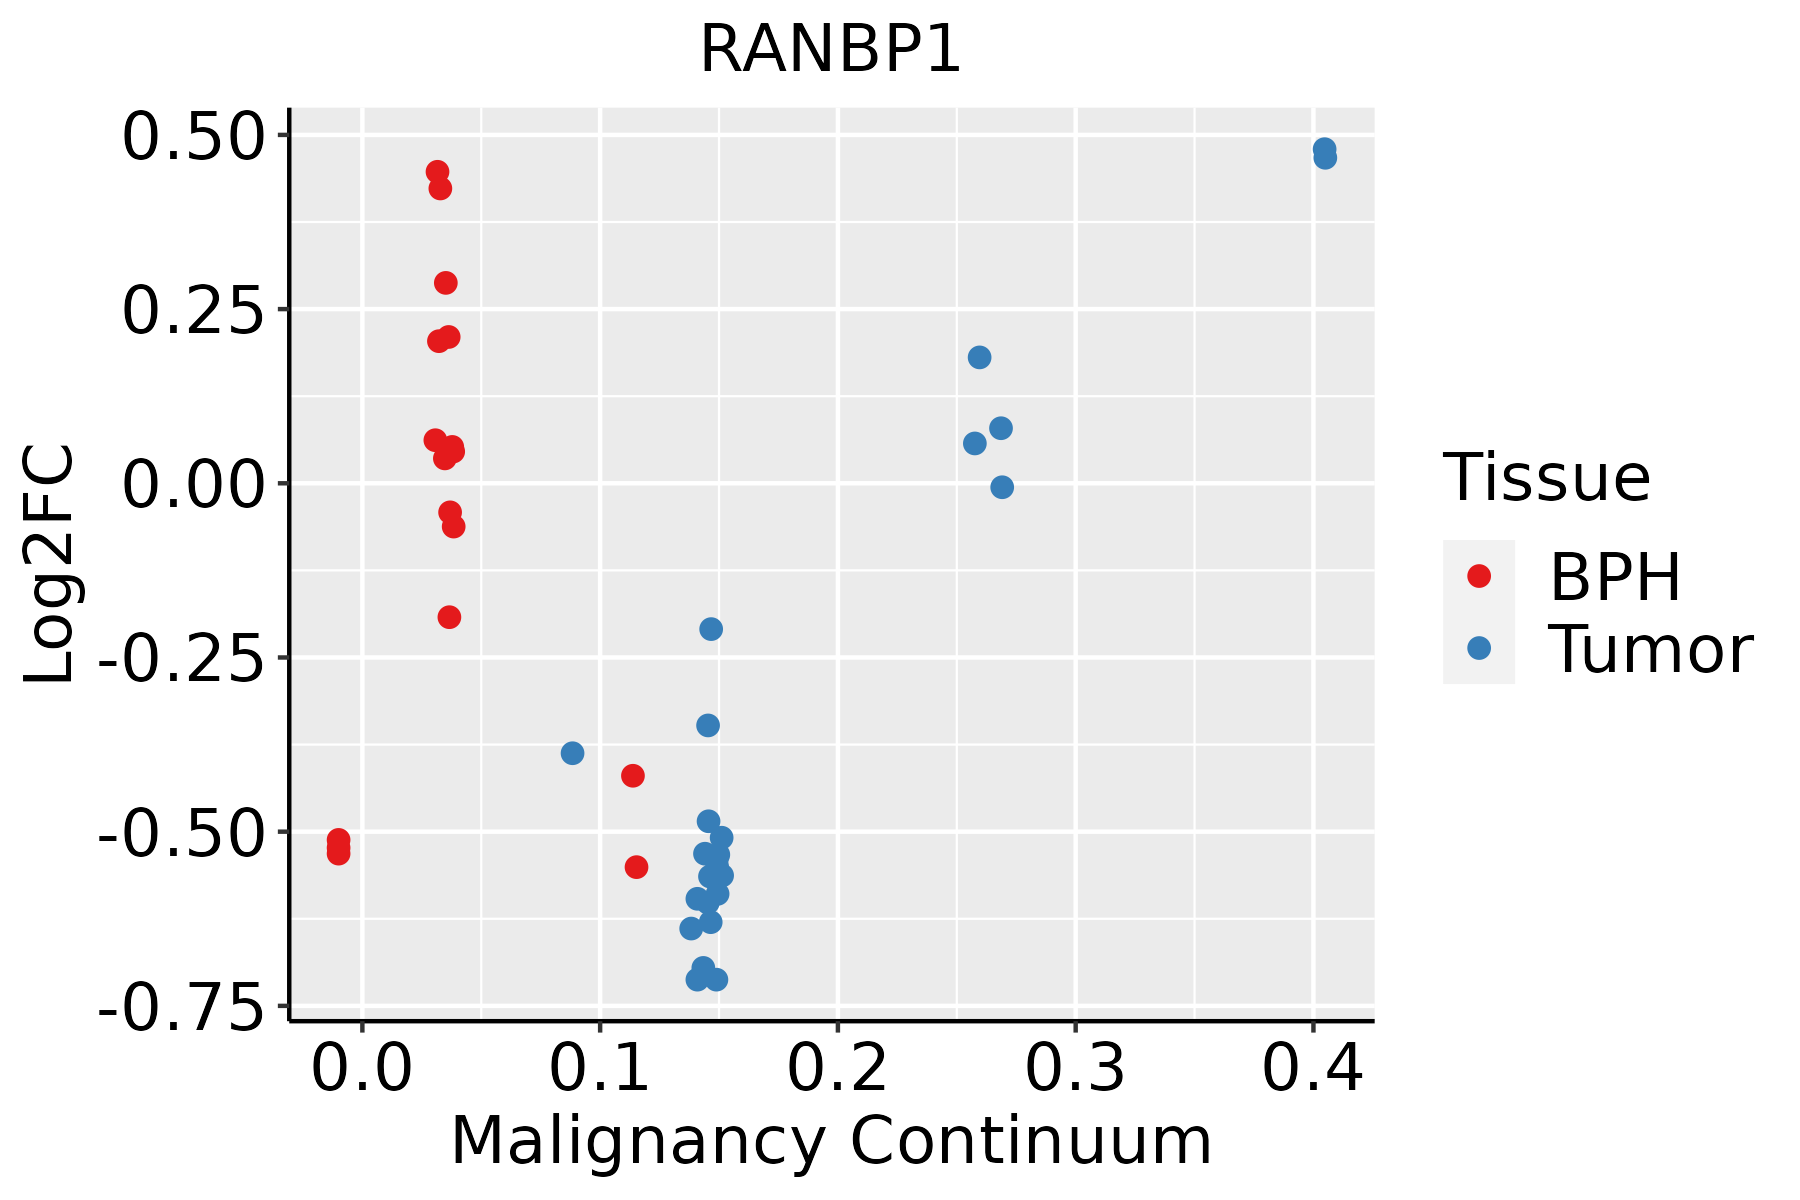 | BPH: Benign Prostatic Hyperplasia |
| Skin | 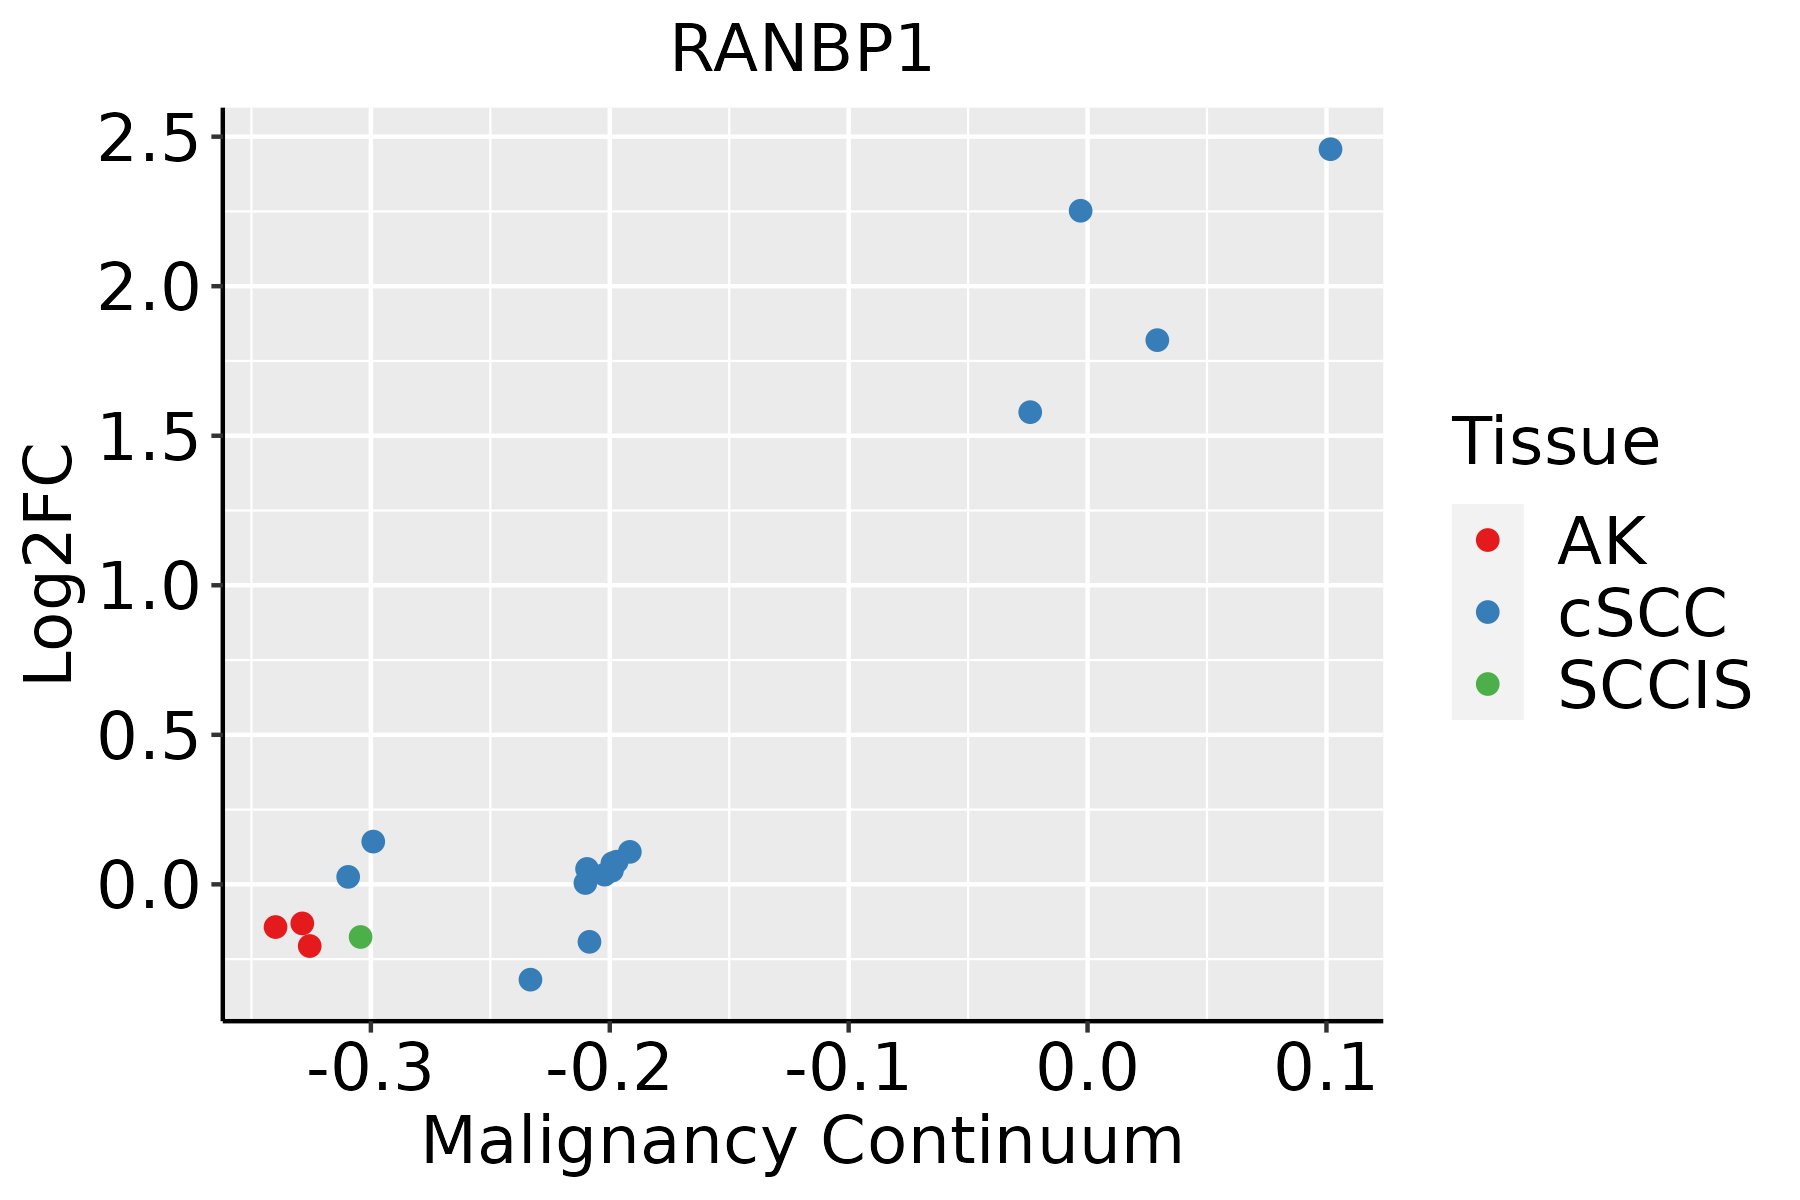 | AK: Actinic keratosis |
| cSCC: Cutaneous squamous cell carcinoma |
| SCCIS:squamous cell carcinoma in situ |
| Thyroid | 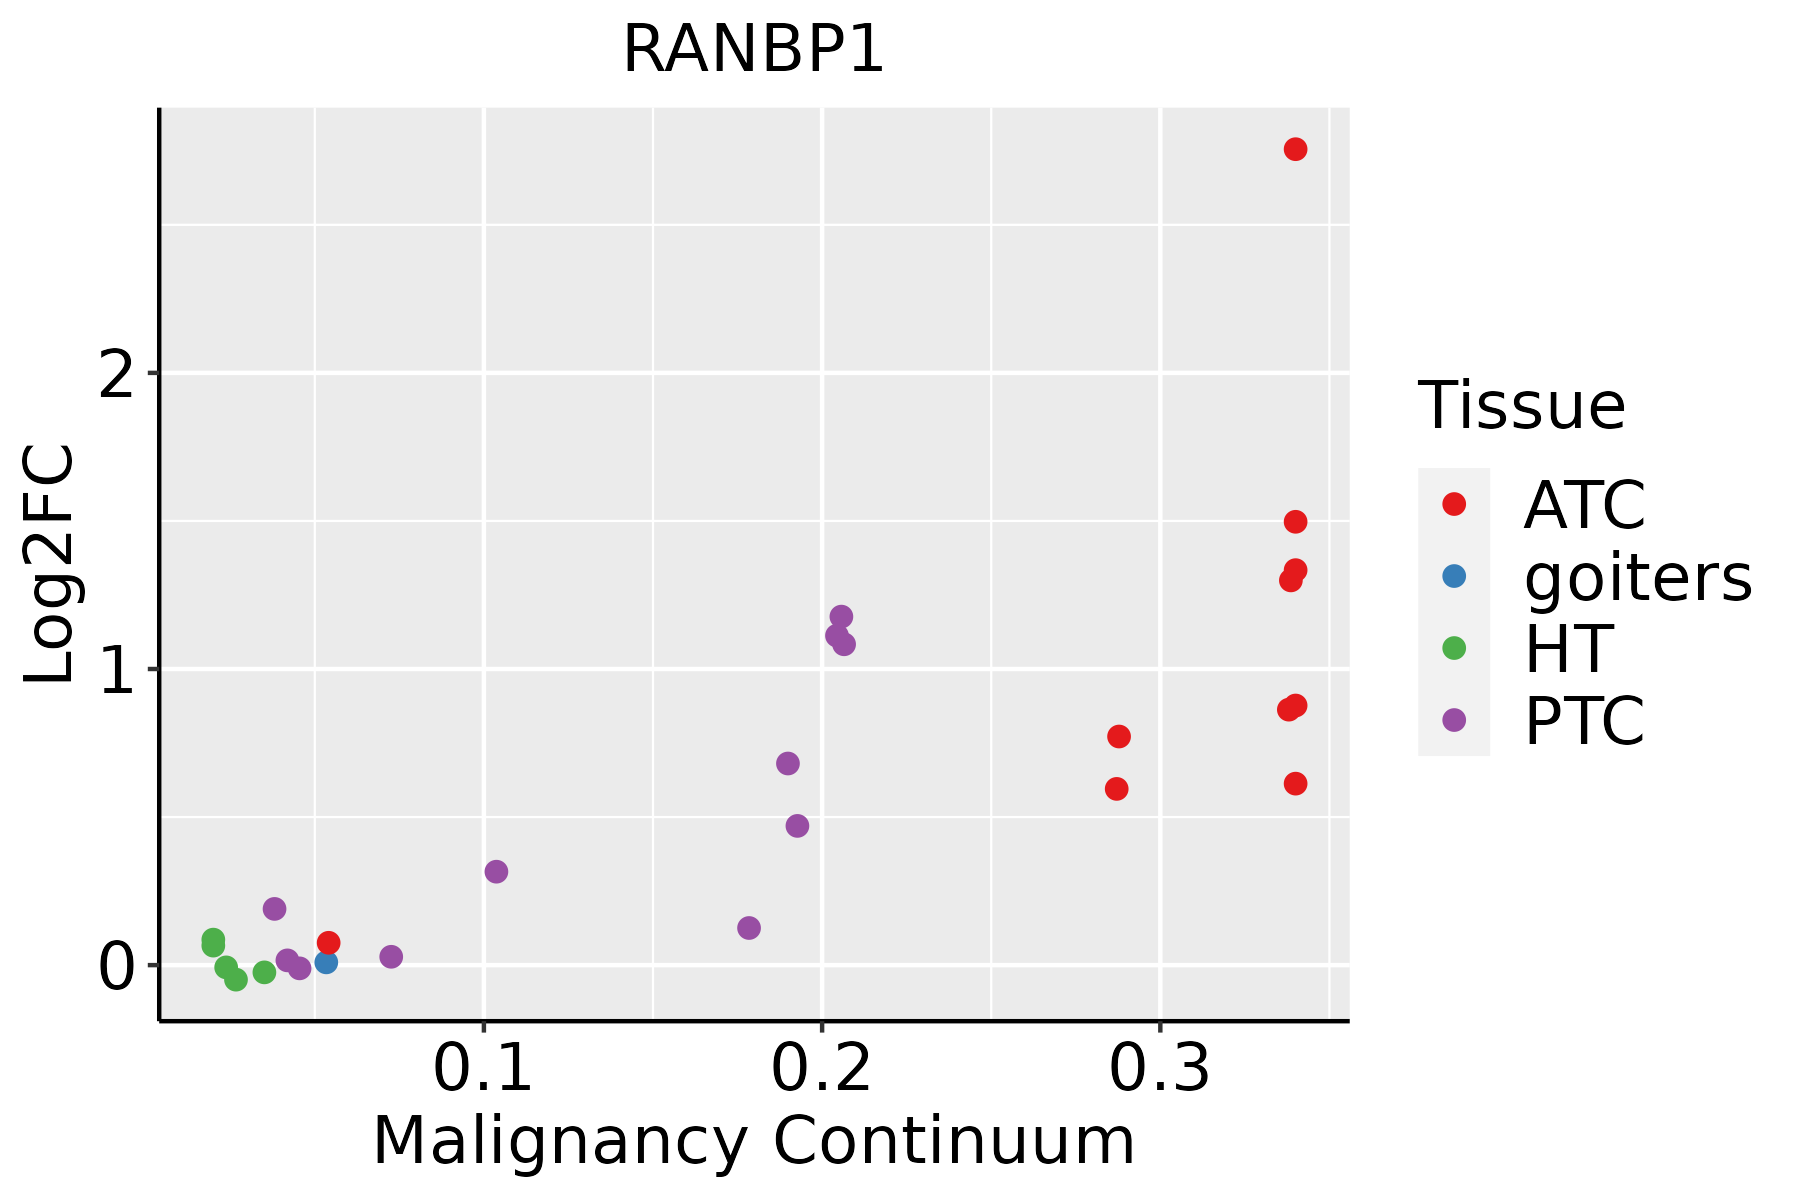 | ATC: Anaplastic thyroid cancer |
| HT: Hashimoto's thyroiditis |
| PTC: Papillary thyroid cancer |
| GO ID | Tissue | Disease Stage | Description | Gene Ratio | Bg Ratio | pvalue | p.adjust | Count |
| GO:00725949 | Cervix | CC | establishment of protein localization to organelle | 99/2311 | 422/18723 | 1.23e-10 | 2.11e-08 | 99 |
| GO:00069139 | Cervix | CC | nucleocytoplasmic transport | 71/2311 | 301/18723 | 4.04e-08 | 2.54e-06 | 71 |
| GO:00511699 | Cervix | CC | nuclear transport | 71/2311 | 301/18723 | 4.04e-08 | 2.54e-06 | 71 |
| GO:00345048 | Cervix | CC | protein localization to nucleus | 68/2311 | 290/18723 | 9.91e-08 | 5.25e-06 | 68 |
| GO:00170388 | Cervix | CC | protein import | 48/2311 | 206/18723 | 8.62e-06 | 1.98e-04 | 48 |
| GO:00511689 | Cervix | CC | nuclear export | 38/2311 | 154/18723 | 1.86e-05 | 3.46e-04 | 38 |
| GO:00511707 | Cervix | CC | import into nucleus | 38/2311 | 159/18723 | 3.98e-05 | 6.18e-04 | 38 |
| GO:00512368 | Cervix | CC | establishment of RNA localization | 39/2311 | 166/18723 | 4.76e-05 | 7.25e-04 | 39 |
| GO:00066067 | Cervix | CC | protein import into nucleus | 37/2311 | 155/18723 | 5.13e-05 | 7.71e-04 | 37 |
| GO:00506578 | Cervix | CC | nucleic acid transport | 38/2311 | 163/18723 | 7.06e-05 | 9.85e-04 | 38 |
| GO:00506588 | Cervix | CC | RNA transport | 38/2311 | 163/18723 | 7.06e-05 | 9.85e-04 | 38 |
| GO:000640310 | Cervix | CC | RNA localization | 43/2311 | 201/18723 | 2.00e-04 | 2.29e-03 | 43 |
| GO:00510284 | Cervix | CC | mRNA transport | 31/2311 | 130/18723 | 2.05e-04 | 2.33e-03 | 31 |
| GO:00066116 | Cervix | CC | protein export from nucleus | 17/2311 | 57/18723 | 3.61e-04 | 3.75e-03 | 17 |
| GO:00159318 | Cervix | CC | nucleobase-containing compound transport | 43/2311 | 222/18723 | 1.72e-03 | 1.30e-02 | 43 |
| GO:007259414 | Cervix | HSIL_HPV | establishment of protein localization to organelle | 29/737 | 422/18723 | 2.71e-03 | 2.58e-02 | 29 |
| GO:003450412 | Cervix | HSIL_HPV | protein localization to nucleus | 21/737 | 290/18723 | 5.53e-03 | 4.45e-02 | 21 |
| GO:0072594 | Colorectum | AD | establishment of protein localization to organelle | 148/3918 | 422/18723 | 7.95e-12 | 1.04e-09 | 148 |
| GO:0006913 | Colorectum | AD | nucleocytoplasmic transport | 102/3918 | 301/18723 | 1.00e-07 | 4.85e-06 | 102 |
| GO:0051169 | Colorectum | AD | nuclear transport | 102/3918 | 301/18723 | 1.00e-07 | 4.85e-06 | 102 |
| Pathway ID | Tissue | Disease Stage | Description | Gene Ratio | Bg Ratio | pvalue | p.adjust | qvalue | Count |
| hsa0516618 | Breast | Precancer | Human T-cell leukemia virus 1 infection | 33/684 | 222/8465 | 4.29e-04 | 3.31e-03 | 2.53e-03 | 33 |
| hsa052036 | Breast | Precancer | Viral carcinogenesis | 27/684 | 204/8465 | 7.19e-03 | 4.06e-02 | 3.11e-02 | 27 |
| hsa0516619 | Breast | Precancer | Human T-cell leukemia virus 1 infection | 33/684 | 222/8465 | 4.29e-04 | 3.31e-03 | 2.53e-03 | 33 |
| hsa0520312 | Breast | Precancer | Viral carcinogenesis | 27/684 | 204/8465 | 7.19e-03 | 4.06e-02 | 3.11e-02 | 27 |
| hsa0516624 | Breast | IDC | Human T-cell leukemia virus 1 infection | 40/867 | 222/8465 | 2.52e-04 | 2.21e-03 | 1.66e-03 | 40 |
| hsa0520322 | Breast | IDC | Viral carcinogenesis | 34/867 | 204/8465 | 2.82e-03 | 1.86e-02 | 1.39e-02 | 34 |
| hsa0516634 | Breast | IDC | Human T-cell leukemia virus 1 infection | 40/867 | 222/8465 | 2.52e-04 | 2.21e-03 | 1.66e-03 | 40 |
| hsa0520332 | Breast | IDC | Viral carcinogenesis | 34/867 | 204/8465 | 2.82e-03 | 1.86e-02 | 1.39e-02 | 34 |
| hsa0516642 | Breast | DCIS | Human T-cell leukemia virus 1 infection | 41/846 | 222/8465 | 7.03e-05 | 6.88e-04 | 5.07e-04 | 41 |
| hsa0520341 | Breast | DCIS | Viral carcinogenesis | 34/846 | 204/8465 | 1.88e-03 | 1.27e-02 | 9.33e-03 | 34 |
| hsa0516652 | Breast | DCIS | Human T-cell leukemia virus 1 infection | 41/846 | 222/8465 | 7.03e-05 | 6.88e-04 | 5.07e-04 | 41 |
| hsa052035 | Breast | DCIS | Viral carcinogenesis | 34/846 | 204/8465 | 1.88e-03 | 1.27e-02 | 9.33e-03 | 34 |
| hsa05166 | Colorectum | AD | Human T-cell leukemia virus 1 infection | 72/2092 | 222/8465 | 5.24e-03 | 2.44e-02 | 1.55e-02 | 72 |
| hsa051661 | Colorectum | AD | Human T-cell leukemia virus 1 infection | 72/2092 | 222/8465 | 5.24e-03 | 2.44e-02 | 1.55e-02 | 72 |
| hsa051662 | Colorectum | MSS | Human T-cell leukemia virus 1 infection | 68/1875 | 222/8465 | 1.84e-03 | 9.61e-03 | 5.89e-03 | 68 |
| hsa051663 | Colorectum | MSS | Human T-cell leukemia virus 1 infection | 68/1875 | 222/8465 | 1.84e-03 | 9.61e-03 | 5.89e-03 | 68 |
| hsa0516626 | Endometrium | AEH | Human T-cell leukemia virus 1 infection | 50/1197 | 222/8465 | 4.30e-04 | 3.11e-03 | 2.27e-03 | 50 |
| hsa05166111 | Endometrium | AEH | Human T-cell leukemia virus 1 infection | 50/1197 | 222/8465 | 4.30e-04 | 3.11e-03 | 2.27e-03 | 50 |
| hsa0516627 | Endometrium | EEC | Human T-cell leukemia virus 1 infection | 52/1237 | 222/8465 | 2.73e-04 | 2.36e-03 | 1.76e-03 | 52 |
| hsa0516636 | Endometrium | EEC | Human T-cell leukemia virus 1 infection | 52/1237 | 222/8465 | 2.73e-04 | 2.36e-03 | 1.76e-03 | 52 |
| Hugo Symbol | Variant Class | Variant Classification | dbSNP RS | HGVSc | HGVSp | HGVSp Short | SWISSPROT | BIOTYPE | SIFT | PolyPhen | Tumor Sample Barcode | Tissue | Histology | Sex | Age | Stage | Therapy Types | Drugs | Outcome |
| RANBP1 | SNV | Missense_Mutation | novel | c.708N>T | p.Arg236Ser | p.R236S | | protein_coding | deleterious(0) | possibly_damaging(0.565) | TCGA-AZ-4315-01 | Colorectum | colon adenocarcinoma | Male | <65 | I/II | Unknown | Unknown | SD |
| RANBP1 | SNV | Missense_Mutation | rs771917916 | c.571N>A | p.Ala191Thr | p.A191T | | protein_coding | tolerated(0.1) | possibly_damaging(0.85) | TCGA-F4-6856-01 | Colorectum | colon adenocarcinoma | Male | <65 | I/II | Ancillary | leucovorin | CR |
| RANBP1 | SNV | Missense_Mutation | novel | c.237N>T | p.Lys79Asn | p.K79N | | protein_coding | tolerated_low_confidence(0.2) | benign(0.007) | TCGA-AX-A2HC-01 | Endometrium | uterine corpus endometrioid carcinoma | Female | <65 | III/IV | Chemotherapy | paclitaxel | PD |
| RANBP1 | SNV | Missense_Mutation | novel | c.467N>G | p.Lys156Arg | p.K156R | | protein_coding | tolerated(0.49) | benign(0.031) | TCGA-B5-A0K7-01 | Endometrium | uterine corpus endometrioid carcinoma | Female | <65 | I/II | Unknown | Unknown | PD |
| RANBP1 | SNV | Missense_Mutation | | c.279N>T | p.Glu93Asp | p.E93D | | protein_coding | tolerated(0.1) | benign(0.164) | TCGA-BS-A0UF-01 | Endometrium | uterine corpus endometrioid carcinoma | Female | >=65 | I/II | Unknown | Unknown | SD |
| RANBP1 | SNV | Missense_Mutation | novel | c.490N>T | p.Arg164Cys | p.R164C | | protein_coding | deleterious(0) | probably_damaging(1) | TCGA-E6-A2P9-01 | Endometrium | uterine corpus endometrioid carcinoma | Female | >=65 | I/II | Unknown | Unknown | SD |
| RANBP1 | SNV | Missense_Mutation | | c.305N>G | p.Pro102Arg | p.P102R | | protein_coding | deleterious(0) | probably_damaging(0.993) | TCGA-EY-A212-01 | Endometrium | uterine corpus endometrioid carcinoma | Female | >=65 | III/IV | Unknown | Unknown | PD |
| RANBP1 | SNV | Missense_Mutation | rs756772977 | c.764N>G | p.Glu255Gly | p.E255G | | protein_coding | deleterious(0.01) | benign(0.356) | TCGA-EY-A5W2-01 | Endometrium | uterine corpus endometrioid carcinoma | Female | >=65 | I/II | Unknown | Unknown | SD |
| RANBP1 | SNV | Missense_Mutation | novel | c.385N>T | p.Arg129Trp | p.R129W | | protein_coding | deleterious(0) | probably_damaging(0.999) | TCGA-FI-A2D5-01 | Endometrium | uterine corpus endometrioid carcinoma | Female | <65 | III/IV | Chemotherapy | carboplatinum | PD |
| RANBP1 | insertion | Frame_Shift_Ins | novel | c.469_470insTGCAGGTCTGCACTCTT | p.His157LeufsTer23 | p.H157Lfs*23 | | protein_coding | | | TCGA-B5-A0K7-01 | Endometrium | uterine corpus endometrioid carcinoma | Female | <65 | I/II | Unknown | Unknown | PD |


