
|
|||||
|
 | |
| |
| |
| |
| |
| |
|
Gene: RAMP1 |
Gene summary for RAMP1 |
| Gene information | Species | Human | Gene symbol | RAMP1 | Gene ID | 10267 |
| Gene name | receptor activity modifying protein 1 | |
| Gene Alias | RAMP1 | |
| Cytomap | 2q37.3 | |
| Gene Type | protein-coding | GO ID | GO:0001525 | UniProtAcc | E9PC20 |
Top |
Malignant transformation analysis |
| Identification of the aberrant gene expression in precancerous and cancerous lesions by comparing the gene expression of stem-like cells in diseased tissues with normal stem cells |
| Entrez ID | Symbol | Replicates | Species | Organ | Tissue | Adj P-value | Log2FC | Malignancy |
| 10267 | RAMP1 | GSM4909297 | Human | Breast | IDC | 4.89e-02 | 1.71e-01 | 0.1517 |
| 10267 | RAMP1 | GSM4909301 | Human | Breast | IDC | 1.62e-53 | 1.03e+00 | 0.1577 |
| 10267 | RAMP1 | GSM4909304 | Human | Breast | IDC | 1.06e-04 | 2.02e-01 | 0.1636 |
| 10267 | RAMP1 | GSM4909306 | Human | Breast | IDC | 6.94e-44 | 7.92e-01 | 0.1564 |
| 10267 | RAMP1 | GSM4909317 | Human | Breast | IDC | 1.98e-23 | 5.76e-01 | 0.1355 |
| 10267 | RAMP1 | GSM4909318 | Human | Breast | IDC | 8.41e-05 | 5.14e-01 | 0.2031 |
| 10267 | RAMP1 | GSM4909319 | Human | Breast | IDC | 1.05e-05 | 4.07e-01 | 0.1563 |
| 10267 | RAMP1 | M1 | Human | Breast | IDC | 7.84e-06 | 2.26e-01 | 0.1577 |
| 10267 | RAMP1 | AEH-subject1 | Human | Endometrium | AEH | 2.48e-43 | -9.42e-01 | -0.3059 |
| 10267 | RAMP1 | AEH-subject2 | Human | Endometrium | AEH | 8.82e-29 | -8.48e-01 | -0.2525 |
| 10267 | RAMP1 | AEH-subject3 | Human | Endometrium | AEH | 3.40e-30 | -8.18e-01 | -0.2576 |
| 10267 | RAMP1 | AEH-subject4 | Human | Endometrium | AEH | 7.32e-10 | -5.93e-01 | -0.2657 |
| 10267 | RAMP1 | AEH-subject5 | Human | Endometrium | AEH | 8.74e-50 | -1.01e+00 | -0.2953 |
| 10267 | RAMP1 | EEC-subject1 | Human | Endometrium | EEC | 3.46e-57 | -1.05e+00 | -0.2682 |
| 10267 | RAMP1 | EEC-subject2 | Human | Endometrium | EEC | 8.34e-45 | -1.00e+00 | -0.2607 |
| 10267 | RAMP1 | EEC-subject3 | Human | Endometrium | EEC | 5.99e-51 | -9.63e-01 | -0.2525 |
| 10267 | RAMP1 | EEC-subject4 | Human | Endometrium | EEC | 7.83e-35 | -8.32e-01 | -0.2571 |
| 10267 | RAMP1 | EEC-subject5 | Human | Endometrium | EEC | 6.55e-56 | -1.05e+00 | -0.249 |
| 10267 | RAMP1 | GSM5276935 | Human | Endometrium | EEC | 3.03e-49 | -9.89e-01 | -0.123 |
| 10267 | RAMP1 | GSM6177620_NYU_UCEC1_lib1_lib1 | Human | Endometrium | EEC | 4.24e-51 | -1.10e+00 | -0.1869 |
| Page: 1 2 3 4 5 6 |
| Tissue | Expression Dynamics | Abbreviation |
| Breast |  | IDC: Invasive ductal carcinoma |
| DCIS: Ductal carcinoma in situ | ||
| Precancer(BRCA1-mut): Precancerous lesion from BRCA1 mutation carriers | ||
| Endometrium | 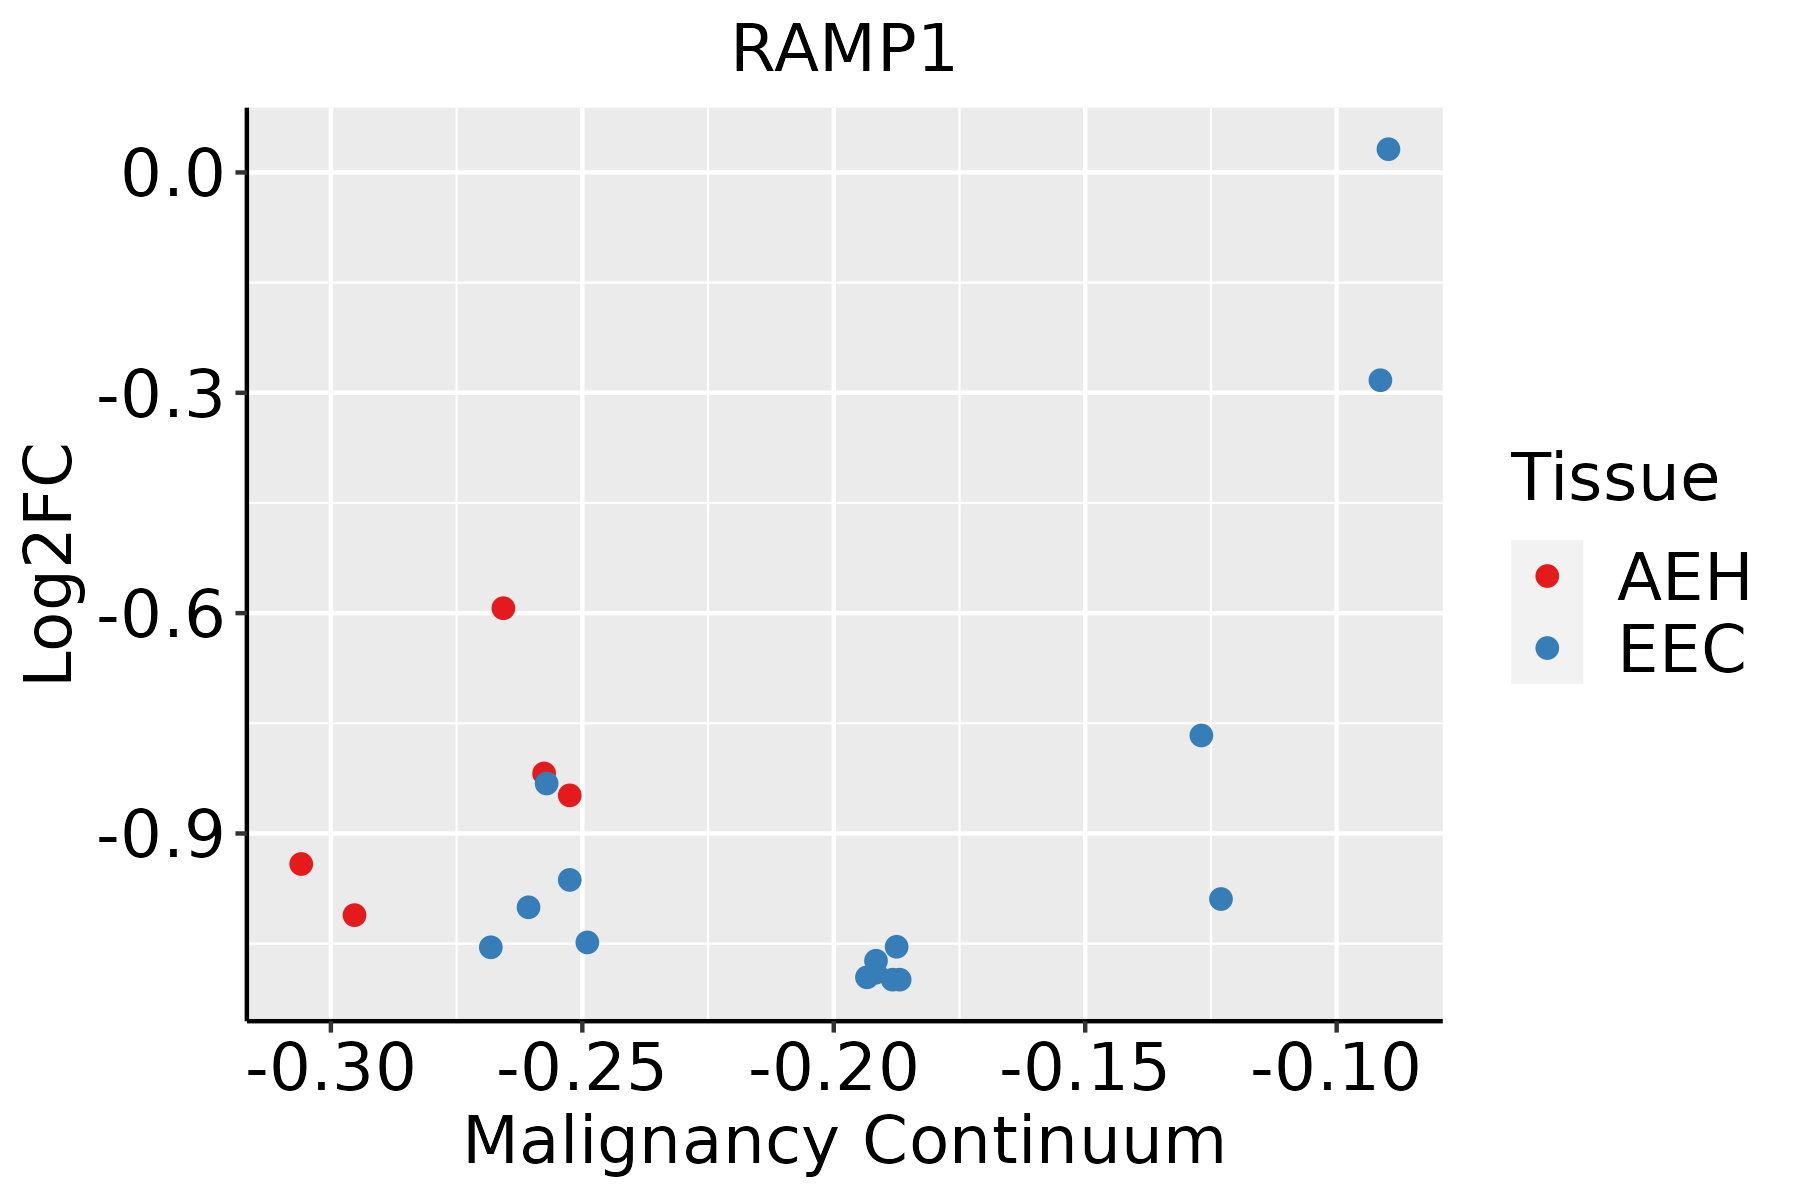 | AEH: Atypical endometrial hyperplasia |
| EEC: Endometrioid Cancer | ||
| Esophagus | 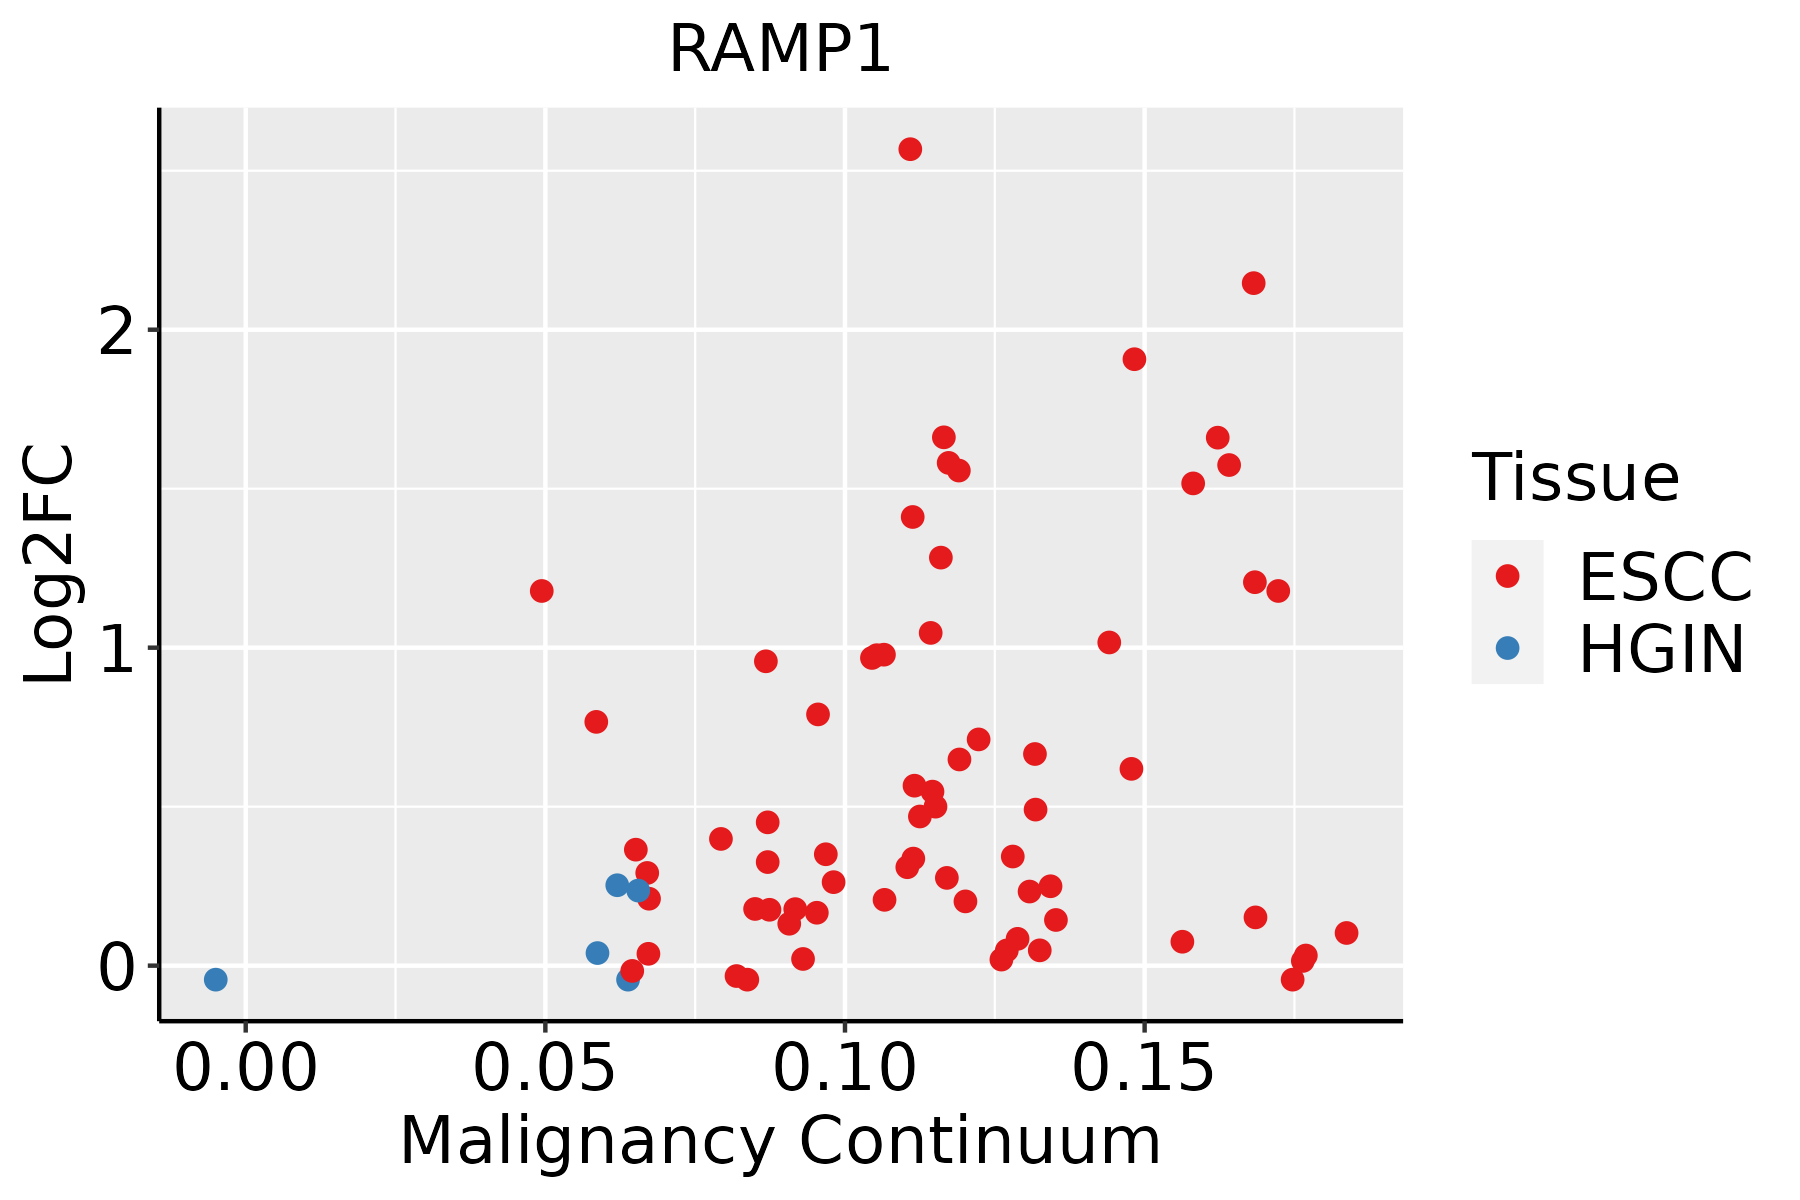 | ESCC: Esophageal squamous cell carcinoma |
| HGIN: High-grade intraepithelial neoplasias | ||
| LGIN: Low-grade intraepithelial neoplasias | ||
| Liver | 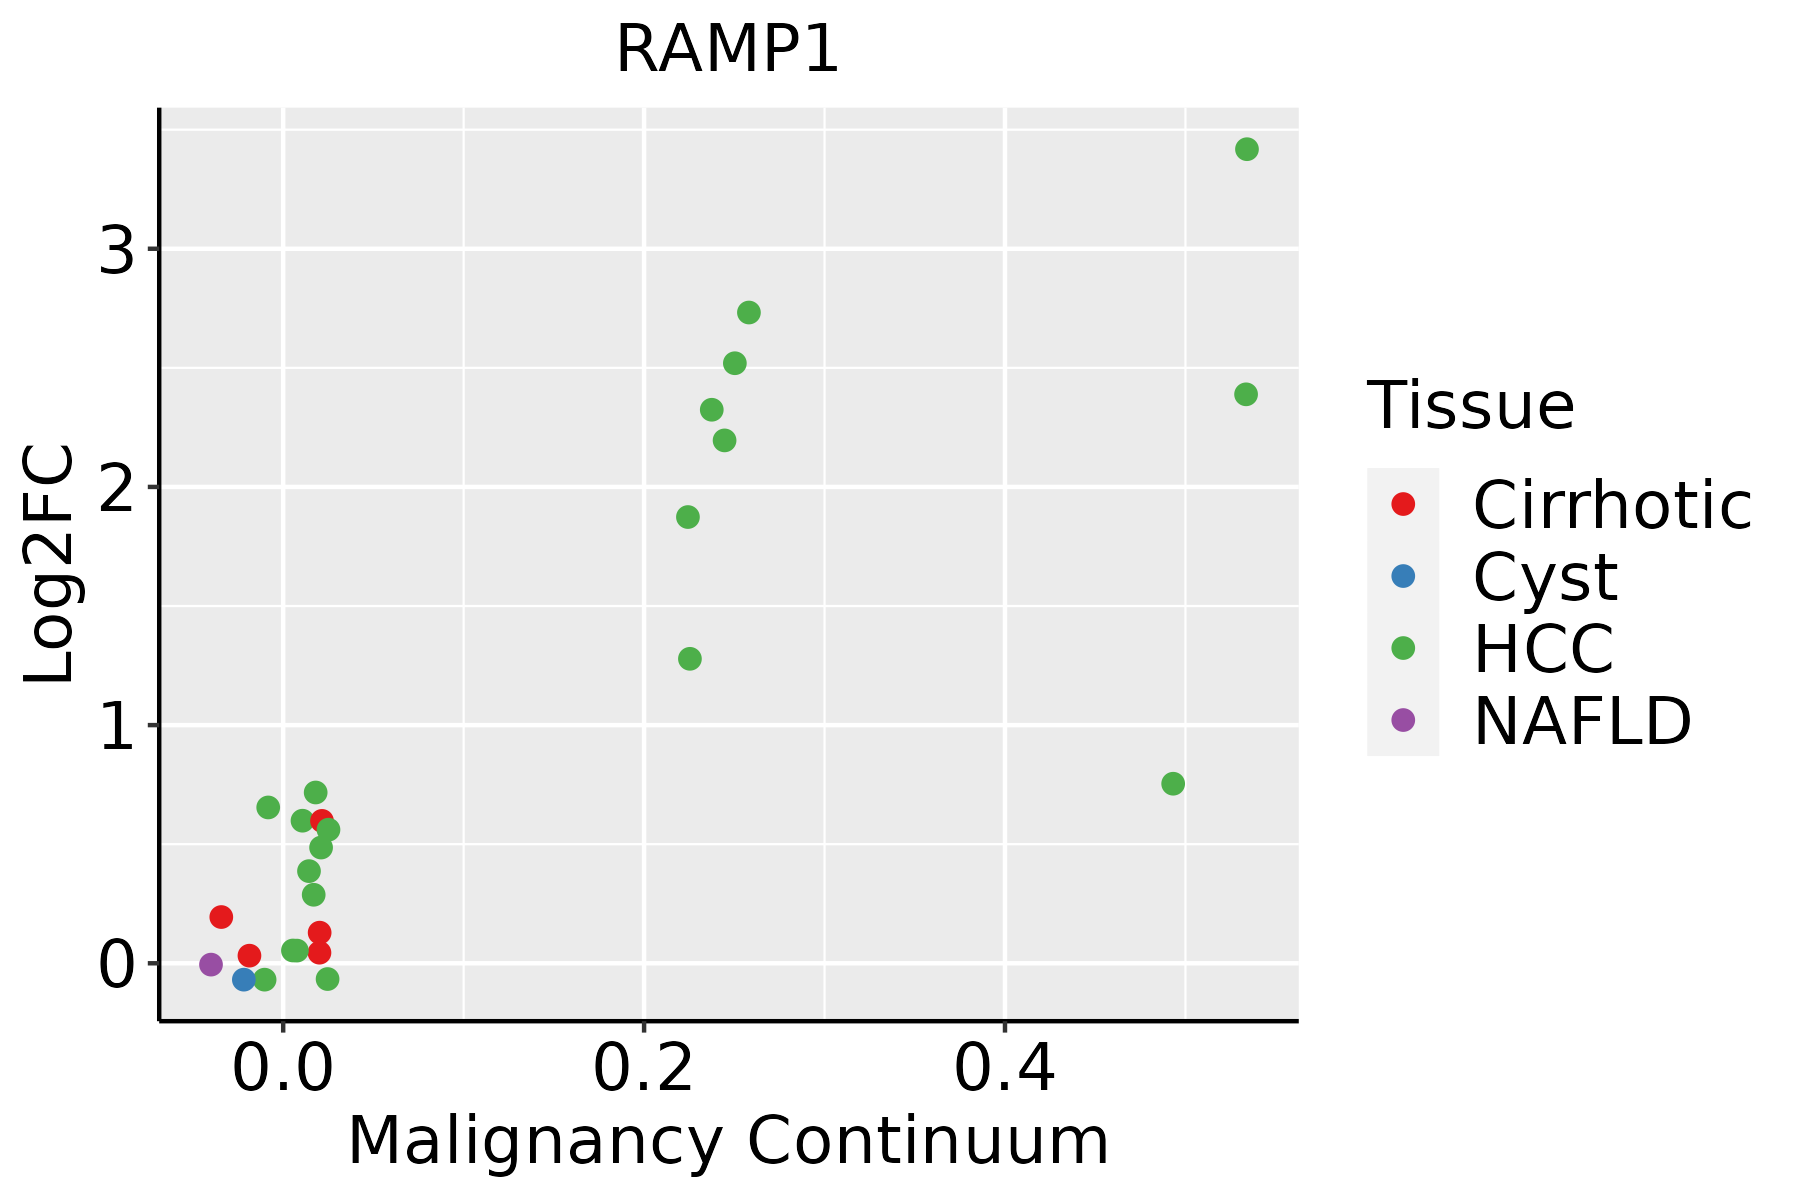 | HCC: Hepatocellular carcinoma |
| NAFLD: Non-alcoholic fatty liver disease | ||
| Oral Cavity | 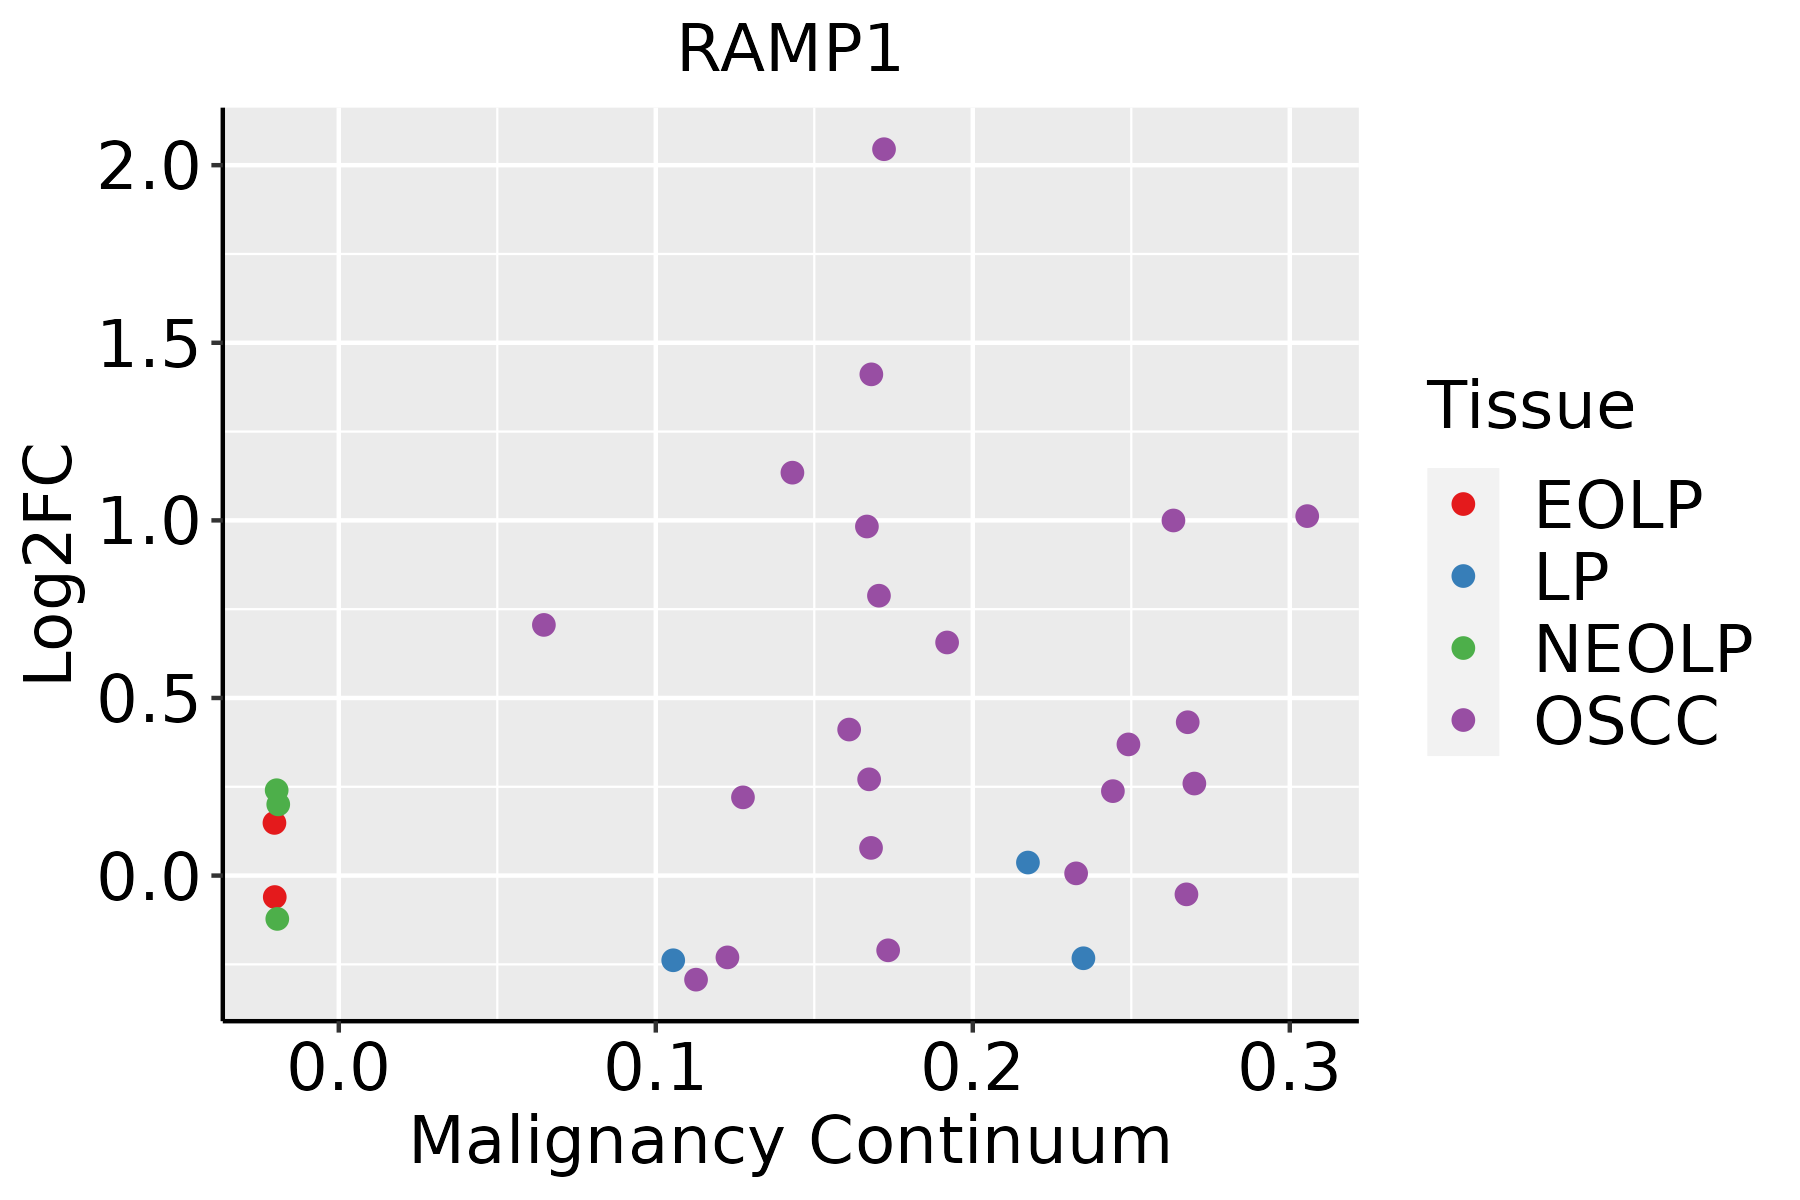 | EOLP: Erosive Oral lichen planus |
| LP: leukoplakia | ||
| NEOLP: Non-erosive oral lichen planus | ||
| OSCC: Oral squamous cell carcinoma | ||
| Prostate | 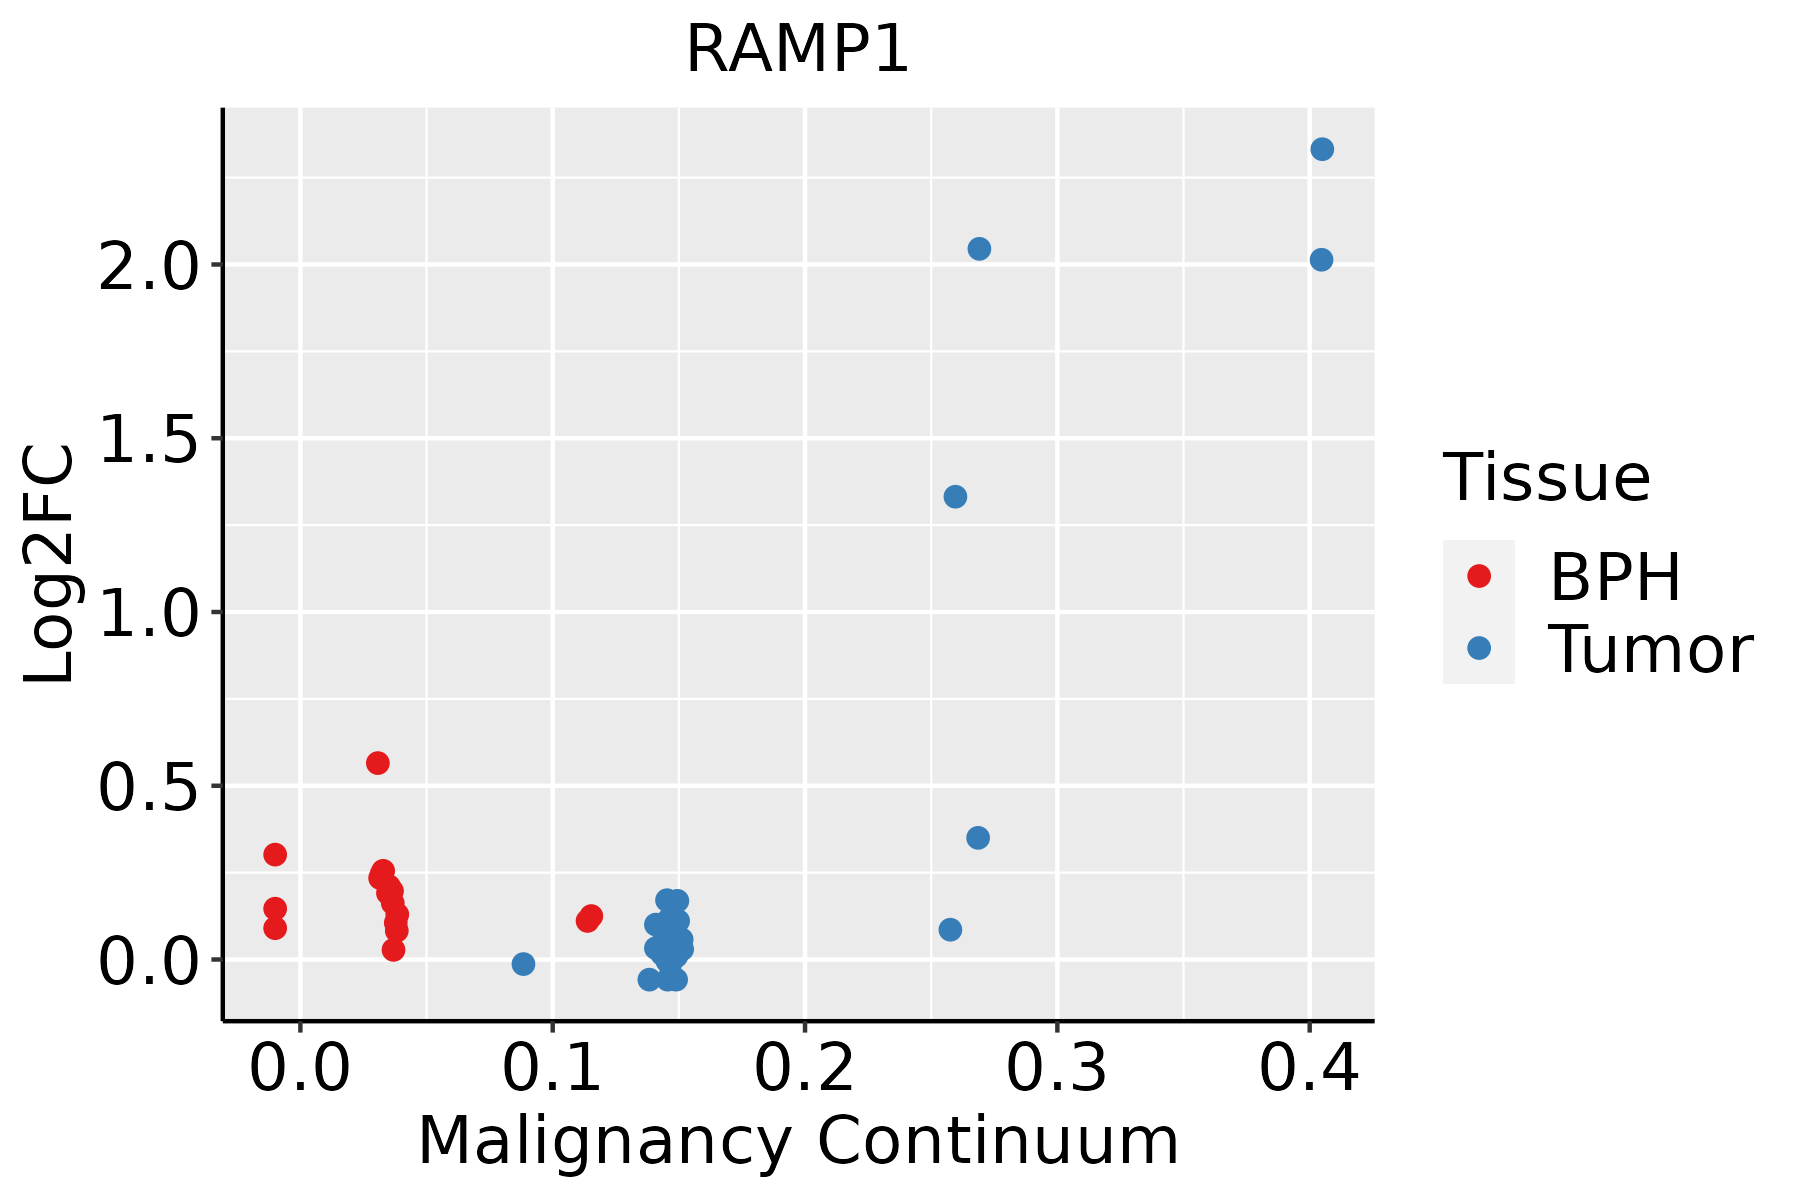 | BPH: Benign Prostatic Hyperplasia |
| Thyroid | 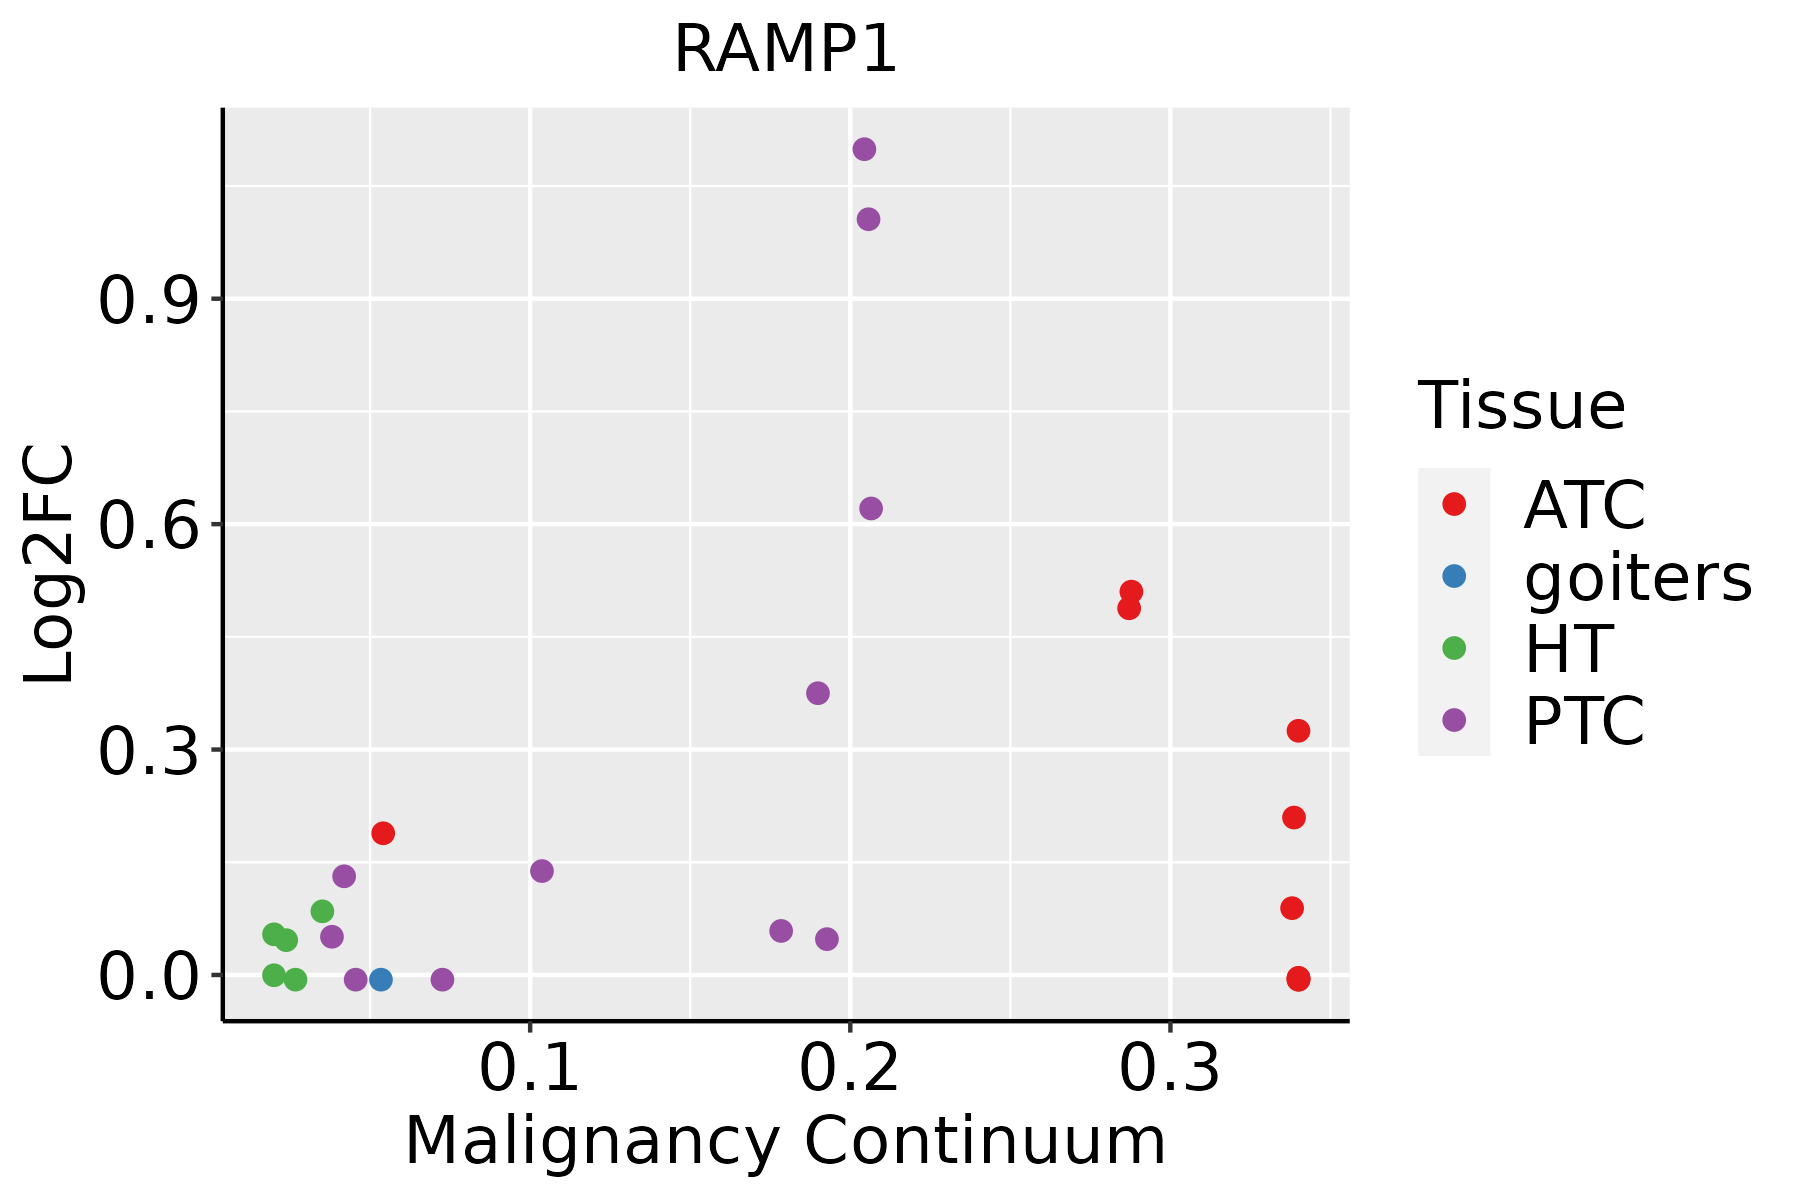 | ATC: Anaplastic thyroid cancer |
| HT: Hashimoto's thyroiditis | ||
| PTC: Papillary thyroid cancer |
| ∗log2FC in expression of this searched gene in stem-like cells from each diseased tissue sample relative to stem-like cells in normal samples in each tissue plotted against the malignancy continuum. Samples are colored based on if they are from different disease stage. |
Top |
Malignant transformation related pathway analysis |
| Find out the enriched GO biological processes and KEGG pathways involved in transition from healthy to precancer to cancer |
| Tissue | Disease Stage | Enriched GO biological Processes |
| Colorectum | AD |  |
| Colorectum | SER |  |
| Colorectum | MSS |  |
| Colorectum | MSI-H |  |
| Colorectum | FAP |  |
| ∗Top 15 enriched GO BP terms are showed in the bar plot of each disease state in each tissue. Each row represents a significant GO biological process which is colored according to the -log10(p.adjust). |
| Page: 1 2 3 4 5 6 7 8 9 |
| GO ID | Tissue | Disease Stage | Description | Gene Ratio | Bg Ratio | pvalue | p.adjust | Count |
| GO:005109814 | Breast | IDC | regulation of binding | 57/1434 | 363/18723 | 1.59e-07 | 8.76e-06 | 57 |
| GO:005109914 | Breast | IDC | positive regulation of binding | 30/1434 | 173/18723 | 1.96e-05 | 4.86e-04 | 30 |
| GO:000689813 | Breast | IDC | receptor-mediated endocytosis | 35/1434 | 244/18723 | 2.38e-04 | 3.75e-03 | 35 |
| GO:003162311 | Breast | IDC | receptor internalization | 19/1434 | 113/18723 | 9.17e-04 | 1.05e-02 | 19 |
| GO:00431126 | Breast | IDC | receptor metabolic process | 23/1434 | 166/18723 | 4.04e-03 | 3.25e-02 | 23 |
| GO:00726599 | Breast | IDC | protein localization to plasma membrane | 34/1434 | 284/18723 | 6.33e-03 | 4.47e-02 | 34 |
| GO:005109816 | Endometrium | AEH | regulation of binding | 77/2100 | 363/18723 | 2.21e-08 | 1.31e-06 | 77 |
| GO:007265914 | Endometrium | AEH | protein localization to plasma membrane | 63/2100 | 284/18723 | 7.58e-08 | 3.92e-06 | 63 |
| GO:19907789 | Endometrium | AEH | protein localization to cell periphery | 68/2100 | 333/18723 | 6.38e-07 | 2.38e-05 | 68 |
| GO:005109916 | Endometrium | AEH | positive regulation of binding | 41/2100 | 173/18723 | 2.39e-06 | 6.92e-05 | 41 |
| GO:004339310 | Endometrium | AEH | regulation of protein binding | 42/2100 | 196/18723 | 2.58e-05 | 4.86e-04 | 42 |
| GO:00068988 | Endometrium | AEH | receptor-mediated endocytosis | 49/2100 | 244/18723 | 3.54e-05 | 6.24e-04 | 49 |
| GO:00320928 | Endometrium | AEH | positive regulation of protein binding | 22/2100 | 85/18723 | 1.27e-04 | 1.74e-03 | 22 |
| GO:00431128 | Endometrium | AEH | receptor metabolic process | 35/2100 | 166/18723 | 1.64e-04 | 2.15e-03 | 35 |
| GO:00316237 | Endometrium | AEH | receptor internalization | 26/2100 | 113/18723 | 2.62e-04 | 3.08e-03 | 26 |
| GO:005109817 | Endometrium | EEC | regulation of binding | 83/2168 | 363/18723 | 6.72e-10 | 6.61e-08 | 83 |
| GO:007265915 | Endometrium | EEC | protein localization to plasma membrane | 64/2168 | 284/18723 | 1.05e-07 | 5.05e-06 | 64 |
| GO:005109917 | Endometrium | EEC | positive regulation of binding | 44/2168 | 173/18723 | 3.08e-07 | 1.27e-05 | 44 |
| GO:199077814 | Endometrium | EEC | protein localization to cell periphery | 69/2168 | 333/18723 | 9.71e-07 | 3.31e-05 | 69 |
| GO:004339315 | Endometrium | EEC | regulation of protein binding | 46/2168 | 196/18723 | 1.94e-06 | 5.80e-05 | 46 |
| Page: 1 2 3 4 5 6 7 |
| Pathway ID | Tissue | Disease Stage | Description | Gene Ratio | Bg Ratio | pvalue | p.adjust | qvalue | Count |
| hsa042704 | Oral cavity | NEOLP | Vascular smooth muscle contraction | 30/1112 | 134/8465 | 2.06e-03 | 8.97e-03 | 5.64e-03 | 30 |
| hsa0427011 | Oral cavity | NEOLP | Vascular smooth muscle contraction | 30/1112 | 134/8465 | 2.06e-03 | 8.97e-03 | 5.64e-03 | 30 |
| Page: 1 |
Top |
Cell-cell communication analysis |
| Identification of potential cell-cell interactions between two cell types and their ligand-receptor pairs for different disease states |
| Ligand | Receptor | LRpair | Pathway | Tissue | Disease Stage |
| Page: 1 |
Top |
Single-cell gene regulatory network inference analysis |
| Find out the significant the regulons (TFs) and the target genes of each regulon across cell types for different disease states |
| TF | Cell Type | Tissue | Disease Stage | Target Gene | RSS | Regulon Activity |
| ∗The dot plots of a searched regulon are shown for all cell subpopulations in each disease state of each tissue based on the regulon specific score inferred using pySCENIC and by calculating the average expression. |
| Page: 1 |
Top |
Somatic mutation of malignant transformation related genes |
| Annotation of somatic variants for genes involved in malignant transformation |
| Hugo Symbol | Variant Class | Variant Classification | dbSNP RS | HGVSc | HGVSp | HGVSp Short | SWISSPROT | BIOTYPE | SIFT | PolyPhen | Tumor Sample Barcode | Tissue | Histology | Sex | Age | Stage | Therapy Types | Drugs | Outcome |
| RAMP1 | SNV | Missense_Mutation | rs145088404 | c.331N>A | p.Val111Met | p.V111M | O60894 | protein_coding | tolerated(0.06) | benign(0.115) | TCGA-C5-A1MP-01 | Cervix | cervical & endocervical cancer | Female | <65 | I/II | Unknown | Unknown | SD |
| RAMP1 | SNV | Missense_Mutation | c.121N>A | p.Leu41Ile | p.L41I | O60894 | protein_coding | deleterious(0.01) | probably_damaging(0.972) | TCGA-AA-A01R-01 | Colorectum | colon adenocarcinoma | Male | <65 | III/IV | Chemotherapy | 5-fluorouracil | PD | |
| RAMP1 | SNV | Missense_Mutation | c.314N>A | p.Pro105His | p.P105H | O60894 | protein_coding | deleterious(0) | probably_damaging(0.956) | TCGA-CK-5913-01 | Colorectum | colon adenocarcinoma | Female | <65 | I/II | Unknown | Unknown | SD | |
| RAMP1 | SNV | Missense_Mutation | rs757584759 | c.370G>A | p.Val124Met | p.V124M | O60894 | protein_coding | tolerated(0.1) | benign(0.075) | TCGA-D5-6530-01 | Colorectum | colon adenocarcinoma | Male | <65 | I/II | Unknown | Unknown | SD |
| RAMP1 | SNV | Missense_Mutation | c.239T>C | p.Leu80Pro | p.L80P | O60894 | protein_coding | deleterious(0) | probably_damaging(0.983) | TCGA-G4-6586-01 | Colorectum | colon adenocarcinoma | Female | >=65 | I/II | Unknown | Unknown | SD | |
| RAMP1 | SNV | Missense_Mutation | rs748132271 | c.230N>T | p.Ala77Val | p.A77V | O60894 | protein_coding | deleterious(0.04) | benign(0.314) | TCGA-AP-A1DV-01 | Endometrium | uterine corpus endometrioid carcinoma | Female | <65 | I/II | Unknown | Unknown | SD |
| RAMP1 | SNV | Missense_Mutation | c.276C>A | p.Phe92Leu | p.F92L | O60894 | protein_coding | deleterious(0.03) | benign(0.251) | TCGA-BS-A0UV-01 | Endometrium | uterine corpus endometrioid carcinoma | Female | <65 | III/IV | Unknown | Unknown | SD | |
| RAMP1 | SNV | Missense_Mutation | novel | c.338N>G | p.Asp113Gly | p.D113G | O60894 | protein_coding | deleterious(0.03) | probably_damaging(0.992) | TCGA-D1-A175-01 | Endometrium | uterine corpus endometrioid carcinoma | Female | <65 | I/II | Chemotherapy | paclitaxel | SD |
| RAMP1 | SNV | Missense_Mutation | novel | c.135G>T | p.Gln45His | p.Q45H | O60894 | protein_coding | deleterious(0.01) | possibly_damaging(0.82) | TCGA-EY-A1GO-01 | Endometrium | uterine corpus endometrioid carcinoma | Female | >=65 | III/IV | Chemotherapy | carboplatin | PD |
| RAMP1 | SNV | Missense_Mutation | rs372494526 | c.151N>A | p.Val51Ile | p.V51I | O60894 | protein_coding | tolerated(0.91) | benign(0.012) | TCGA-CN-A49A-01 | Oral cavity | head & neck squamous cell carcinoma | Male | <65 | I/II | Chemotherapy | carboplatin | PD |
| Page: 1 2 |
Top |
Related drugs of malignant transformation related genes |
| Identification of chemicals and drugs interact with genes involved in malignant transfromation |
| (DGIdb 4.0) |
| Entrez ID | Symbol | Category | Interaction Types | Drug Claim Name | Drug Name | PMIDs |
| 10267 | RAMP1 | DRUGGABLE GENOME, CELL SURFACE | PRAMLINTIDE | PRAMLINTIDE | ||
| 10267 | RAMP1 | DRUGGABLE GENOME, CELL SURFACE | SALMON CALCITONIN | |||
| 10267 | RAMP1 | DRUGGABLE GENOME, CELL SURFACE | PRAMLINTIDE | PRAMLINTIDE | ||
| 10267 | RAMP1 | DRUGGABLE GENOME, CELL SURFACE | PRAMLINTIDE | PRAMLINTIDE | ||
| 10267 | RAMP1 | DRUGGABLE GENOME, CELL SURFACE | agonist | CHEMBL2105635 | DAVALINTIDE | |
| 10267 | RAMP1 | DRUGGABLE GENOME, CELL SURFACE | agonist | CHEMBL3833353 | PRAMLINTIDE ACETATE |
| Page: 1 |

Copyright 2023-Present -The University of Texas Health Science Center at Houston |