
|
|||||
|
 | |
| |
| |
| |
| |
| |
|
Gene: RAMAC |
Gene summary for RAMAC |
| Gene information | Species | Human | Gene symbol | RAMAC | Gene ID | 83640 |
| Gene name | RNA guanine-7 methyltransferase activating subunit | |
| Gene Alias | C15orf18 | |
| Cytomap | 15q25.2 | |
| Gene Type | protein-coding | GO ID | GO:0001510 | UniProtAcc | Q9BTL3 |
Top |
Malignant transformation analysis |
| Identification of the aberrant gene expression in precancerous and cancerous lesions by comparing the gene expression of stem-like cells in diseased tissues with normal stem cells |
| Entrez ID | Symbol | Replicates | Species | Organ | Tissue | Adj P-value | Log2FC | Malignancy |
| 83640 | RAMAC | LZE2D | Human | Esophagus | HGIN | 3.64e-03 | 4.85e-01 | 0.0642 |
| 83640 | RAMAC | LZE2T | Human | Esophagus | ESCC | 2.18e-04 | 5.15e-01 | 0.082 |
| 83640 | RAMAC | LZE4T | Human | Esophagus | ESCC | 2.85e-25 | 5.62e-01 | 0.0811 |
| 83640 | RAMAC | LZE5T | Human | Esophagus | ESCC | 1.28e-07 | 4.66e-01 | 0.0514 |
| 83640 | RAMAC | LZE7T | Human | Esophagus | ESCC | 7.39e-21 | 8.10e-01 | 0.0667 |
| 83640 | RAMAC | LZE8T | Human | Esophagus | ESCC | 1.35e-07 | 2.65e-01 | 0.067 |
| 83640 | RAMAC | LZE20T | Human | Esophagus | ESCC | 6.96e-12 | 3.42e-01 | 0.0662 |
| 83640 | RAMAC | LZE21D1 | Human | Esophagus | HGIN | 4.41e-04 | 3.94e-01 | 0.0632 |
| 83640 | RAMAC | LZE22D1 | Human | Esophagus | HGIN | 1.24e-04 | 2.56e-01 | 0.0595 |
| 83640 | RAMAC | LZE22T | Human | Esophagus | ESCC | 6.95e-12 | 5.38e-01 | 0.068 |
| 83640 | RAMAC | LZE24T | Human | Esophagus | ESCC | 3.76e-31 | 5.93e-01 | 0.0596 |
| 83640 | RAMAC | LZE21T | Human | Esophagus | ESCC | 9.73e-05 | 3.22e-01 | 0.0655 |
| 83640 | RAMAC | LZE6T | Human | Esophagus | ESCC | 4.85e-19 | 5.67e-01 | 0.0845 |
| Page: 1 |
| Tissue | Expression Dynamics | Abbreviation |
| Esophagus | 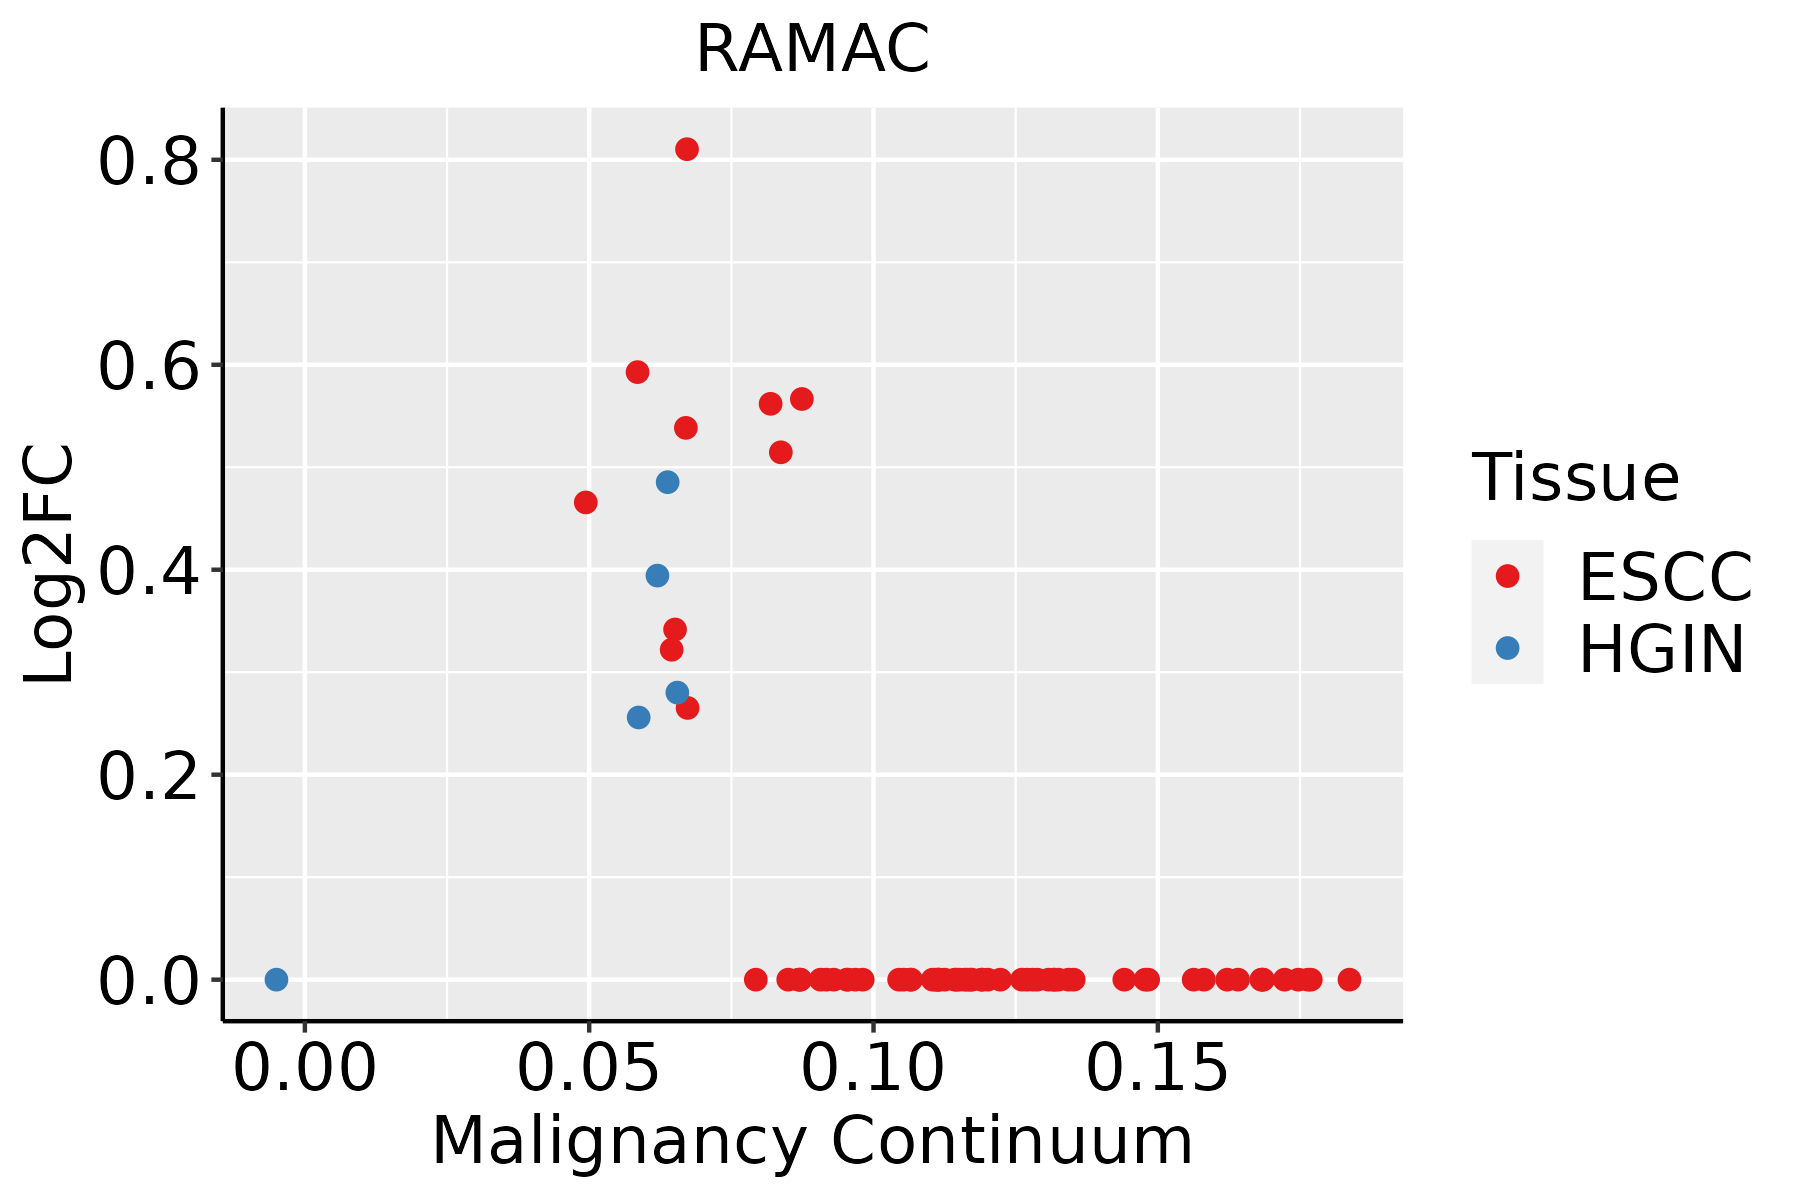 | ESCC: Esophageal squamous cell carcinoma |
| HGIN: High-grade intraepithelial neoplasias | ||
| LGIN: Low-grade intraepithelial neoplasias |
| ∗log2FC in expression of this searched gene in stem-like cells from each diseased tissue sample relative to stem-like cells in normal samples in each tissue plotted against the malignancy continuum. Samples are colored based on if they are from different disease stage. |
Top |
Malignant transformation related pathway analysis |
| Find out the enriched GO biological processes and KEGG pathways involved in transition from healthy to precancer to cancer |
| Tissue | Disease Stage | Enriched GO biological Processes |
| Colorectum | AD |  |
| Colorectum | SER |  |
| Colorectum | MSS |  |
| Colorectum | MSI-H |  |
| Colorectum | FAP |  |
| ∗Top 15 enriched GO BP terms are showed in the bar plot of each disease state in each tissue. Each row represents a significant GO biological process which is colored according to the -log10(p.adjust). |
| Page: 1 2 3 4 5 6 7 8 9 |
| GO ID | Tissue | Disease Stage | Description | Gene Ratio | Bg Ratio | pvalue | p.adjust | Count |
| GO:002261327 | Esophagus | HGIN | ribonucleoprotein complex biogenesis | 158/2587 | 463/18723 | 2.61e-29 | 5.23e-26 | 158 |
| GO:007182627 | Esophagus | HGIN | ribonucleoprotein complex subunit organization | 84/2587 | 227/18723 | 1.34e-18 | 5.37e-16 | 84 |
| GO:002261827 | Esophagus | HGIN | ribonucleoprotein complex assembly | 82/2587 | 220/18723 | 2.07e-18 | 7.36e-16 | 82 |
| GO:0022613111 | Esophagus | ESCC | ribonucleoprotein complex biogenesis | 365/8552 | 463/18723 | 1.74e-49 | 1.11e-45 | 365 |
| GO:0071826111 | Esophagus | ESCC | ribonucleoprotein complex subunit organization | 166/8552 | 227/18723 | 2.94e-17 | 2.42e-15 | 166 |
| GO:0022618111 | Esophagus | ESCC | ribonucleoprotein complex assembly | 159/8552 | 220/18723 | 8.19e-16 | 5.71e-14 | 159 |
| GO:00434143 | Esophagus | ESCC | macromolecule methylation | 199/8552 | 316/18723 | 3.44e-10 | 9.57e-09 | 199 |
| GO:00322592 | Esophagus | ESCC | methylation | 222/8552 | 364/18723 | 2.26e-09 | 5.09e-08 | 222 |
| GO:00094512 | Esophagus | ESCC | RNA modification | 114/8552 | 167/18723 | 2.76e-09 | 6.04e-08 | 114 |
| GO:00015101 | Esophagus | ESCC | RNA methylation | 58/8552 | 83/18723 | 6.87e-06 | 6.94e-05 | 58 |
| Page: 1 |
| Pathway ID | Tissue | Disease Stage | Description | Gene Ratio | Bg Ratio | pvalue | p.adjust | qvalue | Count |
| Page: 1 |
Top |
Cell-cell communication analysis |
| Identification of potential cell-cell interactions between two cell types and their ligand-receptor pairs for different disease states |
| Ligand | Receptor | LRpair | Pathway | Tissue | Disease Stage |
| Page: 1 |
Top |
Single-cell gene regulatory network inference analysis |
| Find out the significant the regulons (TFs) and the target genes of each regulon across cell types for different disease states |
| TF | Cell Type | Tissue | Disease Stage | Target Gene | RSS | Regulon Activity |
| ∗The dot plots of a searched regulon are shown for all cell subpopulations in each disease state of each tissue based on the regulon specific score inferred using pySCENIC and by calculating the average expression. |
| Page: 1 |
Top |
Somatic mutation of malignant transformation related genes |
| Annotation of somatic variants for genes involved in malignant transformation |
| Hugo Symbol | Variant Class | Variant Classification | dbSNP RS | HGVSc | HGVSp | HGVSp Short | SWISSPROT | BIOTYPE | SIFT | PolyPhen | Tumor Sample Barcode | Tissue | Histology | Sex | Age | Stage | Therapy Types | Drugs | Outcome |
| Page: 1 |
Top |
Related drugs of malignant transformation related genes |
| Identification of chemicals and drugs interact with genes involved in malignant transfromation |
| (DGIdb 4.0) |
| Entrez ID | Symbol | Category | Interaction Types | Drug Claim Name | Drug Name | PMIDs |
| Page: 1 |

Copyright 2023-Present -The University of Texas Health Science Center at Houston |