Schematic overview of the cellular and molecular mechanisms involved in the cancer progression, including the proposed cellular and molecular mechanisms in cancer cells trajectory. AT1: alveolar type 1 cells; AT2: alveolar type 2 cells; AAH: atypical adenomatous hyperplasia; AIS: adenocarcinoma in situ; MIA: minimally invasive adenocarcinoma; IA: invasive adenocarcinoma; EMT: epithelial-mesenchymal transition

Home

Download

Statistics

Help

Contact

Center for Computational Systems Medicine
leaf

Gene summary

leaf

Malignant transformation analysis

leaf

Malignant transformation related pathway analysis

leaf

Cell-cell communication analysis

leaf

Single-cell gene regulatory network inference analysis

leaf

Somatic mutation of malignant transformation related genes

leaf

Related drugs of malignant transformation related genes

Gene: RALY

Gene summary for RALY

check button Gene summary.

Gene informationSpeciesHuman
Gene symbol

RALY

Gene ID

22913

Gene nameRALY heterogeneous nuclear ribonucleoprotein
Gene AliasHNRPCL2
Cytomap20q11.22
Gene Typeprotein-coding
GO ID

GO:0000375

UniProtAcc

Q9UKM9


Top

Malignant transformation analysis

check button Identification of the aberrant gene expression in precancerous and cancerous lesions by comparing the gene expression of stem-like cells in diseased tissues with normal stem cells
check button Malignant transformation involving gene list.
Entrez IDSymbolReplicatesSpeciesOrganTissueAdj P-valueLog2FCMalignancy
22913RALYHTA11_2487_2000001011HumanColorectumSER9.82e-034.85e-01-0.1808
22913RALYHTA11_347_2000001011HumanColorectumAD1.03e-034.21e-01-0.1954
22913RALYHTA11_411_2000001011HumanColorectumSER3.16e-068.54e-01-0.2602
22913RALYHTA11_99999965104_69814HumanColorectumMSS1.12e-056.25e-010.281
22913RALYHTA11_99999971662_82457HumanColorectumMSS1.88e-108.40e-010.3859
22913RALYHTA11_99999974143_84620HumanColorectumMSS4.39e-055.04e-010.3005
22913RALYF007HumanColorectumFAP2.96e-04-2.22e-010.1176
22913RALYA002-C-010HumanColorectumFAP1.05e-06-1.96e-010.242
22913RALYA001-C-207HumanColorectumFAP4.87e-07-2.95e-010.1278
22913RALYA015-C-203HumanColorectumFAP2.96e-29-3.84e-01-0.1294
22913RALYA015-C-204HumanColorectumFAP5.61e-09-3.20e-01-0.0228
22913RALYA014-C-040HumanColorectumFAP1.43e-05-4.74e-01-0.1184
22913RALYA002-C-201HumanColorectumFAP8.05e-17-4.02e-010.0324
22913RALYA002-C-203HumanColorectumFAP5.61e-04-1.07e-010.2786
22913RALYA001-C-119HumanColorectumFAP8.97e-16-5.93e-01-0.1557
22913RALYA001-C-108HumanColorectumFAP3.22e-20-3.96e-01-0.0272
22913RALYA002-C-205HumanColorectumFAP1.14e-24-4.47e-01-0.1236
22913RALYA001-C-104HumanColorectumFAP1.59e-06-3.11e-010.0184
22913RALYA015-C-005HumanColorectumFAP1.26e-09-3.73e-01-0.0336
22913RALYA015-C-006HumanColorectumFAP3.73e-21-5.44e-01-0.0994
Page: 1 2 3 4 5 6 7 8 9 

check button Transcriptomic changes along malignancy continuum.
TissueExpression DynamicsAbbreviation
Colorectum (GSE201348)The image shows the transcriptomic changes along malignancy continuum.log2FC in expression of this searched gene in stem-like cells from each diseased tissue sample relative to stem-like cells in normal samples in each tissue plotted against the malignancy continuum. Samples are colored based on if they are from different disease stage.FAP: Familial adenomatous polyposis
CRC: Colorectal cancer
Colorectum (HTA11)The image shows the transcriptomic changes along malignancy continuum.log2FC in expression of this searched gene in stem-like cells from each diseased tissue sample relative to stem-like cells in normal samples in each tissue plotted against the malignancy continuum. Samples are colored based on if they are from different disease stage.AD: Adenomas
SER: Sessile serrated lesions
MSI-H: Microsatellite-high colorectal cancer
MSS: Microsatellite stable colorectal cancer
EsophagusThe image shows the transcriptomic changes along malignancy continuum.log2FC in expression of this searched gene in stem-like cells from each diseased tissue sample relative to stem-like cells in normal samples in each tissue plotted against the malignancy continuum. Samples are colored based on if they are from different disease stage.
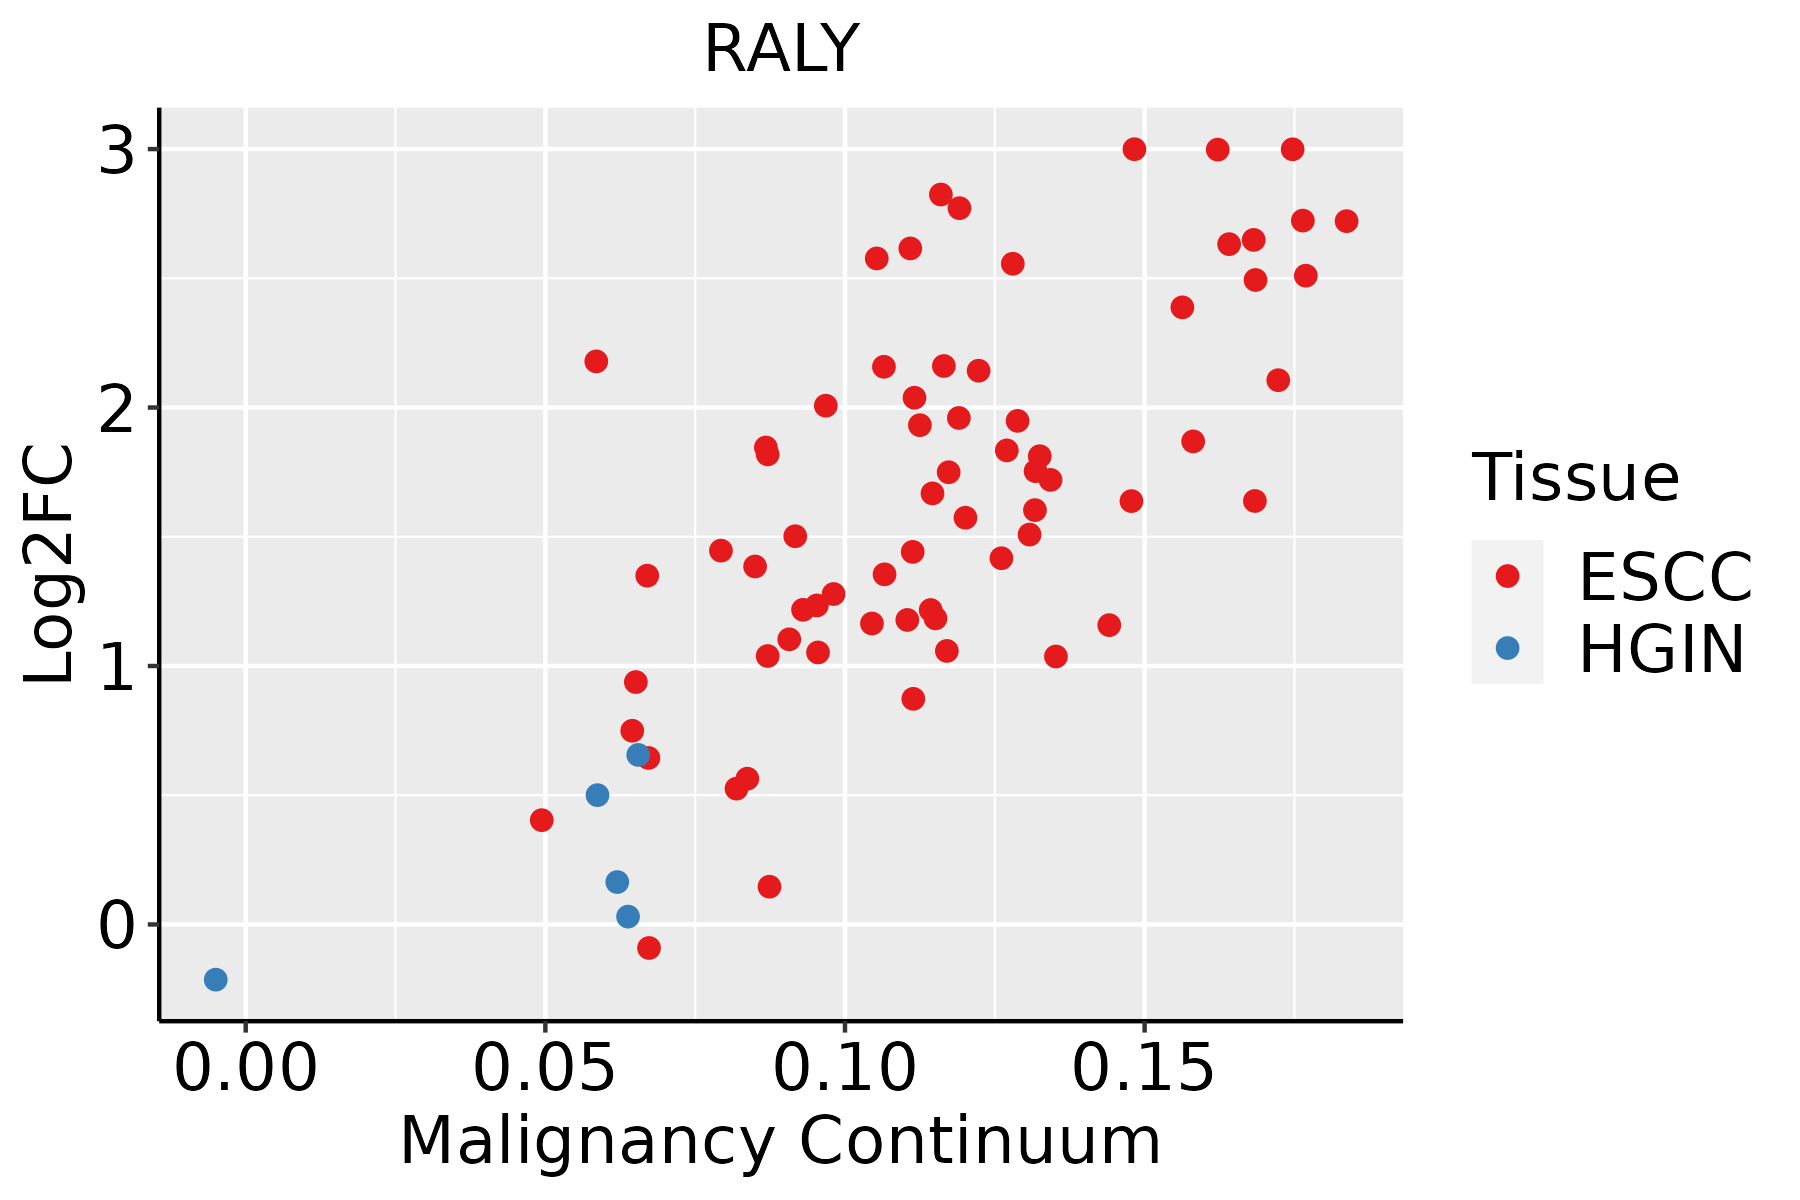
ESCC: Esophageal squamous cell carcinoma
HGIN: High-grade intraepithelial neoplasias
LGIN: Low-grade intraepithelial neoplasias
LiverThe image shows the transcriptomic changes along malignancy continuum.log2FC in expression of this searched gene in stem-like cells from each diseased tissue sample relative to stem-like cells in normal samples in each tissue plotted against the malignancy continuum. Samples are colored based on if they are from different disease stage.
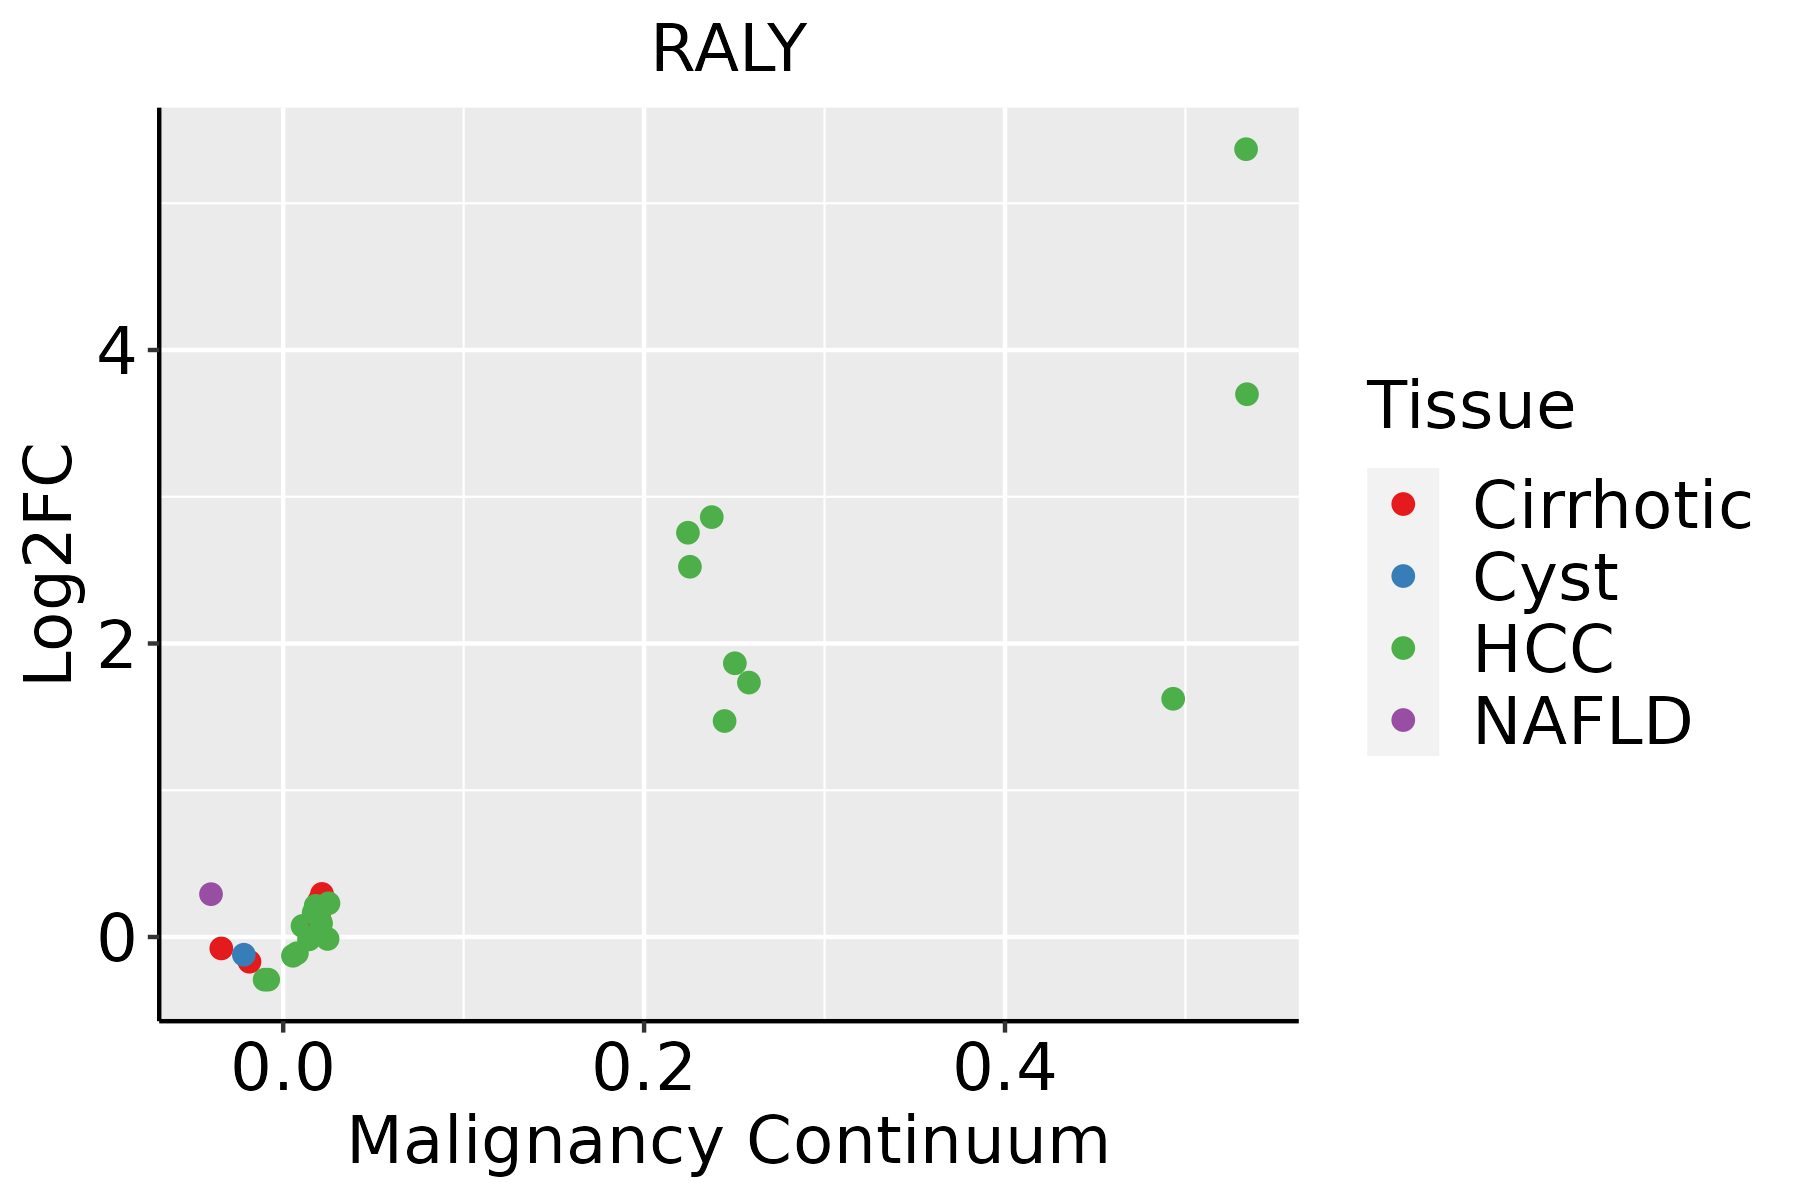
HCC: Hepatocellular carcinoma
NAFLD: Non-alcoholic fatty liver disease
LungThe image shows the transcriptomic changes along malignancy continuum.log2FC in expression of this searched gene in stem-like cells from each diseased tissue sample relative to stem-like cells in normal samples in each tissue plotted against the malignancy continuum. Samples are colored based on if they are from different disease stage.
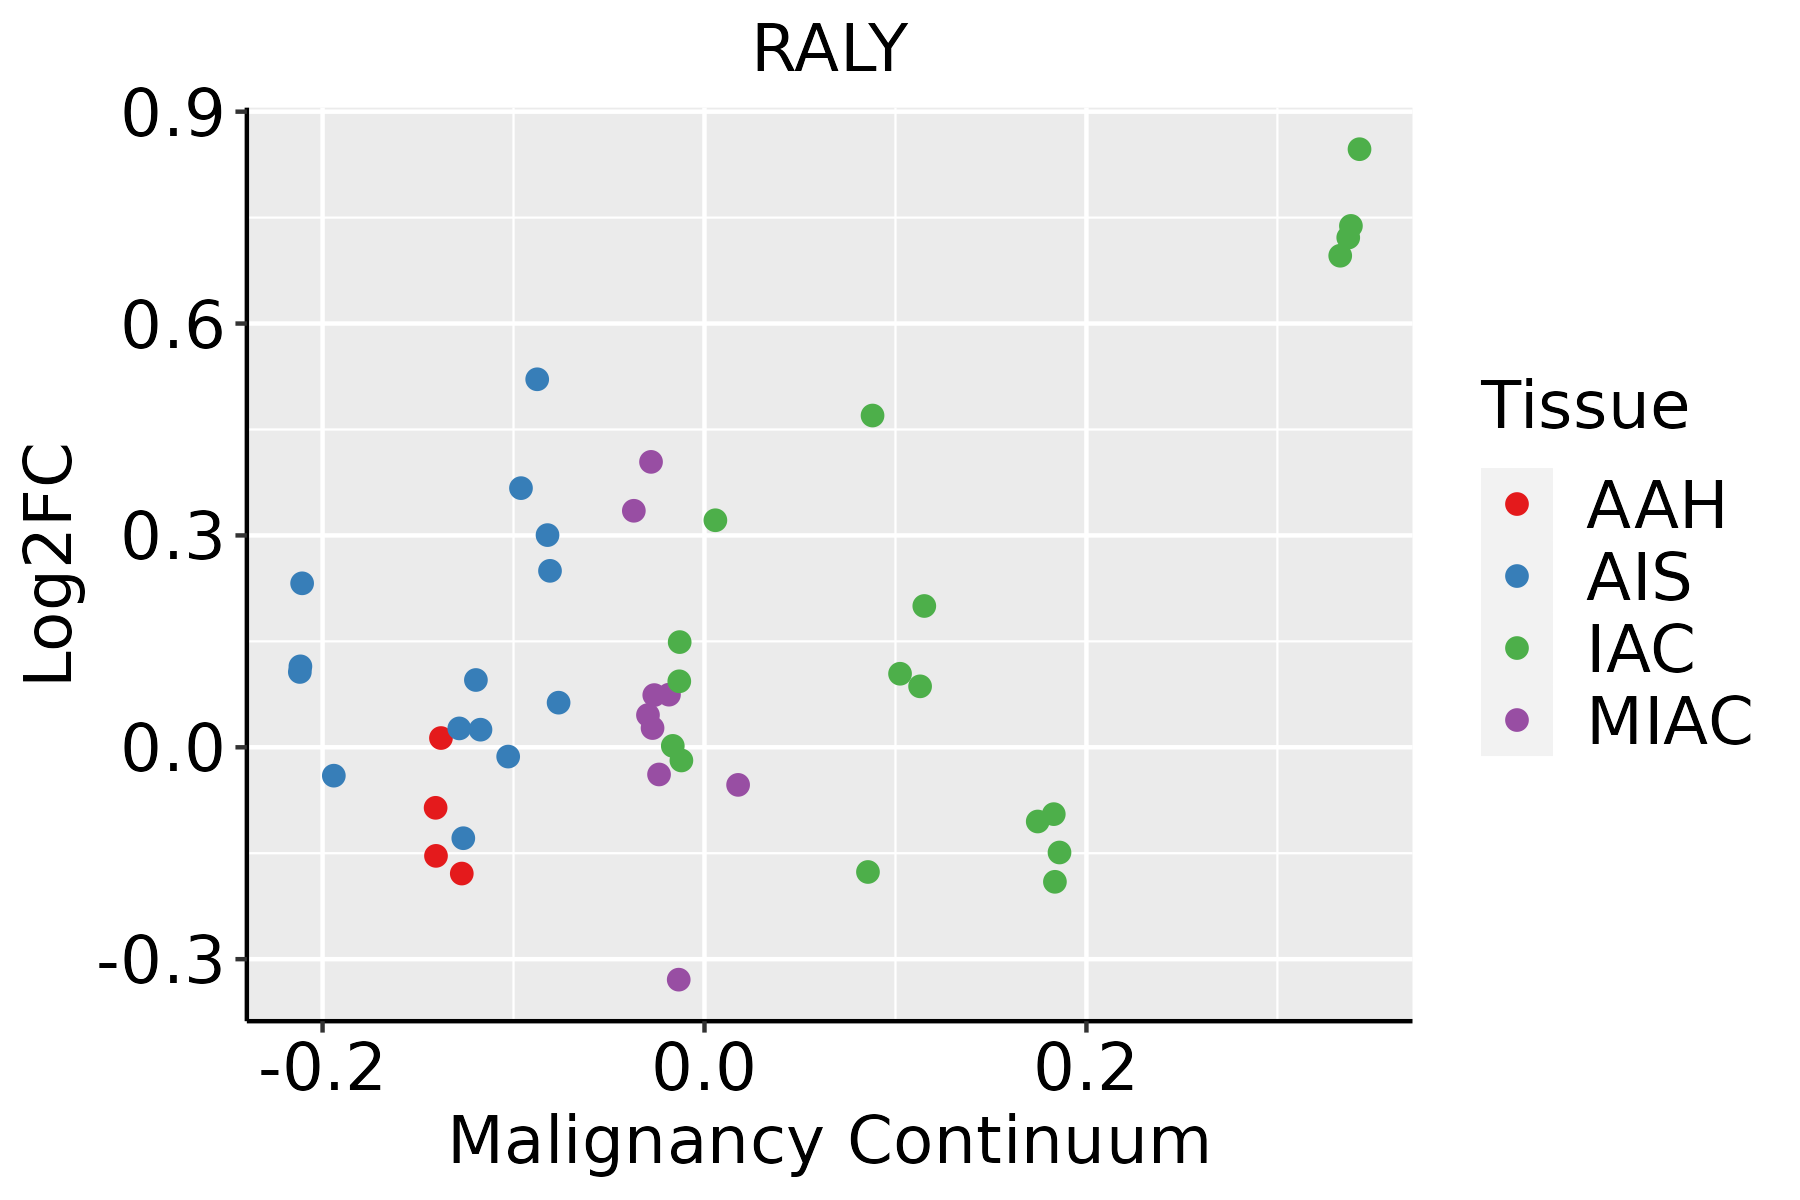
AAH: Atypical adenomatous hyperplasia
AIS: Adenocarcinoma in situ
IAC: Invasive lung adenocarcinoma
MIA: Minimally invasive adenocarcinoma
Oral CavityThe image shows the transcriptomic changes along malignancy continuum.log2FC in expression of this searched gene in stem-like cells from each diseased tissue sample relative to stem-like cells in normal samples in each tissue plotted against the malignancy continuum. Samples are colored based on if they are from different disease stage.
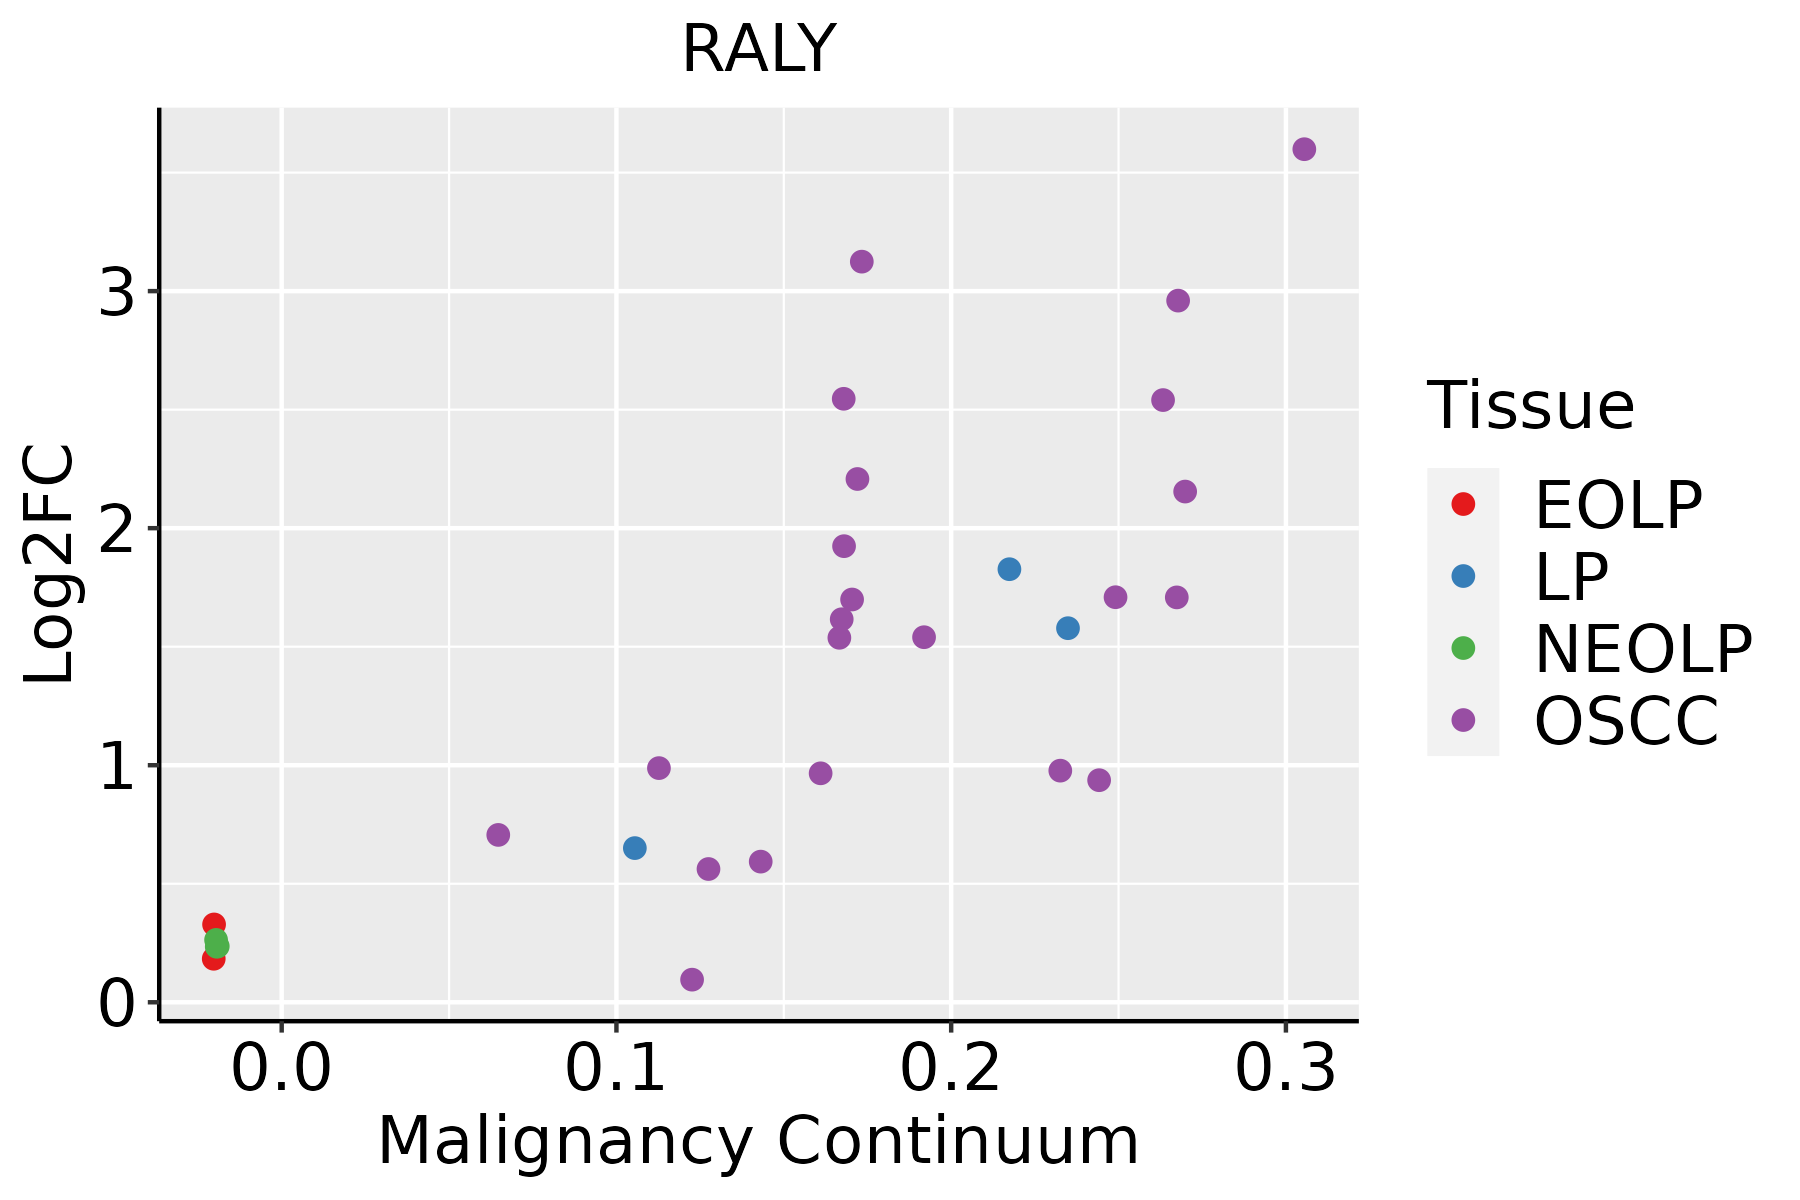
EOLP: Erosive Oral lichen planus
LP: leukoplakia
NEOLP: Non-erosive oral lichen planus
OSCC: Oral squamous cell carcinoma
SkinThe image shows the transcriptomic changes along malignancy continuum.log2FC in expression of this searched gene in stem-like cells from each diseased tissue sample relative to stem-like cells in normal samples in each tissue plotted against the malignancy continuum. Samples are colored based on if they are from different disease stage.AK: Actinic keratosis
cSCC: Cutaneous squamous cell carcinoma
SCCIS:squamous cell carcinoma in situ
ThyroidThe image shows the transcriptomic changes along malignancy continuum.log2FC in expression of this searched gene in stem-like cells from each diseased tissue sample relative to stem-like cells in normal samples in each tissue plotted against the malignancy continuum. Samples are colored based on if they are from different disease stage.ATC: Anaplastic thyroid cancer
HT: Hashimoto's thyroiditis
PTC: Papillary thyroid cancer
∗log2FC in expression of this searched gene in stem-like cells from each diseased tissue sample relative to stem-like cells in normal samples in each tissue plotted against the malignancy continuum. Samples are colored based on if they are from different disease stage.

Top

Malignant transformation related pathway analysis

check buttonFind out the enriched GO biological processes and KEGG pathways involved in transition from healthy to precancer to cancer
check button Figure of enriched GO biological processes.
TissueDisease StageEnriched GO biological Processes
ColorectumADGO analysis - Figure of enriched GO biological processes: Top 15 enriched GO BP terms are showed in the bar plot of each disease state in each tissue. Each row represents a significant GO biological process which is colored according to the -log10(p.adjust).
ColorectumSERGO analysis - Figure of enriched GO biological processes: Top 15 enriched GO BP terms are showed in the bar plot of each disease state in each tissue. Each row represents a significant GO biological process which is colored according to the -log10(p.adjust).
ColorectumMSSGO analysis - Figure of enriched GO biological processes: Top 15 enriched GO BP terms are showed in the bar plot of each disease state in each tissue. Each row represents a significant GO biological process which is colored according to the -log10(p.adjust).
ColorectumMSI-HGO analysis - Figure of enriched GO biological processes: Top 15 enriched GO BP terms are showed in the bar plot of each disease state in each tissue. Each row represents a significant GO biological process which is colored according to the -log10(p.adjust).
ColorectumFAPGO analysis - Figure of enriched GO biological processes: Top 15 enriched GO BP terms are showed in the bar plot of each disease state in each tissue. Each row represents a significant GO biological process which is colored according to the -log10(p.adjust).
∗Top 15 enriched GO BP terms are showed in the bar plot of each disease state in each tissue. Each row represents a significant GO biological process which is colored according to the -log10(p.adjust).
Page: 1 2 3 4 5 6 7 8 9 

check button Enriched GO biological processes.
GO IDTissueDisease StageDescriptionGene RatioBg Ratiopvaluep.adjustCount
GO:0008380ColorectumADRNA splicing169/3918434/187233.59e-182.04e-15169
GO:0000377ColorectumADRNA splicing, via transesterification reactions with bulged adenosine as nucleophile130/3918320/187235.88e-162.16e-13130
GO:0000398ColorectumADmRNA splicing, via spliceosome130/3918320/187235.88e-162.16e-13130
GO:0000375ColorectumADRNA splicing, via transesterification reactions131/3918324/187237.11e-162.22e-13131
GO:00083801ColorectumSERRNA splicing123/2897434/187233.84e-128.41e-10123
GO:00003751ColorectumSERRNA splicing, via transesterification reactions90/2897324/187238.68e-097.50e-0790
GO:00003771ColorectumSERRNA splicing, via transesterification reactions with bulged adenosine as nucleophile89/2897320/187239.82e-098.14e-0789
GO:00003981ColorectumSERmRNA splicing, via spliceosome89/2897320/187239.82e-098.14e-0789
GO:00083802ColorectumMSSRNA splicing159/3467434/187231.75e-191.22e-16159
GO:00003772ColorectumMSSRNA splicing, via transesterification reactions with bulged adenosine as nucleophile121/3467320/187232.52e-168.27e-14121
GO:00003982ColorectumMSSmRNA splicing, via spliceosome121/3467320/187232.52e-168.27e-14121
GO:00003752ColorectumMSSRNA splicing, via transesterification reactions122/3467324/187232.75e-168.58e-14122
GO:00083804ColorectumFAPRNA splicing108/2622434/187237.90e-101.86e-07108
GO:00003754ColorectumFAPRNA splicing, via transesterification reactions84/2622324/187238.06e-091.10e-0684
GO:00003774ColorectumFAPRNA splicing, via transesterification reactions with bulged adenosine as nucleophile83/2622320/187239.66e-091.23e-0683
GO:00003984ColorectumFAPmRNA splicing, via spliceosome83/2622320/187239.66e-091.23e-0683
GO:00083805ColorectumCRCRNA splicing90/2078434/187232.80e-097.97e-0790
GO:00003775ColorectumCRCRNA splicing, via transesterification reactions with bulged adenosine as nucleophile66/2078320/187234.39e-073.37e-0566
GO:00003985ColorectumCRCmRNA splicing, via spliceosome66/2078320/187234.39e-073.37e-0566
GO:00003755ColorectumCRCRNA splicing, via transesterification reactions66/2078324/187237.00e-074.61e-0566
Page: 1 2 3 4 

check button Enriched KEGG pathways.
Pathway IDTissueDisease StageDescriptionGene RatioBg Ratiopvaluep.adjustqvalueCount
Page: 1 

Top

Cell-cell communication analysis

check buttonIdentification of potential cell-cell interactions between two cell types and their ligand-receptor pairs for different disease states
LigandReceptorLRpairPathwayTissueDisease Stage
Page: 1 

Top

Single-cell gene regulatory network inference analysis

check buttonFind out the significant the regulons (TFs) and the target genes of each regulon across cell types for different disease states
TFCell TypeTissueDisease StageTarget GeneRSSRegulon Activity
∗The dot plots of a searched regulon are shown for all cell subpopulations in each disease state of each tissue based on the regulon specific score inferred using pySCENIC and by calculating the average expression.
Page: 1 

Top

Somatic mutation of malignant transformation related genes

check buttonAnnotation of somatic variants for genes involved in malignant transformation
Hugo SymbolVariant ClassVariant ClassificationdbSNP RSHGVScHGVSpHGVSp ShortSWISSPROTBIOTYPESIFTPolyPhenTumor Sample BarcodeTissueHistologySexAgeStageTherapy TypesDrugsOutcome
RALYSNVMissense_Mutationnovelc.898N>Tp.Ala300Serp.A300SQ9UKM9protein_codingdeleterious_low_confidence(0.03)benign(0.285)TCGA-A2-A25A-01Breastbreast invasive carcinomaFemale<65I/IIUnspecificCytoxanSD
RALYSNVMissense_Mutationrs768865097c.364N>Ap.Asp122Asnp.D122NQ9UKM9protein_codingtolerated(0.08)possibly_damaging(0.494)TCGA-AQ-A0Y5-01Breastbreast invasive carcinomaFemale>=65III/IVChemotherapycytoxanSD
RALYSNVMissense_Mutationc.406N>Ap.Pro136Thrp.P136TQ9UKM9protein_codingdeleterious(0)possibly_damaging(0.714)TCGA-BH-A0BZ-01Breastbreast invasive carcinomaFemale<65III/IVChemotherapydoxorubicinCR
RALYSNVMissense_Mutationc.169T>Cp.Tyr57Hisp.Y57HQ9UKM9protein_codingdeleterious(0.02)possibly_damaging(0.739)TCGA-D8-A1XQ-01Breastbreast invasive carcinomaFemale>=65I/IIUnknownUnknownSD
RALYSNVMissense_Mutationnovelc.205N>Tp.Arg69Trpp.R69WQ9UKM9protein_codingdeleterious(0.05)benign(0.362)TCGA-LL-A73Y-01Breastbreast invasive carcinomaFemale>=65I/IIChemotherapytaxotereSD
RALYSNVMissense_Mutationnovelc.185A>Gp.Tyr62Cysp.Y62CQ9UKM9protein_codingdeleterious(0.04)benign(0.434)TCGA-LL-A740-01Breastbreast invasive carcinomaFemale<65I/IIChemotherapyadriamycinCR
RALYSNVMissense_Mutationc.271N>Ap.Gly91Argp.G91RQ9UKM9protein_codingdeleterious(0)probably_damaging(0.995)TCGA-EK-A2PG-01Cervixcervical & endocervical cancerFemale>=65I/IIUnknownUnknownSD
RALYSNVMissense_Mutationc.67G>Cp.Val23Leup.V23LQ9UKM9protein_codingdeleterious(0.01)probably_damaging(0.997)TCGA-LP-A4AW-01Cervixcervical & endocervical cancerFemale<65I/IIUnknownUnknownSD
RALYSNVMissense_Mutationnovelc.233N>Ap.Arg78Glnp.R78QQ9UKM9protein_codingdeleterious(0.03)benign(0.074)TCGA-AA-3864-01Colorectumcolon adenocarcinomaMale>=65I/IIUnknownUnknownSD
RALYSNVMissense_Mutationc.104N>Cp.Lys35Thrp.K35TQ9UKM9protein_codingdeleterious(0.01)probably_damaging(0.999)TCGA-AA-3977-01Colorectumcolon adenocarcinomaMale>=65I/IIUnknownUnknownSD
Page: 1 2 3 4 

Top

Related drugs of malignant transformation related genes

check buttonIdentification of chemicals and drugs interact with genes involved in malignant transfromation
(DGIdb 4.0)
Entrez IDSymbolCategoryInteraction TypesDrug Claim NameDrug NamePMIDs
Page: 1