Schematic overview of the cellular and molecular mechanisms involved in the cancer progression, including the proposed cellular and molecular mechanisms in cancer cells trajectory. AT1: alveolar type 1 cells; AT2: alveolar type 2 cells; AAH: atypical adenomatous hyperplasia; AIS: adenocarcinoma in situ; MIA: minimally invasive adenocarcinoma; IA: invasive adenocarcinoma; EMT: epithelial-mesenchymal transition

Home

Download

Statistics

Help

Contact

Center for Computational Systems Medicine
leaf

Gene summary

leaf

Malignant transformation analysis

leaf

Malignant transformation related pathway analysis

leaf

Cell-cell communication analysis

leaf

Single-cell gene regulatory network inference analysis

leaf

Somatic mutation of malignant transformation related genes

leaf

Related drugs of malignant transformation related genes

Gene: RALGPS2

Gene summary for RALGPS2

check button Gene summary.

Gene informationSpeciesHuman
Gene symbol

RALGPS2

Gene ID

55103

Gene nameRal GEF with PH domain and SH3 binding motif 2
Gene AliasdJ595C2.1
Cytomap1q25.2
Gene Typeprotein-coding
GO ID

GO:0007154

UniProtAcc

Q86X27


Top

Malignant transformation analysis

check button Identification of the aberrant gene expression in precancerous and cancerous lesions by comparing the gene expression of stem-like cells in diseased tissues with normal stem cells
check button Malignant transformation involving gene list.
Entrez IDSymbolReplicatesSpeciesOrganTissueAdj P-valueLog2FCMalignancy
55103RALGPS2HTA11_3410_2000001011HumanColorectumAD1.63e-16-6.12e-010.0155
55103RALGPS2HTA11_3361_2000001011HumanColorectumAD1.83e-02-4.51e-01-0.1207
55103RALGPS2HTA11_866_2000001011HumanColorectumAD3.96e-02-3.25e-01-0.1001
55103RALGPS2HTA11_546_2000001011HumanColorectumAD2.17e-02-4.40e-01-0.0842
55103RALGPS2HTA11_866_3004761011HumanColorectumAD3.47e-09-5.18e-010.096
55103RALGPS2HTA11_10711_2000001011HumanColorectumAD1.84e-02-4.55e-010.0338
55103RALGPS2HTA11_7696_3000711011HumanColorectumAD3.60e-11-4.66e-010.0674
55103RALGPS2HTA11_99999970781_79442HumanColorectumMSS3.36e-12-5.30e-010.294
55103RALGPS2HTA11_99999971662_82457HumanColorectumMSS1.20e-02-2.79e-010.3859
55103RALGPS2HTA11_99999973899_84307HumanColorectumMSS3.75e-06-6.60e-010.2585
55103RALGPS2HTA11_99999974143_84620HumanColorectumMSS5.80e-19-5.87e-010.3005
55103RALGPS2A002-C-010HumanColorectumFAP3.37e-02-1.56e-010.242
55103RALGPS2A015-C-203HumanColorectumFAP1.84e-25-2.83e-01-0.1294
55103RALGPS2A015-C-204HumanColorectumFAP9.99e-03-4.27e-02-0.0228
55103RALGPS2A014-C-040HumanColorectumFAP3.88e-03-2.36e-01-0.1184
55103RALGPS2A002-C-201HumanColorectumFAP3.18e-11-2.86e-010.0324
55103RALGPS2A002-C-203HumanColorectumFAP4.66e-02-1.75e-010.2786
55103RALGPS2A001-C-119HumanColorectumFAP1.95e-04-2.71e-01-0.1557
55103RALGPS2A001-C-108HumanColorectumFAP1.70e-13-7.23e-02-0.0272
55103RALGPS2A002-C-205HumanColorectumFAP2.57e-19-2.60e-01-0.1236
Page: 1 2 3 4 5 6 7 8 9 

check button Transcriptomic changes along malignancy continuum.
TissueExpression DynamicsAbbreviation
Colorectum (GSE201348)The image shows the transcriptomic changes along malignancy continuum.log2FC in expression of this searched gene in stem-like cells from each diseased tissue sample relative to stem-like cells in normal samples in each tissue plotted against the malignancy continuum. Samples are colored based on if they are from different disease stage.FAP: Familial adenomatous polyposis
CRC: Colorectal cancer
Colorectum (HTA11)The image shows the transcriptomic changes along malignancy continuum.log2FC in expression of this searched gene in stem-like cells from each diseased tissue sample relative to stem-like cells in normal samples in each tissue plotted against the malignancy continuum. Samples are colored based on if they are from different disease stage.AD: Adenomas
SER: Sessile serrated lesions
MSI-H: Microsatellite-high colorectal cancer
MSS: Microsatellite stable colorectal cancer
EsophagusThe image shows the transcriptomic changes along malignancy continuum.log2FC in expression of this searched gene in stem-like cells from each diseased tissue sample relative to stem-like cells in normal samples in each tissue plotted against the malignancy continuum. Samples are colored based on if they are from different disease stage.ESCC: Esophageal squamous cell carcinoma
HGIN: High-grade intraepithelial neoplasias
LGIN: Low-grade intraepithelial neoplasias
GCThe image shows the transcriptomic changes along malignancy continuum.log2FC in expression of this searched gene in stem-like cells from each diseased tissue sample relative to stem-like cells in normal samples in each tissue plotted against the malignancy continuum. Samples are colored based on if they are from different disease stage.
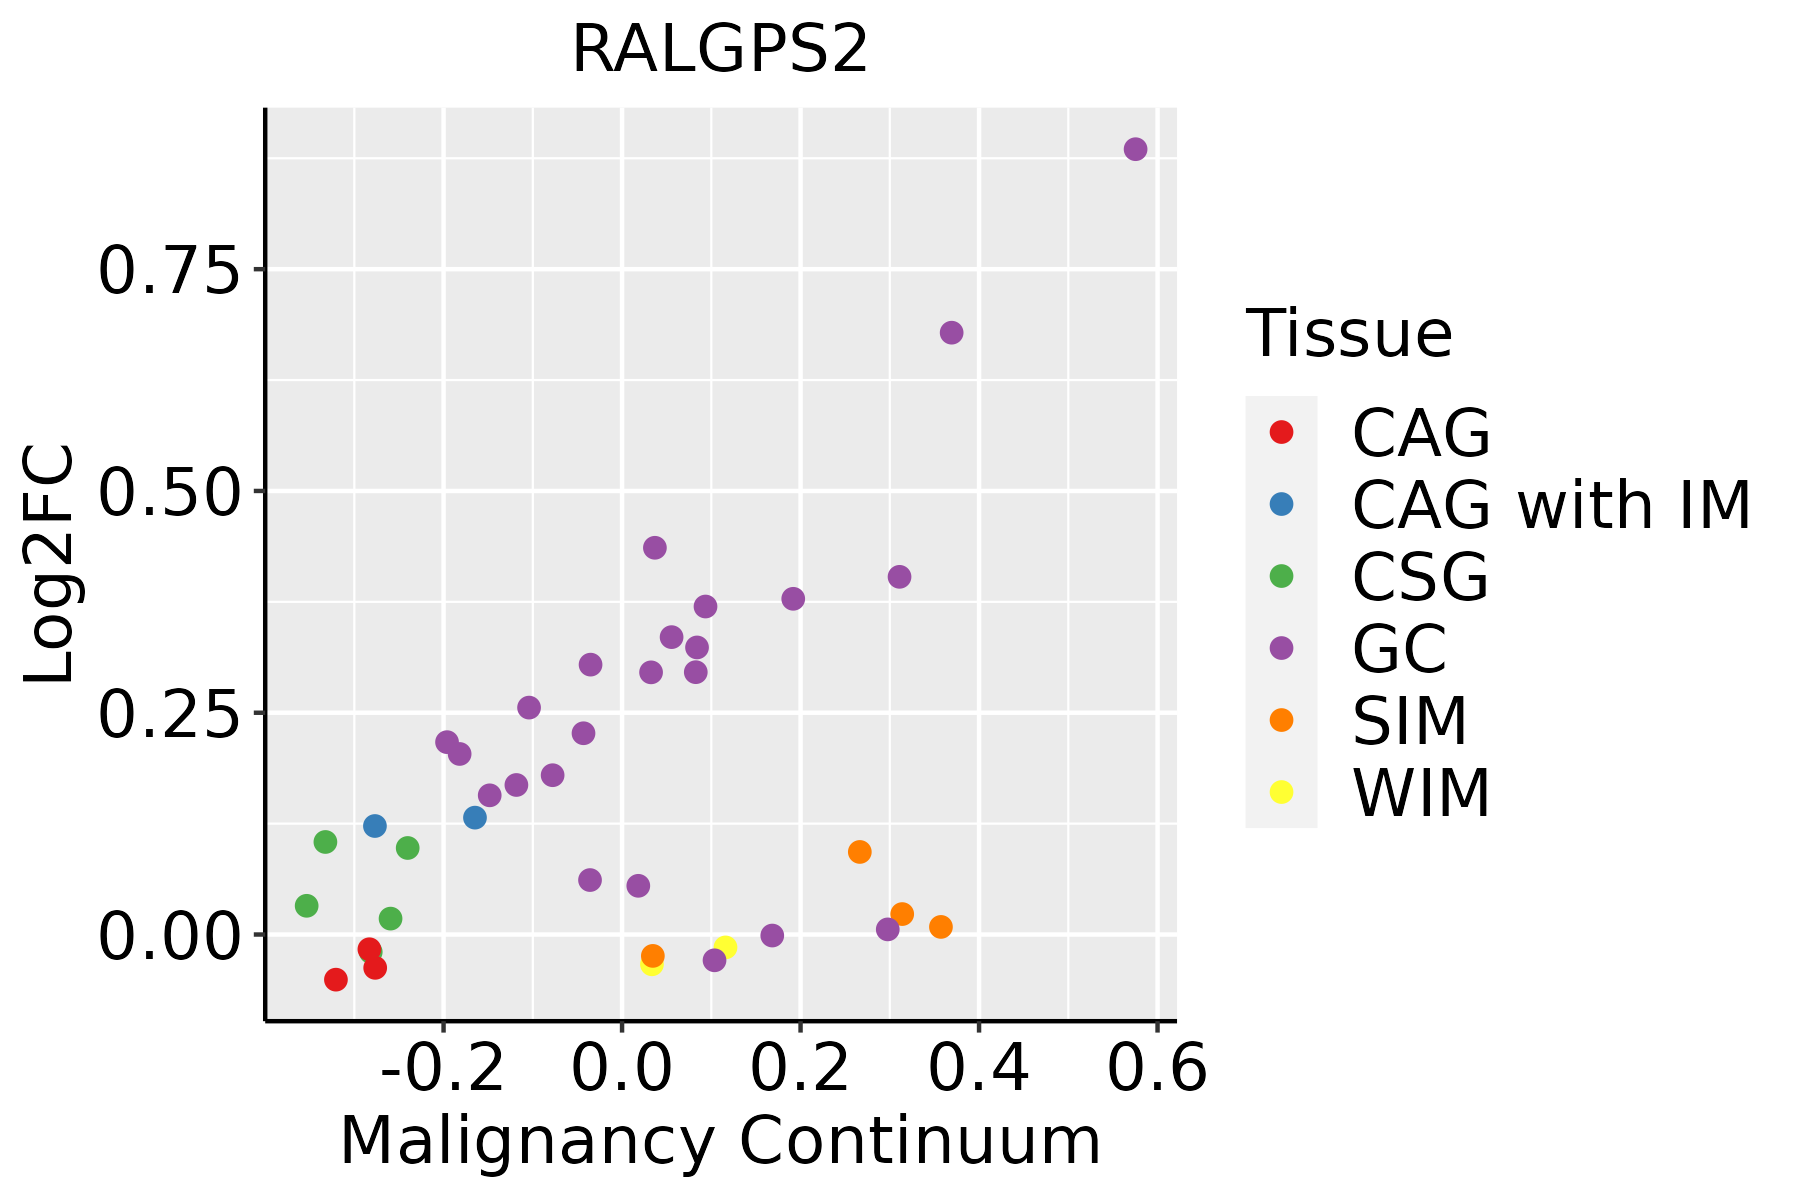
CAG: Chronic atrophic gastritis
CAG with IM: Chronic atrophic gastritis with intestinal metaplasia
CSG: Chronic superficial gastritis
GC: Gastric cancer
SIM: Severe intestinal metaplasia
WIM: Wild intestinal metaplasia
LiverThe image shows the transcriptomic changes along malignancy continuum.log2FC in expression of this searched gene in stem-like cells from each diseased tissue sample relative to stem-like cells in normal samples in each tissue plotted against the malignancy continuum. Samples are colored based on if they are from different disease stage.HCC: Hepatocellular carcinoma
NAFLD: Non-alcoholic fatty liver disease
LungThe image shows the transcriptomic changes along malignancy continuum.log2FC in expression of this searched gene in stem-like cells from each diseased tissue sample relative to stem-like cells in normal samples in each tissue plotted against the malignancy continuum. Samples are colored based on if they are from different disease stage.AAH: Atypical adenomatous hyperplasia
AIS: Adenocarcinoma in situ
IAC: Invasive lung adenocarcinoma
MIA: Minimally invasive adenocarcinoma
ProstateThe image shows the transcriptomic changes along malignancy continuum.log2FC in expression of this searched gene in stem-like cells from each diseased tissue sample relative to stem-like cells in normal samples in each tissue plotted against the malignancy continuum. Samples are colored based on if they are from different disease stage.
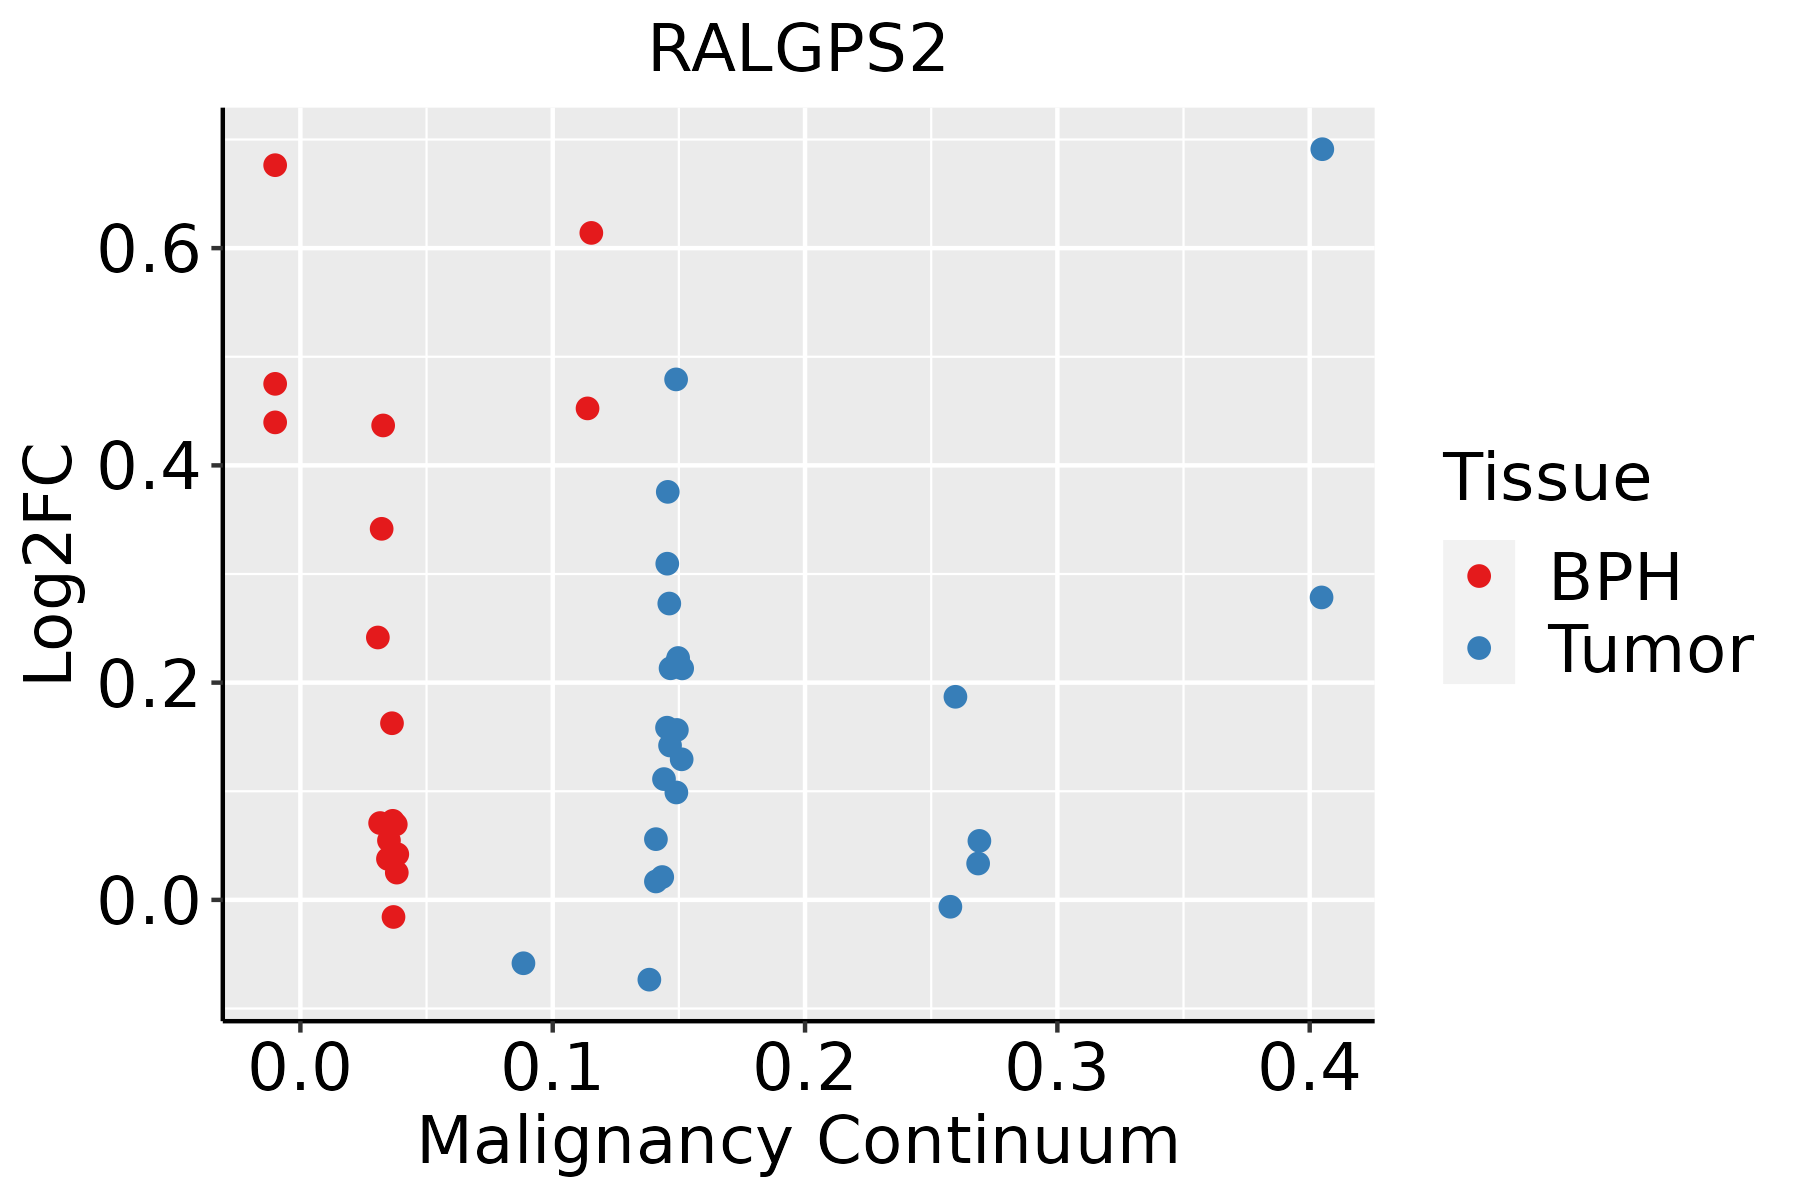
BPH: Benign Prostatic Hyperplasia
SkinThe image shows the transcriptomic changes along malignancy continuum.log2FC in expression of this searched gene in stem-like cells from each diseased tissue sample relative to stem-like cells in normal samples in each tissue plotted against the malignancy continuum. Samples are colored based on if they are from different disease stage.
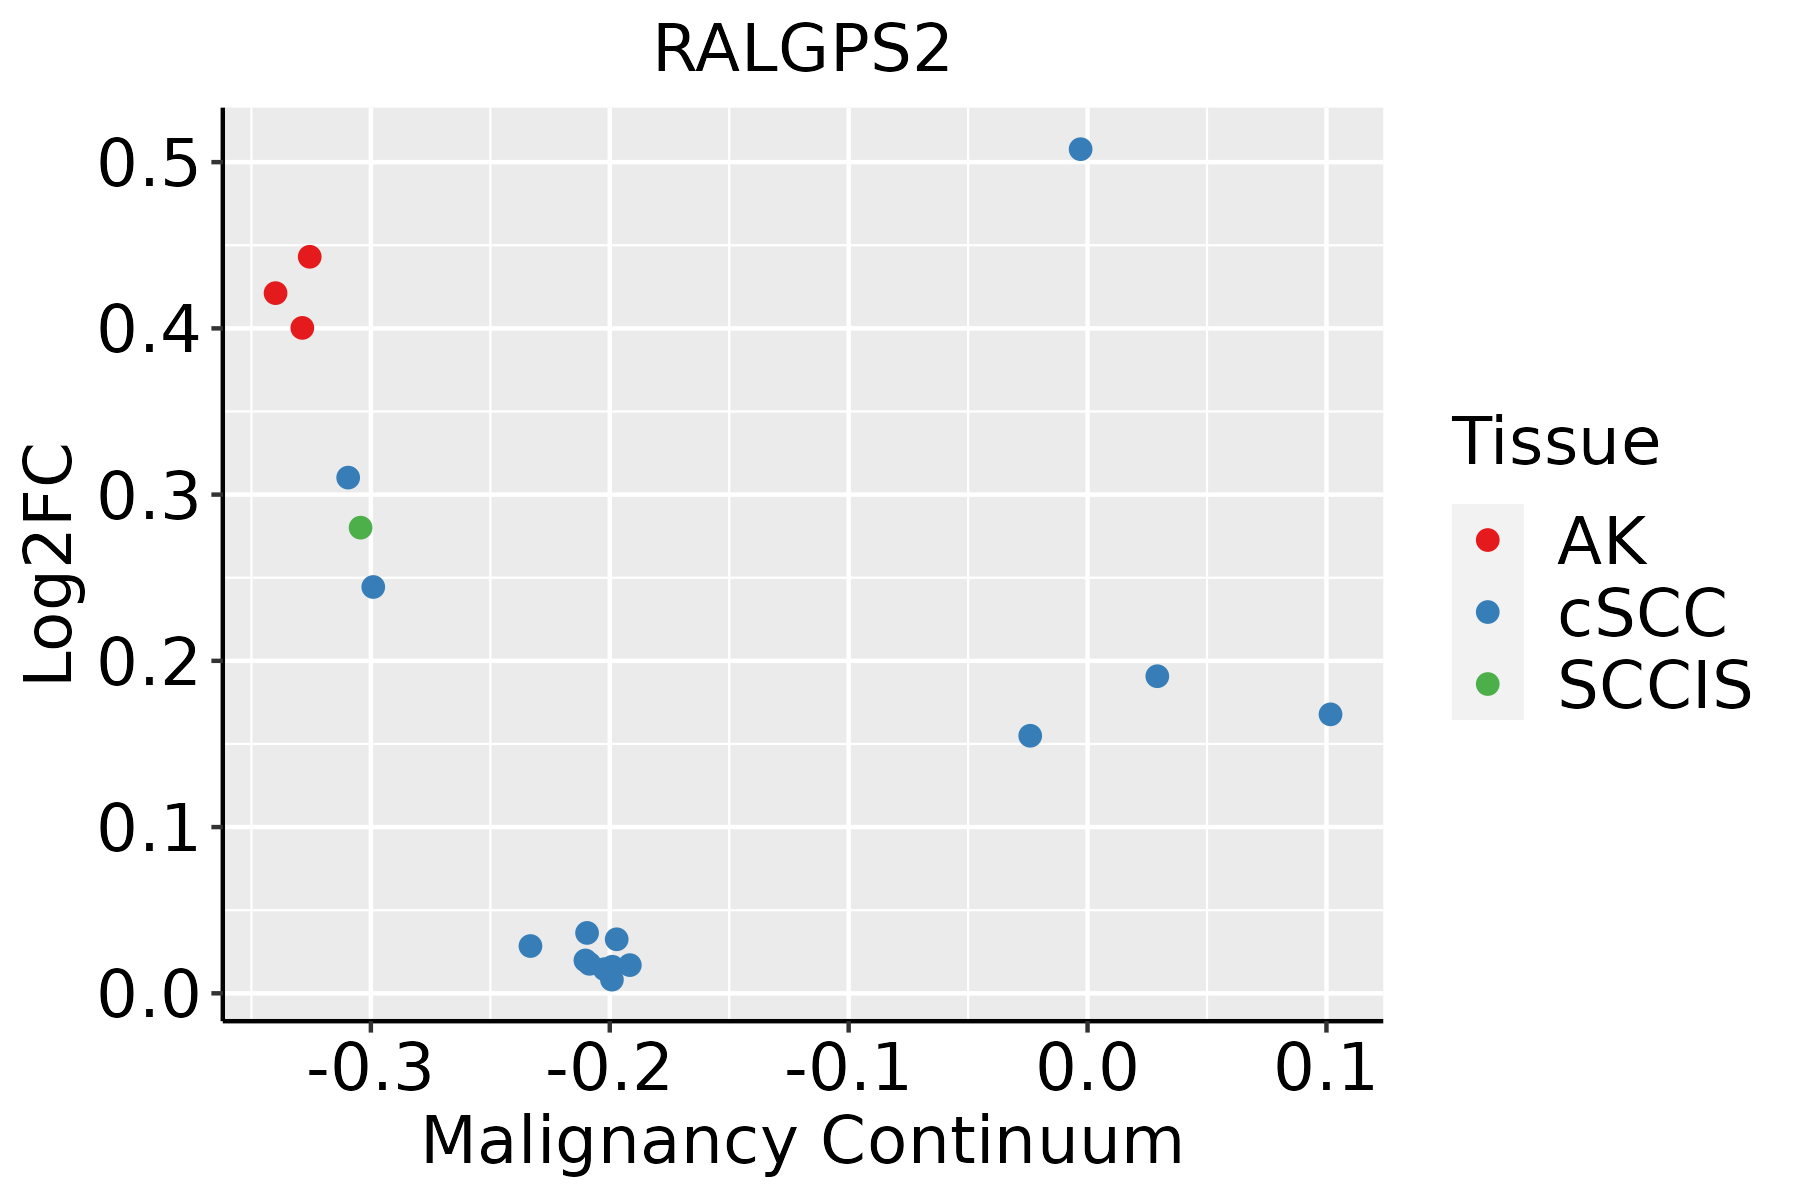
AK: Actinic keratosis
cSCC: Cutaneous squamous cell carcinoma
SCCIS:squamous cell carcinoma in situ
∗log2FC in expression of this searched gene in stem-like cells from each diseased tissue sample relative to stem-like cells in normal samples in each tissue plotted against the malignancy continuum. Samples are colored based on if they are from different disease stage.

Top

Malignant transformation related pathway analysis

check buttonFind out the enriched GO biological processes and KEGG pathways involved in transition from healthy to precancer to cancer
check button Figure of enriched GO biological processes.
TissueDisease StageEnriched GO biological Processes
ColorectumADGO analysis - Figure of enriched GO biological processes: Top 15 enriched GO BP terms are showed in the bar plot of each disease state in each tissue. Each row represents a significant GO biological process which is colored according to the -log10(p.adjust).
ColorectumSERGO analysis - Figure of enriched GO biological processes: Top 15 enriched GO BP terms are showed in the bar plot of each disease state in each tissue. Each row represents a significant GO biological process which is colored according to the -log10(p.adjust).
ColorectumMSSGO analysis - Figure of enriched GO biological processes: Top 15 enriched GO BP terms are showed in the bar plot of each disease state in each tissue. Each row represents a significant GO biological process which is colored according to the -log10(p.adjust).
ColorectumMSI-HGO analysis - Figure of enriched GO biological processes: Top 15 enriched GO BP terms are showed in the bar plot of each disease state in each tissue. Each row represents a significant GO biological process which is colored according to the -log10(p.adjust).
ColorectumFAPGO analysis - Figure of enriched GO biological processes: Top 15 enriched GO BP terms are showed in the bar plot of each disease state in each tissue. Each row represents a significant GO biological process which is colored according to the -log10(p.adjust).
∗Top 15 enriched GO BP terms are showed in the bar plot of each disease state in each tissue. Each row represents a significant GO biological process which is colored according to the -log10(p.adjust).
Page: 1 2 3 4 5 6 7 8 9 

check button Enriched GO biological processes.
GO IDTissueDisease StageDescriptionGene RatioBg Ratiopvaluep.adjustCount
GO:0007265ColorectumADRas protein signal transduction104/3918337/187231.01e-052.35e-04104
GO:0051056ColorectumADregulation of small GTPase mediated signal transduction94/3918302/187231.81e-053.76e-0494
GO:0046578ColorectumADregulation of Ras protein signal transduction56/3918189/187232.85e-032.14e-0256
GO:00072651ColorectumMSSRas protein signal transduction91/3467337/187237.20e-051.21e-0391
GO:00510561ColorectumMSSregulation of small GTPase mediated signal transduction82/3467302/187231.31e-041.99e-0382
GO:00510562ColorectumFAPregulation of small GTPase mediated signal transduction78/2622302/187233.25e-082.85e-0678
GO:00072652ColorectumFAPRas protein signal transduction80/2622337/187239.61e-074.33e-0580
GO:00465781ColorectumFAPregulation of Ras protein signal transduction47/2622189/187234.67e-059.60e-0447
GO:00510563ColorectumCRCregulation of small GTPase mediated signal transduction69/2078302/187233.34e-099.08e-0769
GO:00072653ColorectumCRCRas protein signal transduction70/2078337/187231.49e-071.66e-0570
GO:00465782ColorectumCRCregulation of Ras protein signal transduction43/2078189/187233.26e-061.47e-0443
GO:000726510EsophagusESCCRas protein signal transduction201/8552337/187231.44e-072.30e-06201
GO:00465789EsophagusESCCregulation of Ras protein signal transduction106/8552189/187232.49e-031.08e-02106
GO:005105610EsophagusESCCregulation of small GTPase mediated signal transduction157/8552302/187231.55e-024.98e-02157
GO:00072654LiverNAFLDRas protein signal transduction66/1882337/187238.43e-087.09e-0666
GO:00510564LiverNAFLDregulation of small GTPase mediated signal transduction56/1882302/187234.62e-061.75e-0456
GO:00465783LiverNAFLDregulation of Ras protein signal transduction38/1882189/187232.42e-056.61e-0438
GO:000726511LiverCirrhoticRas protein signal transduction119/4634337/187238.16e-061.22e-04119
GO:000726521LiverHCCRas protein signal transduction187/7958337/187238.89e-071.35e-05187
GO:004657811LiverHCCregulation of Ras protein signal transduction100/7958189/187232.42e-031.18e-02100
Page: 1 2 

check button Enriched KEGG pathways.
Pathway IDTissueDisease StageDescriptionGene RatioBg Ratiopvaluep.adjustqvalueCount
Page: 1 

Top

Cell-cell communication analysis

check buttonIdentification of potential cell-cell interactions between two cell types and their ligand-receptor pairs for different disease states
LigandReceptorLRpairPathwayTissueDisease Stage
Page: 1 

Top

Single-cell gene regulatory network inference analysis

check buttonFind out the significant the regulons (TFs) and the target genes of each regulon across cell types for different disease states
TFCell TypeTissueDisease StageTarget GeneRSSRegulon Activity
∗The dot plots of a searched regulon are shown for all cell subpopulations in each disease state of each tissue based on the regulon specific score inferred using pySCENIC and by calculating the average expression.
Page: 1 

Top

Somatic mutation of malignant transformation related genes

check buttonAnnotation of somatic variants for genes involved in malignant transformation
Hugo SymbolVariant ClassVariant ClassificationdbSNP RSHGVScHGVSpHGVSp ShortSWISSPROTBIOTYPESIFTPolyPhenTumor Sample BarcodeTissueHistologySexAgeStageTherapy TypesDrugsOutcome
RALGPS2SNVMissense_Mutationc.585N>Cp.Met195Ilep.M195IQ86X27protein_codingtolerated(0.05)possibly_damaging(0.471)TCGA-A8-A08R-01Breastbreast invasive carcinomaFemale<65I/IIUnknownUnknownSD
RALGPS2SNVMissense_Mutationrs569583893c.980C>Tp.Pro327Leup.P327LQ86X27protein_codingdeleterious(0.05)benign(0.043)TCGA-E2-A15M-01Breastbreast invasive carcinomaFemale>=65I/IIHormone TherapyarimidexSD
RALGPS2deletionFrame_Shift_Delnovelc.1246delAp.Arg416GlyfsTer11p.R416Gfs*11Q86X27protein_codingTCGA-EW-A2FV-01Breastbreast invasive carcinomaFemale<65III/IVChemotherapydocetaxelSD
RALGPS2SNVMissense_Mutationnovelc.696N>Ap.Met232Ilep.M232IQ86X27protein_codingdeleterious(0.02)possibly_damaging(0.719)TCGA-C5-A8YQ-01Cervixcervical & endocervical cancerFemale>=65I/IIChemotherapycisplatinPD
RALGPS2SNVMissense_Mutationc.641N>Tp.Ser214Leup.S214LQ86X27protein_codingtolerated(0.36)benign(0.09)TCGA-DS-A0VN-01Cervixcervical & endocervical cancerFemale<65I/IIChemotherapycisplatinSD
RALGPS2SNVMissense_Mutationrs748539541c.130G>Ap.Asp44Asnp.D44NQ86X27protein_codingtolerated(0.06)possibly_damaging(0.694)TCGA-FU-A3HZ-01Cervixcervical & endocervical cancerFemale<65I/IIChemotherapycisplatinCR
RALGPS2SNVMissense_Mutationrs762927733c.1637C>Tp.Ser546Leup.S546LQ86X27protein_codingdeleterious(0.03)benign(0.07)TCGA-FU-A3HZ-01Cervixcervical & endocervical cancerFemale<65I/IIChemotherapycisplatinCR
RALGPS2SNVMissense_Mutationc.244N>Cp.Glu82Glnp.E82QQ86X27protein_codingdeleterious(0.01)probably_damaging(0.963)TCGA-IR-A3LH-01Cervixcervical & endocervical cancerFemale<65I/IIChemotherapycisplatinCR
RALGPS2SNVMissense_Mutationc.1159N>Ap.Glu387Lysp.E387KQ86X27protein_codingtolerated(0.77)benign(0.13)TCGA-IR-A3LI-01Cervixcervical & endocervical cancerFemale<65I/IIChemotherapycisplatinCR
RALGPS2SNVMissense_Mutationrs762927733c.1637N>Tp.Ser546Leup.S546LQ86X27protein_codingdeleterious(0.03)benign(0.07)TCGA-AA-A010-01Colorectumcolon adenocarcinomaFemale<65I/IIChemotherapyfolinicCR
Page: 1 2 3 4 5 6 7 

Top

Related drugs of malignant transformation related genes

check buttonIdentification of chemicals and drugs interact with genes involved in malignant transfromation
(DGIdb 4.0)
Entrez IDSymbolCategoryInteraction TypesDrug Claim NameDrug NamePMIDs
Page: 1