
|
|||||
|
 | |
| |
| |
| |
| |
| |
|
Gene: RALGDS |
Gene summary for RALGDS |
| Gene information | Species | Human | Gene symbol | RALGDS | Gene ID | 5900 |
| Gene name | ral guanine nucleotide dissociation stimulator | |
| Gene Alias | RGDS | |
| Cytomap | 9q34.13-q34.2 | |
| Gene Type | protein-coding | GO ID | GO:0007154 | UniProtAcc | Q12967 |
Top |
Malignant transformation analysis |
| Identification of the aberrant gene expression in precancerous and cancerous lesions by comparing the gene expression of stem-like cells in diseased tissues with normal stem cells |
| Entrez ID | Symbol | Replicates | Species | Organ | Tissue | Adj P-value | Log2FC | Malignancy |
| 5900 | RALGDS | HTA11_2487_2000001011 | Human | Colorectum | SER | 6.37e-04 | 2.42e-01 | -0.1808 |
| 5900 | RALGDS | HTA11_347_2000001011 | Human | Colorectum | AD | 2.67e-10 | 3.76e-01 | -0.1954 |
| 5900 | RALGDS | HTA11_696_2000001011 | Human | Colorectum | AD | 1.15e-05 | 3.39e-01 | -0.1464 |
| 5900 | RALGDS | HTA11_866_2000001011 | Human | Colorectum | AD | 1.09e-03 | 2.20e-01 | -0.1001 |
| 5900 | RALGDS | HTA11_1391_2000001011 | Human | Colorectum | AD | 1.95e-10 | 4.52e-01 | -0.059 |
| 5900 | RALGDS | HTA11_866_3004761011 | Human | Colorectum | AD | 5.29e-06 | 3.88e-01 | 0.096 |
| 5900 | RALGDS | HTA11_7696_3000711011 | Human | Colorectum | AD | 8.20e-07 | 3.50e-01 | 0.0674 |
| 5900 | RALGDS | HTA11_6818_2000001021 | Human | Colorectum | AD | 7.15e-05 | 4.07e-01 | 0.0588 |
| 5900 | RALGDS | HTA11_99999970781_79442 | Human | Colorectum | MSS | 7.10e-13 | 4.56e-01 | 0.294 |
| 5900 | RALGDS | HTA11_99999965104_69814 | Human | Colorectum | MSS | 1.01e-04 | 4.07e-01 | 0.281 |
| 5900 | RALGDS | HTA11_99999971662_82457 | Human | Colorectum | MSS | 2.09e-22 | 7.31e-01 | 0.3859 |
| 5900 | RALGDS | HTA11_99999973899_84307 | Human | Colorectum | MSS | 2.69e-06 | 5.79e-01 | 0.2585 |
| 5900 | RALGDS | HTA11_99999974143_84620 | Human | Colorectum | MSS | 1.84e-12 | 3.67e-01 | 0.3005 |
| 5900 | RALGDS | A002-C-116 | Human | Colorectum | FAP | 8.13e-03 | -1.18e-01 | -0.0452 |
| 5900 | RALGDS | LZE4T | Human | Esophagus | ESCC | 1.13e-06 | -3.27e-02 | 0.0811 |
| 5900 | RALGDS | LZE7T | Human | Esophagus | ESCC | 9.34e-06 | 1.32e-01 | 0.0667 |
| 5900 | RALGDS | LZE8T | Human | Esophagus | ESCC | 3.85e-04 | 2.43e-01 | 0.067 |
| 5900 | RALGDS | LZE20T | Human | Esophagus | ESCC | 4.87e-07 | 3.08e-02 | 0.0662 |
| 5900 | RALGDS | LZE24T | Human | Esophagus | ESCC | 4.64e-07 | 2.80e-01 | 0.0596 |
| 5900 | RALGDS | LZE21T | Human | Esophagus | ESCC | 4.55e-04 | 2.80e-01 | 0.0655 |
| Page: 1 2 3 4 5 6 |
| Tissue | Expression Dynamics | Abbreviation |
| Colorectum (GSE201348) |  | FAP: Familial adenomatous polyposis |
| CRC: Colorectal cancer | ||
| Colorectum (HTA11) |  | AD: Adenomas |
| SER: Sessile serrated lesions | ||
| MSI-H: Microsatellite-high colorectal cancer | ||
| MSS: Microsatellite stable colorectal cancer | ||
| Esophagus |  | ESCC: Esophageal squamous cell carcinoma |
| HGIN: High-grade intraepithelial neoplasias | ||
| LGIN: Low-grade intraepithelial neoplasias | ||
| Oral Cavity | 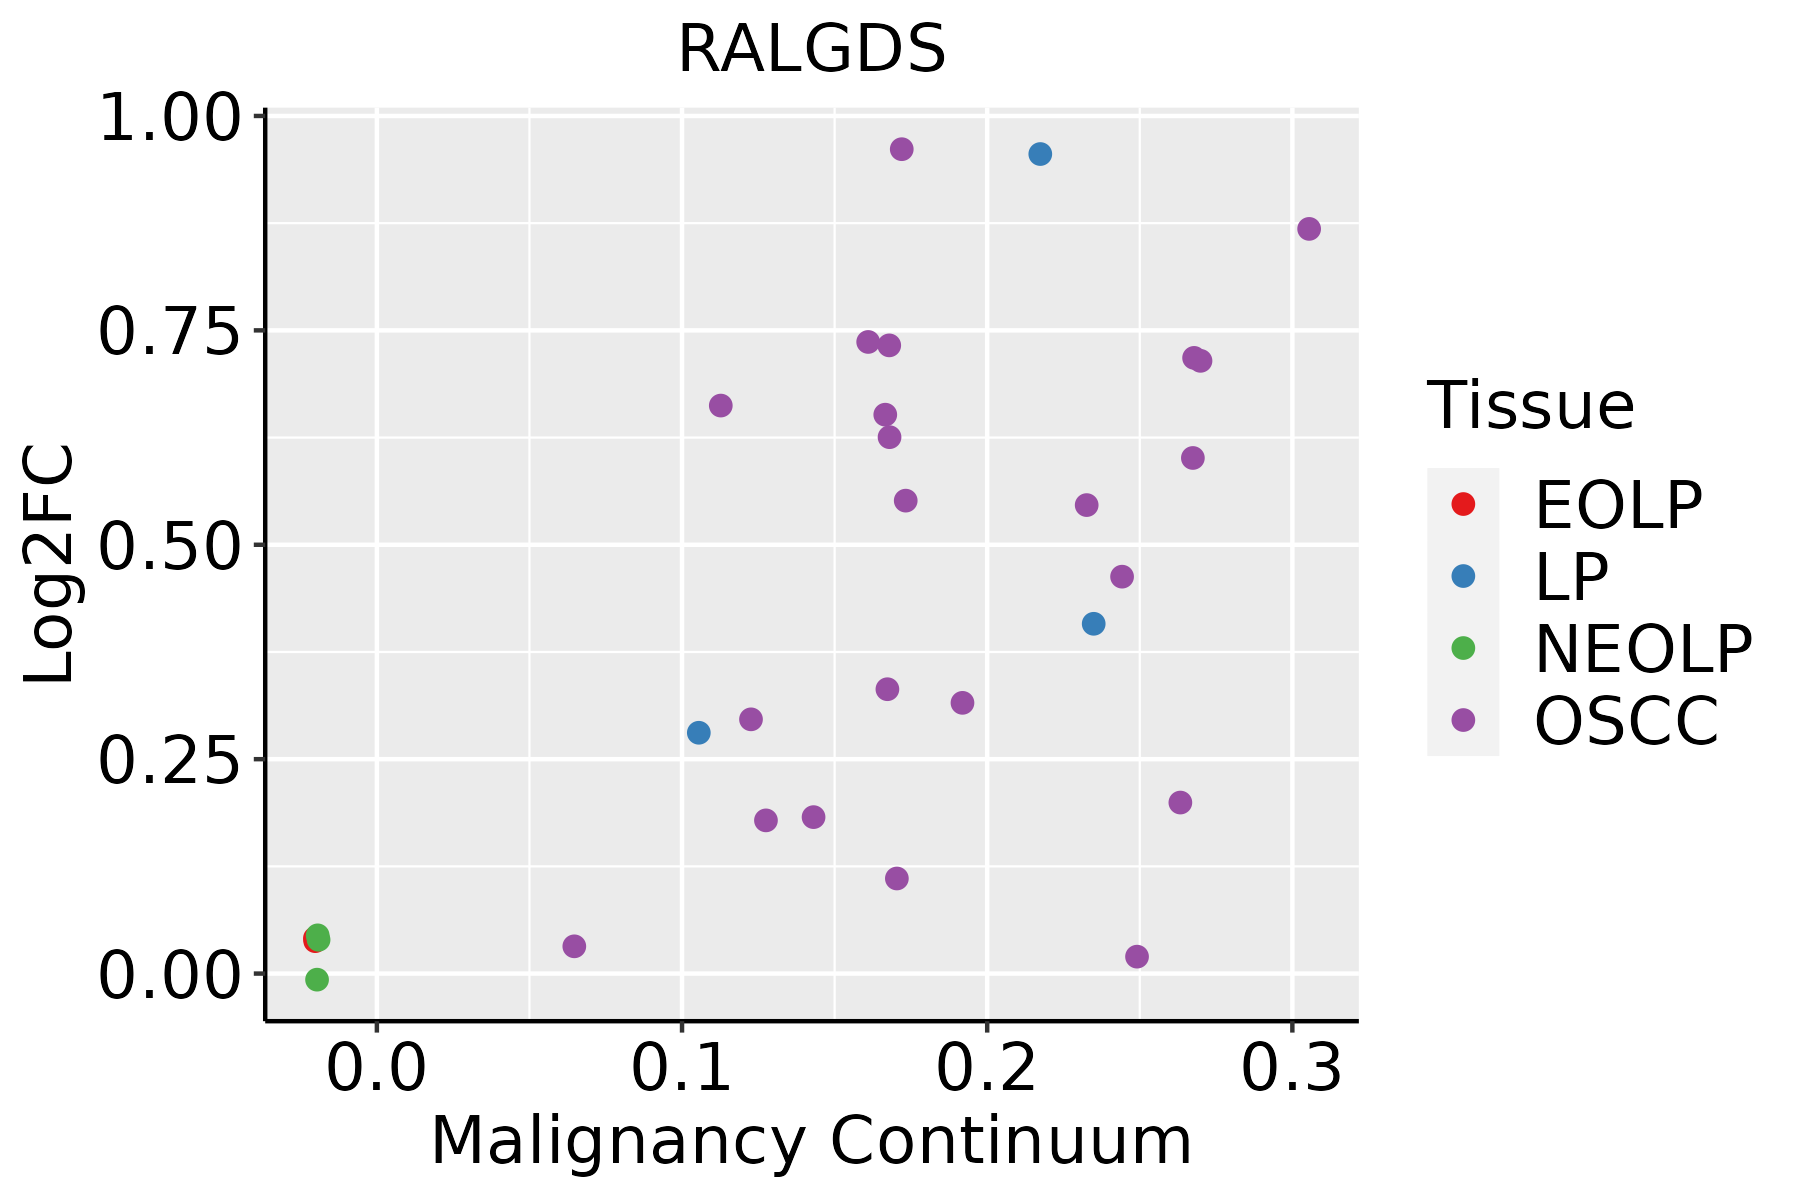 | EOLP: Erosive Oral lichen planus |
| LP: leukoplakia | ||
| NEOLP: Non-erosive oral lichen planus | ||
| OSCC: Oral squamous cell carcinoma | ||
| Skin | 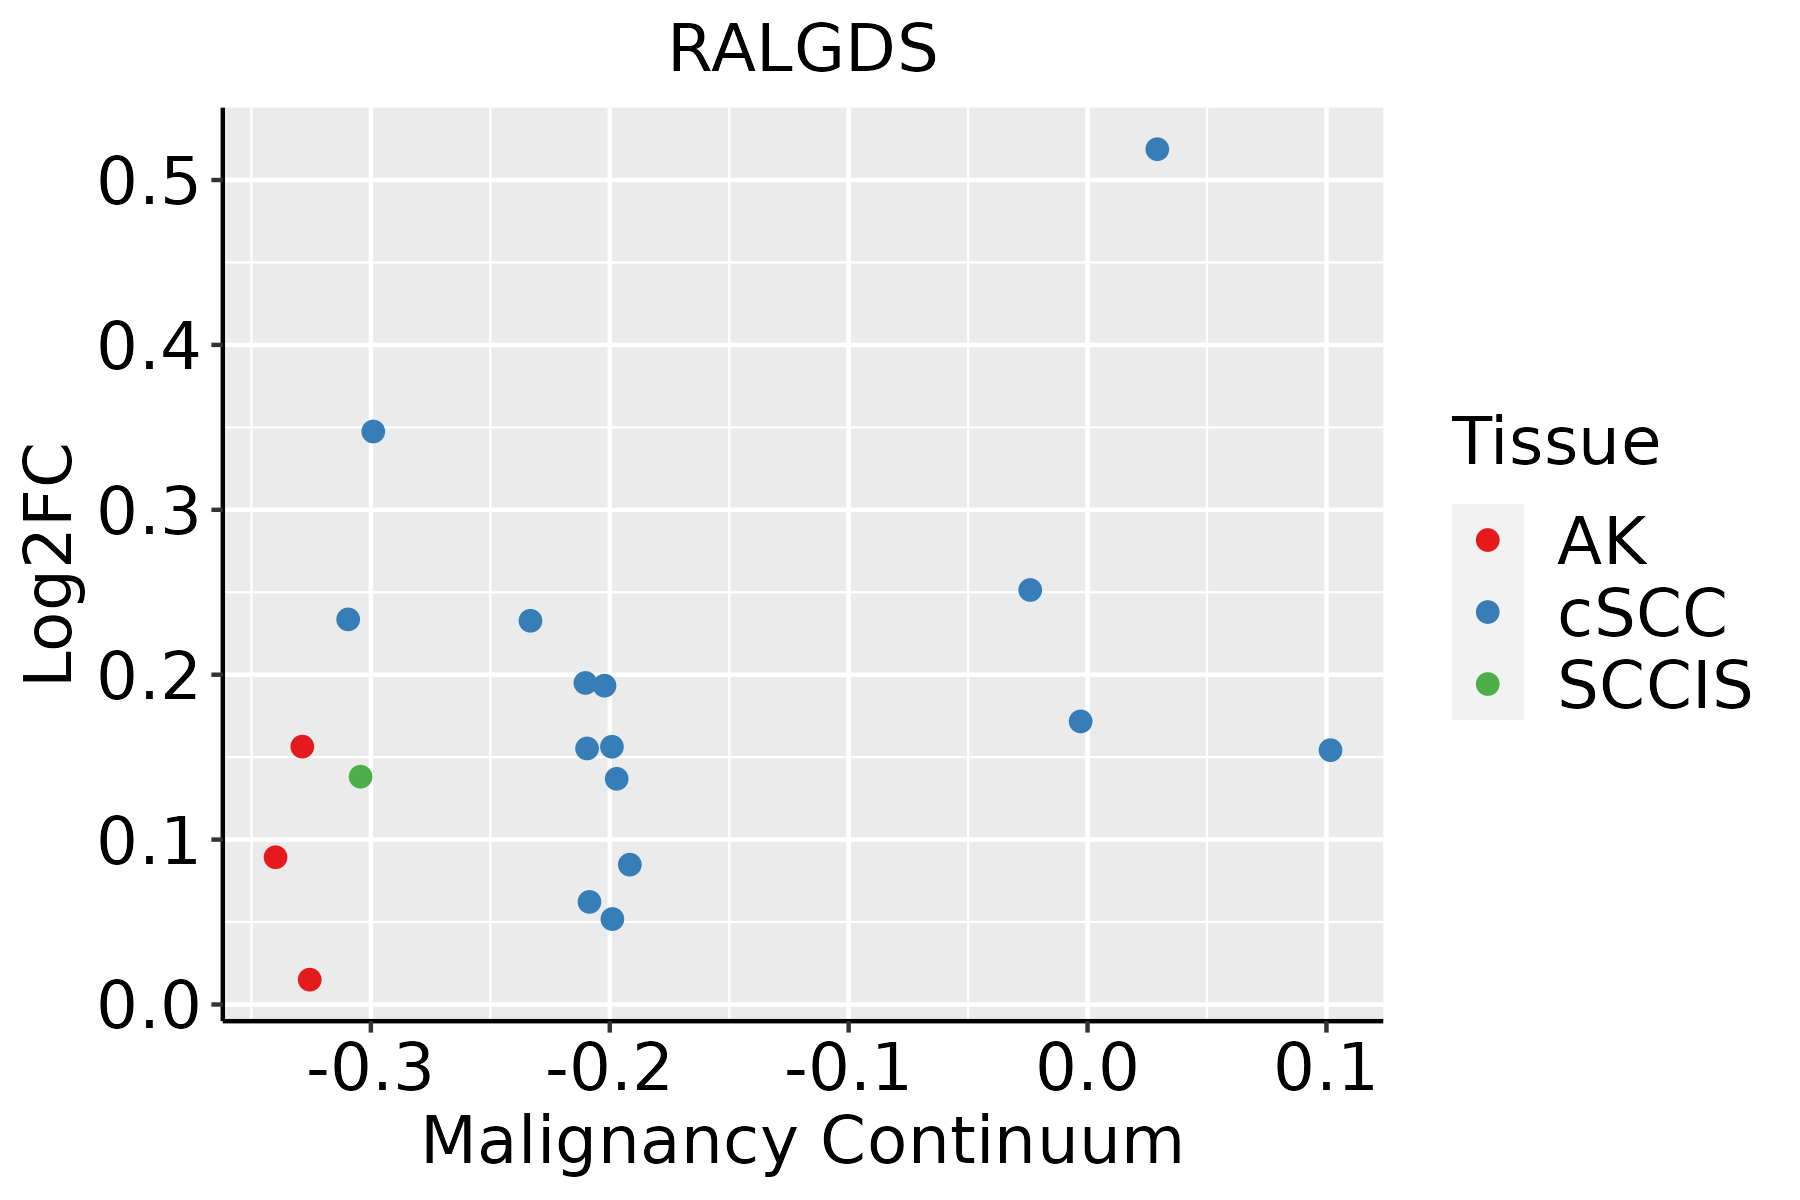 | AK: Actinic keratosis |
| cSCC: Cutaneous squamous cell carcinoma | ||
| SCCIS:squamous cell carcinoma in situ | ||
| Thyroid | 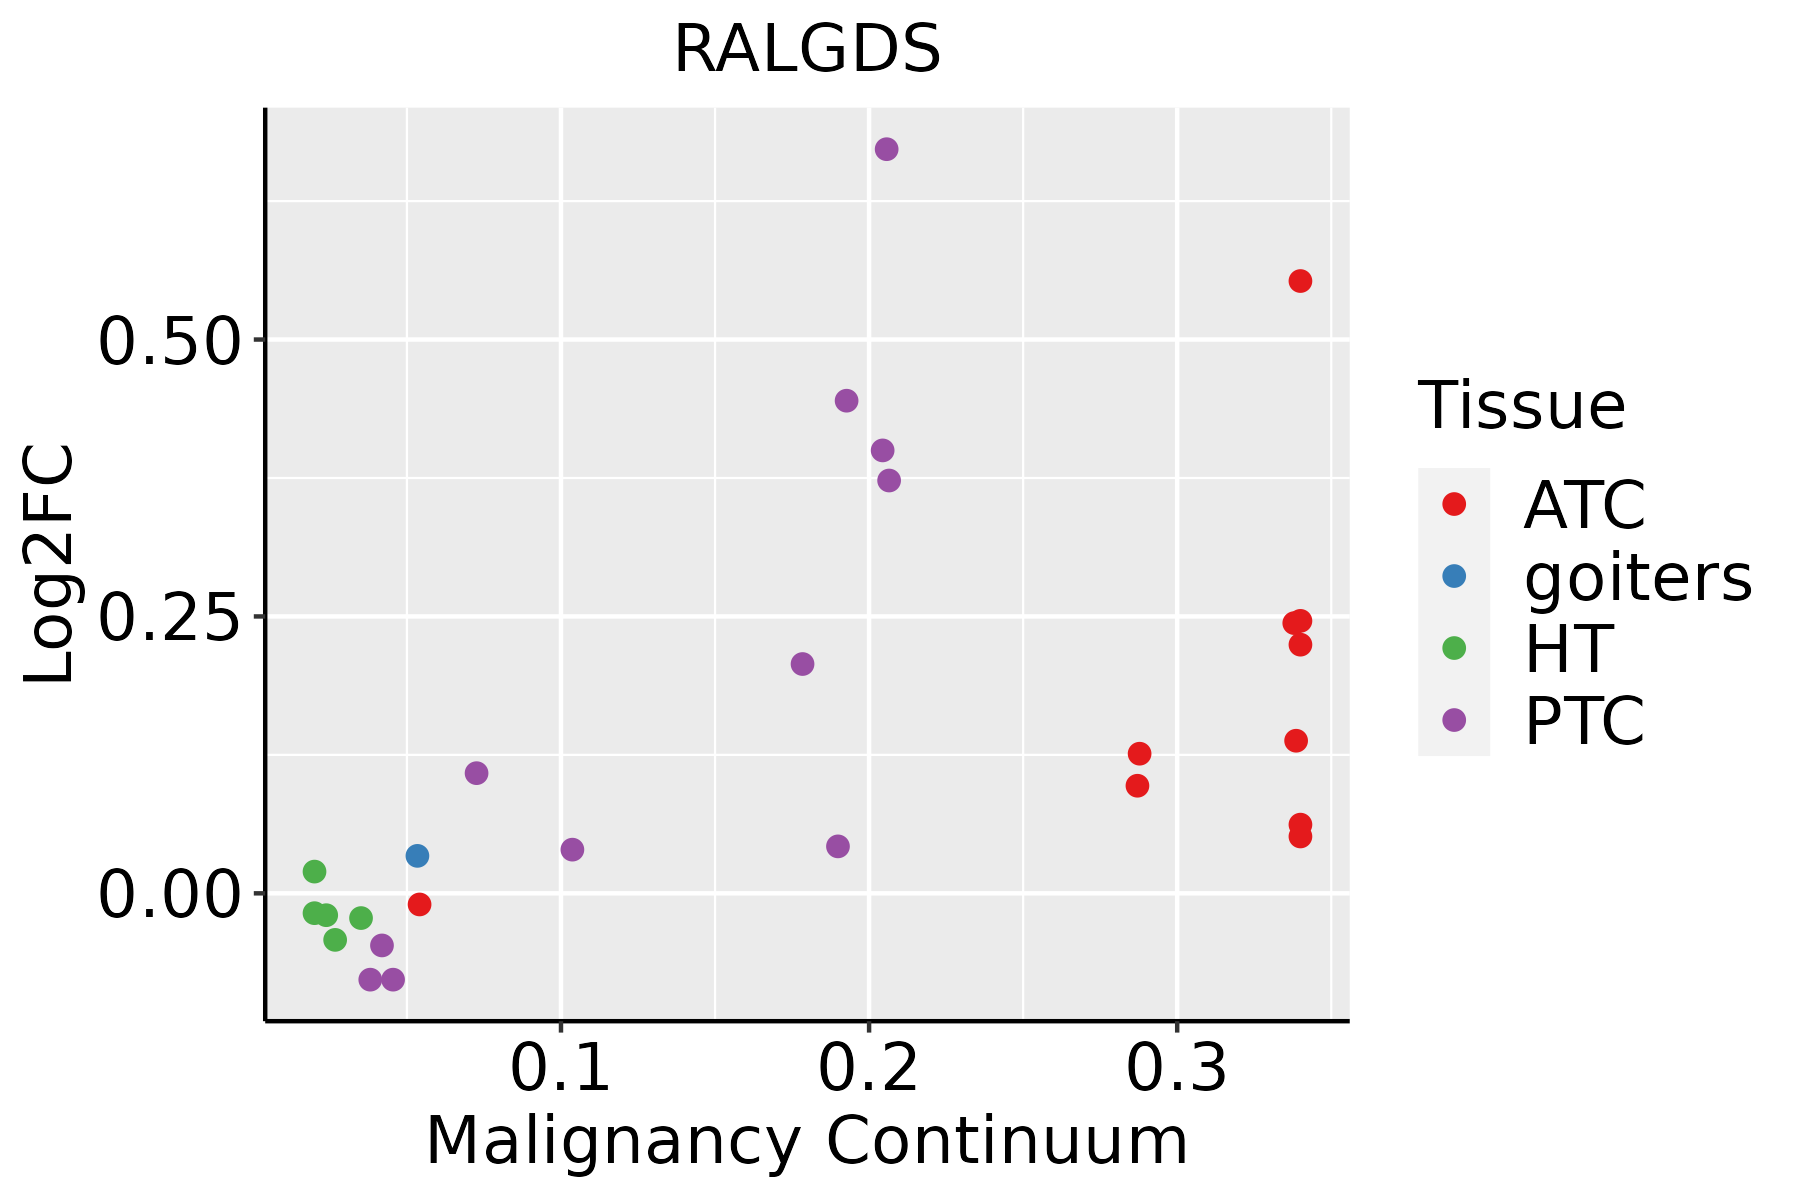 | ATC: Anaplastic thyroid cancer |
| HT: Hashimoto's thyroiditis | ||
| PTC: Papillary thyroid cancer |
| ∗log2FC in expression of this searched gene in stem-like cells from each diseased tissue sample relative to stem-like cells in normal samples in each tissue plotted against the malignancy continuum. Samples are colored based on if they are from different disease stage. |
Top |
Malignant transformation related pathway analysis |
| Find out the enriched GO biological processes and KEGG pathways involved in transition from healthy to precancer to cancer |
| Tissue | Disease Stage | Enriched GO biological Processes |
| Colorectum | AD |  |
| Colorectum | SER |  |
| Colorectum | MSS |  |
| Colorectum | MSI-H |  |
| Colorectum | FAP |  |
| ∗Top 15 enriched GO BP terms are showed in the bar plot of each disease state in each tissue. Each row represents a significant GO biological process which is colored according to the -log10(p.adjust). |
| Page: 1 2 3 4 5 6 7 8 9 |
| GO ID | Tissue | Disease Stage | Description | Gene Ratio | Bg Ratio | pvalue | p.adjust | Count |
| Page: 1 |
| Pathway ID | Tissue | Disease Stage | Description | Gene Ratio | Bg Ratio | pvalue | p.adjust | qvalue | Count |
| hsa05210 | Colorectum | AD | Colorectal cancer | 35/2092 | 86/8465 | 7.54e-04 | 5.49e-03 | 3.50e-03 | 35 |
| hsa04015 | Colorectum | AD | Rap1 signaling pathway | 71/2092 | 210/8465 | 1.72e-03 | 9.68e-03 | 6.18e-03 | 71 |
| hsa05212 | Colorectum | AD | Pancreatic cancer | 29/2092 | 76/8465 | 6.25e-03 | 2.68e-02 | 1.71e-02 | 29 |
| hsa052101 | Colorectum | AD | Colorectal cancer | 35/2092 | 86/8465 | 7.54e-04 | 5.49e-03 | 3.50e-03 | 35 |
| hsa040151 | Colorectum | AD | Rap1 signaling pathway | 71/2092 | 210/8465 | 1.72e-03 | 9.68e-03 | 6.18e-03 | 71 |
| hsa052121 | Colorectum | AD | Pancreatic cancer | 29/2092 | 76/8465 | 6.25e-03 | 2.68e-02 | 1.71e-02 | 29 |
| hsa040152 | Colorectum | SER | Rap1 signaling pathway | 54/1580 | 210/8465 | 6.55e-03 | 3.68e-02 | 2.67e-02 | 54 |
| hsa040153 | Colorectum | SER | Rap1 signaling pathway | 54/1580 | 210/8465 | 6.55e-03 | 3.68e-02 | 2.67e-02 | 54 |
| hsa052102 | Colorectum | MSS | Colorectal cancer | 36/1875 | 86/8465 | 3.08e-05 | 3.22e-04 | 1.97e-04 | 36 |
| hsa040154 | Colorectum | MSS | Rap1 signaling pathway | 66/1875 | 210/8465 | 1.03e-03 | 5.94e-03 | 3.64e-03 | 66 |
| hsa05231 | Colorectum | MSS | Choline metabolism in cancer | 34/1875 | 98/8465 | 2.90e-03 | 1.39e-02 | 8.50e-03 | 34 |
| hsa052122 | Colorectum | MSS | Pancreatic cancer | 26/1875 | 76/8465 | 1.04e-02 | 3.69e-02 | 2.26e-02 | 26 |
| hsa052103 | Colorectum | MSS | Colorectal cancer | 36/1875 | 86/8465 | 3.08e-05 | 3.22e-04 | 1.97e-04 | 36 |
| hsa040155 | Colorectum | MSS | Rap1 signaling pathway | 66/1875 | 210/8465 | 1.03e-03 | 5.94e-03 | 3.64e-03 | 66 |
| hsa052311 | Colorectum | MSS | Choline metabolism in cancer | 34/1875 | 98/8465 | 2.90e-03 | 1.39e-02 | 8.50e-03 | 34 |
| hsa052123 | Colorectum | MSS | Pancreatic cancer | 26/1875 | 76/8465 | 1.04e-02 | 3.69e-02 | 2.26e-02 | 26 |
| hsa040156 | Colorectum | FAP | Rap1 signaling pathway | 53/1404 | 210/8465 | 7.93e-04 | 5.14e-03 | 3.13e-03 | 53 |
| hsa040157 | Colorectum | FAP | Rap1 signaling pathway | 53/1404 | 210/8465 | 7.93e-04 | 5.14e-03 | 3.13e-03 | 53 |
| hsa0521020 | Esophagus | ESCC | Colorectal cancer | 69/4205 | 86/8465 | 4.06e-09 | 4.13e-08 | 2.11e-08 | 69 |
| hsa0521216 | Esophagus | ESCC | Pancreatic cancer | 62/4205 | 76/8465 | 7.37e-09 | 6.85e-08 | 3.51e-08 | 62 |
| Page: 1 2 |
Top |
Cell-cell communication analysis |
| Identification of potential cell-cell interactions between two cell types and their ligand-receptor pairs for different disease states |
| Ligand | Receptor | LRpair | Pathway | Tissue | Disease Stage |
| Page: 1 |
Top |
Single-cell gene regulatory network inference analysis |
| Find out the significant the regulons (TFs) and the target genes of each regulon across cell types for different disease states |
| TF | Cell Type | Tissue | Disease Stage | Target Gene | RSS | Regulon Activity |
| ∗The dot plots of a searched regulon are shown for all cell subpopulations in each disease state of each tissue based on the regulon specific score inferred using pySCENIC and by calculating the average expression. |
| Page: 1 |
Top |
Somatic mutation of malignant transformation related genes |
| Annotation of somatic variants for genes involved in malignant transformation |
| Hugo Symbol | Variant Class | Variant Classification | dbSNP RS | HGVSc | HGVSp | HGVSp Short | SWISSPROT | BIOTYPE | SIFT | PolyPhen | Tumor Sample Barcode | Tissue | Histology | Sex | Age | Stage | Therapy Types | Drugs | Outcome |
| RALGDS | SNV | Missense_Mutation | novel | c.2011N>T | p.Arg671Cys | p.R671C | Q12967 | protein_coding | tolerated(0.14) | probably_damaging(0.983) | TCGA-AC-A6IW-01 | Breast | breast invasive carcinoma | Female | >=65 | I/II | Unknown | Unknown | SD |
| RALGDS | SNV | Missense_Mutation | novel | c.2242N>A | p.Glu748Lys | p.E748K | Q12967 | protein_coding | tolerated(0.42) | benign(0.074) | TCGA-BH-A2L8-01 | Breast | breast invasive carcinoma | Female | <65 | I/II | Chemotherapy | cytoxan | CR |
| RALGDS | SNV | Missense_Mutation | novel | c.2281N>C | p.Ser761Pro | p.S761P | Q12967 | protein_coding | deleterious(0.04) | probably_damaging(0.96) | TCGA-C8-A275-01 | Breast | breast invasive carcinoma | Female | <65 | I/II | Unknown | Unknown | SD |
| RALGDS | SNV | Missense_Mutation | c.1909N>A | p.Glu637Lys | p.E637K | Q12967 | protein_coding | deleterious(0) | probably_damaging(0.982) | TCGA-D8-A1JA-01 | Breast | breast invasive carcinoma | Female | <65 | III/IV | Chemotherapy | adriamycin | PD | |
| RALGDS | SNV | Missense_Mutation | c.1209N>C | p.Lys403Asn | p.K403N | Q12967 | protein_coding | deleterious(0) | probably_damaging(0.994) | TCGA-GM-A2DH-01 | Breast | breast invasive carcinoma | Female | <65 | I/II | Chemotherapy | taxol | CR | |
| RALGDS | SNV | Missense_Mutation | novel | c.2344C>A | p.Leu782Ile | p.L782I | Q12967 | protein_coding | tolerated(0.3) | benign(0.007) | TCGA-S3-AA10-01 | Breast | breast invasive carcinoma | Female | >=65 | I/II | Chemotherapy | cytoxan | CR |
| RALGDS | deletion | Frame_Shift_Del | novel | c.1433delN | p.Asn478ThrfsTer20 | p.N478Tfs*20 | Q12967 | protein_coding | TCGA-D8-A27V-01 | Breast | breast invasive carcinoma | Female | <65 | I/II | Hormone Therapy | tamoxiphen | SD | ||
| RALGDS | deletion | Frame_Shift_Del | novel | c.885delA | p.Ala296LeufsTer10 | p.A296Lfs*10 | Q12967 | protein_coding | TCGA-EW-A2FV-01 | Breast | breast invasive carcinoma | Female | <65 | III/IV | Chemotherapy | docetaxel | SD | ||
| RALGDS | SNV | Missense_Mutation | rs374152758 | c.706N>A | p.Asp236Asn | p.D236N | Q12967 | protein_coding | deleterious(0.01) | benign(0.007) | TCGA-Q1-A5R2-01 | Cervix | cervical & endocervical cancer | Female | <65 | I/II | Chemotherapy | cisplatin | PR |
| RALGDS | SNV | Missense_Mutation | c.376G>C | p.Glu126Gln | p.E126Q | Q12967 | protein_coding | deleterious(0) | possibly_damaging(0.824) | TCGA-Q1-A73O-01 | Cervix | cervical & endocervical cancer | Female | <65 | I/II | Chemotherapy | cisplatin | CR |
| Page: 1 2 3 4 5 6 7 8 9 |
Top |
Related drugs of malignant transformation related genes |
| Identification of chemicals and drugs interact with genes involved in malignant transfromation |
| (DGIdb 4.0) |
| Entrez ID | Symbol | Category | Interaction Types | Drug Claim Name | Drug Name | PMIDs |
| Page: 1 |

Copyright 2023-Present -The University of Texas Health Science Center at Houston |