
|
|||||
|
 | |
| |
| |
| |
| |
| |
|
Gene: RALGAPB |
Gene summary for RALGAPB |
| Gene information | Species | Human | Gene symbol | RALGAPB | Gene ID | 57148 |
| Gene name | Ral GTPase activating protein non-catalytic subunit beta | |
| Gene Alias | KIAA1219 | |
| Cytomap | 20q11.23 | |
| Gene Type | protein-coding | GO ID | GO:0007154 | UniProtAcc | Q6MZJ2 |
Top |
Malignant transformation analysis |
| Identification of the aberrant gene expression in precancerous and cancerous lesions by comparing the gene expression of stem-like cells in diseased tissues with normal stem cells |
| Entrez ID | Symbol | Replicates | Species | Organ | Tissue | Adj P-value | Log2FC | Malignancy |
| 57148 | RALGAPB | LZE4T | Human | Esophagus | ESCC | 2.49e-06 | 1.96e-01 | 0.0811 |
| 57148 | RALGAPB | LZE5T | Human | Esophagus | ESCC | 1.35e-02 | 2.52e-01 | 0.0514 |
| 57148 | RALGAPB | LZE7T | Human | Esophagus | ESCC | 1.71e-05 | 2.99e-01 | 0.0667 |
| 57148 | RALGAPB | LZE8T | Human | Esophagus | ESCC | 5.09e-03 | 4.89e-02 | 0.067 |
| 57148 | RALGAPB | LZE20T | Human | Esophagus | ESCC | 6.06e-04 | 1.56e-01 | 0.0662 |
| 57148 | RALGAPB | LZE24T | Human | Esophagus | ESCC | 3.74e-22 | 6.15e-01 | 0.0596 |
| 57148 | RALGAPB | P1T-E | Human | Esophagus | ESCC | 4.37e-09 | 3.47e-01 | 0.0875 |
| 57148 | RALGAPB | P2T-E | Human | Esophagus | ESCC | 1.70e-20 | 2.87e-01 | 0.1177 |
| 57148 | RALGAPB | P4T-E | Human | Esophagus | ESCC | 1.75e-09 | 2.26e-01 | 0.1323 |
| 57148 | RALGAPB | P5T-E | Human | Esophagus | ESCC | 1.88e-19 | 1.16e-01 | 0.1327 |
| 57148 | RALGAPB | P8T-E | Human | Esophagus | ESCC | 3.41e-18 | 3.39e-01 | 0.0889 |
| 57148 | RALGAPB | P9T-E | Human | Esophagus | ESCC | 1.30e-08 | 1.05e-01 | 0.1131 |
| 57148 | RALGAPB | P10T-E | Human | Esophagus | ESCC | 1.67e-24 | 3.90e-01 | 0.116 |
| 57148 | RALGAPB | P11T-E | Human | Esophagus | ESCC | 1.94e-14 | 3.69e-01 | 0.1426 |
| 57148 | RALGAPB | P12T-E | Human | Esophagus | ESCC | 1.74e-18 | 3.92e-01 | 0.1122 |
| 57148 | RALGAPB | P15T-E | Human | Esophagus | ESCC | 1.16e-21 | 4.69e-01 | 0.1149 |
| 57148 | RALGAPB | P16T-E | Human | Esophagus | ESCC | 2.78e-19 | 3.62e-01 | 0.1153 |
| 57148 | RALGAPB | P17T-E | Human | Esophagus | ESCC | 1.61e-02 | 1.38e-01 | 0.1278 |
| 57148 | RALGAPB | P20T-E | Human | Esophagus | ESCC | 7.94e-12 | 2.41e-01 | 0.1124 |
| 57148 | RALGAPB | P21T-E | Human | Esophagus | ESCC | 1.72e-19 | 3.35e-01 | 0.1617 |
| Page: 1 2 3 4 5 |
| Tissue | Expression Dynamics | Abbreviation |
| Esophagus |  | ESCC: Esophageal squamous cell carcinoma |
| HGIN: High-grade intraepithelial neoplasias | ||
| LGIN: Low-grade intraepithelial neoplasias | ||
| Liver | 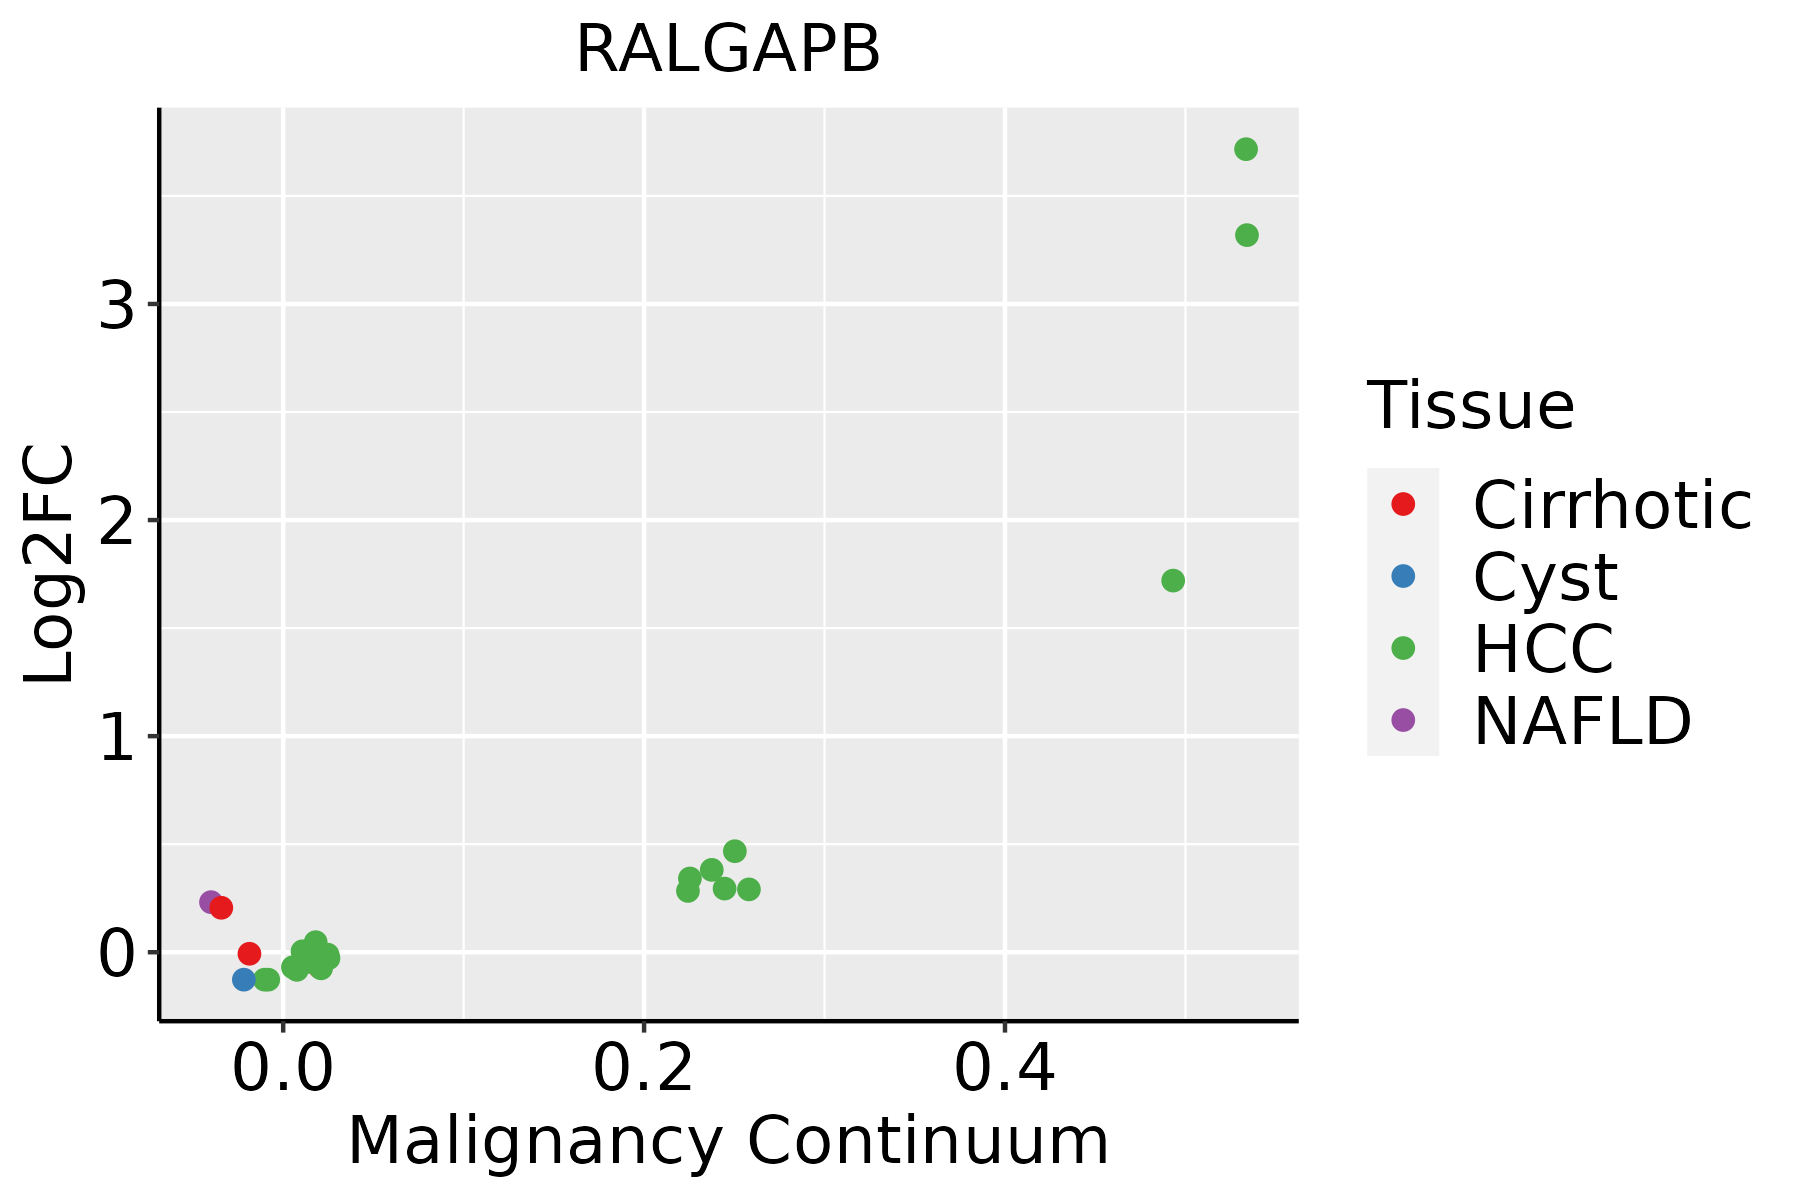 | HCC: Hepatocellular carcinoma |
| NAFLD: Non-alcoholic fatty liver disease | ||
| Thyroid |  | ATC: Anaplastic thyroid cancer |
| HT: Hashimoto's thyroiditis | ||
| PTC: Papillary thyroid cancer |
| ∗log2FC in expression of this searched gene in stem-like cells from each diseased tissue sample relative to stem-like cells in normal samples in each tissue plotted against the malignancy continuum. Samples are colored based on if they are from different disease stage. |
Top |
Malignant transformation related pathway analysis |
| Find out the enriched GO biological processes and KEGG pathways involved in transition from healthy to precancer to cancer |
| Tissue | Disease Stage | Enriched GO biological Processes |
| Colorectum | AD |  |
| Colorectum | SER |  |
| Colorectum | MSS |  |
| Colorectum | MSI-H |  |
| Colorectum | FAP |  |
| ∗Top 15 enriched GO BP terms are showed in the bar plot of each disease state in each tissue. Each row represents a significant GO biological process which is colored according to the -log10(p.adjust). |
| Page: 1 2 3 4 5 6 7 8 9 |
| GO ID | Tissue | Disease Stage | Description | Gene Ratio | Bg Ratio | pvalue | p.adjust | Count |
| GO:004308715 | Esophagus | ESCC | regulation of GTPase activity | 183/8552 | 348/18723 | 5.34e-03 | 2.00e-02 | 183 |
| GO:005105610 | Esophagus | ESCC | regulation of small GTPase mediated signal transduction | 157/8552 | 302/18723 | 1.55e-02 | 4.98e-02 | 157 |
| GO:005105617 | Thyroid | PTC | regulation of small GTPase mediated signal transduction | 132/5968 | 302/18723 | 9.26e-06 | 1.04e-04 | 132 |
| GO:004308718 | Thyroid | PTC | regulation of GTPase activity | 148/5968 | 348/18723 | 1.63e-05 | 1.71e-04 | 148 |
| GO:004354714 | Thyroid | PTC | positive regulation of GTPase activity | 103/5968 | 255/18723 | 2.38e-03 | 1.25e-02 | 103 |
| GO:005105618 | Thyroid | ATC | regulation of small GTPase mediated signal transduction | 141/6293 | 302/18723 | 1.43e-06 | 1.77e-05 | 141 |
| GO:004308719 | Thyroid | ATC | regulation of GTPase activity | 153/6293 | 348/18723 | 3.24e-05 | 2.68e-04 | 153 |
| GO:004354715 | Thyroid | ATC | positive regulation of GTPase activity | 106/6293 | 255/18723 | 4.58e-03 | 1.89e-02 | 106 |
| Page: 1 |
| Pathway ID | Tissue | Disease Stage | Description | Gene Ratio | Bg Ratio | pvalue | p.adjust | qvalue | Count |
| Page: 1 |
Top |
Cell-cell communication analysis |
| Identification of potential cell-cell interactions between two cell types and their ligand-receptor pairs for different disease states |
| Ligand | Receptor | LRpair | Pathway | Tissue | Disease Stage |
| Page: 1 |
Top |
Single-cell gene regulatory network inference analysis |
| Find out the significant the regulons (TFs) and the target genes of each regulon across cell types for different disease states |
| TF | Cell Type | Tissue | Disease Stage | Target Gene | RSS | Regulon Activity |
| ∗The dot plots of a searched regulon are shown for all cell subpopulations in each disease state of each tissue based on the regulon specific score inferred using pySCENIC and by calculating the average expression. |
| Page: 1 |
Top |
Somatic mutation of malignant transformation related genes |
| Annotation of somatic variants for genes involved in malignant transformation |
| Hugo Symbol | Variant Class | Variant Classification | dbSNP RS | HGVSc | HGVSp | HGVSp Short | SWISSPROT | BIOTYPE | SIFT | PolyPhen | Tumor Sample Barcode | Tissue | Histology | Sex | Age | Stage | Therapy Types | Drugs | Outcome |
| RALGAPB | SNV | Missense_Mutation | c.4156N>C | p.Glu1386Gln | p.E1386Q | Q86X10 | protein_coding | tolerated(0.12) | possibly_damaging(0.852) | TCGA-A2-A0YK-01 | Breast | breast invasive carcinoma | Female | <65 | I/II | Chemotherapy | cytoxan | SD | |
| RALGAPB | SNV | Missense_Mutation | c.79G>C | p.Glu27Gln | p.E27Q | Q86X10 | protein_coding | tolerated(0.48) | benign(0.062) | TCGA-AC-A23H-01 | Breast | breast invasive carcinoma | Female | >=65 | I/II | Unknown | Unknown | PD | |
| RALGAPB | SNV | Missense_Mutation | rs771253115 | c.1980G>C | p.Leu660Phe | p.L660F | Q86X10 | protein_coding | tolerated(0.19) | probably_damaging(0.991) | TCGA-AC-A23H-01 | Breast | breast invasive carcinoma | Female | >=65 | I/II | Unknown | Unknown | PD |
| RALGAPB | SNV | Missense_Mutation | novel | c.2744N>T | p.Ser915Leu | p.S915L | Q86X10 | protein_coding | deleterious(0.03) | benign(0.059) | TCGA-AN-A046-01 | Breast | breast invasive carcinoma | Female | >=65 | I/II | Unknown | Unknown | SD |
| RALGAPB | SNV | Missense_Mutation | c.1495N>G | p.Met499Val | p.M499V | Q86X10 | protein_coding | tolerated(0.41) | benign(0) | TCGA-AN-A0AK-01 | Breast | breast invasive carcinoma | Female | >=65 | I/II | Unknown | Unknown | SD | |
| RALGAPB | SNV | Missense_Mutation | c.2977N>G | p.Leu993Val | p.L993V | Q86X10 | protein_coding | tolerated(0.13) | benign(0.109) | TCGA-AO-A0J4-01 | Breast | breast invasive carcinoma | Female | <65 | I/II | Chemotherapy | doxorubicin | SD | |
| RALGAPB | SNV | Missense_Mutation | c.2984N>G | p.Pro995Arg | p.P995R | Q86X10 | protein_coding | deleterious(0) | probably_damaging(0.996) | TCGA-AR-A24L-01 | Breast | breast invasive carcinoma | Female | <65 | I/II | Hormone Therapy | tamoxiphen | PD | |
| RALGAPB | SNV | Missense_Mutation | novel | c.1594N>A | p.Glu532Lys | p.E532K | Q86X10 | protein_coding | deleterious(0.01) | benign(0.075) | TCGA-BH-A0B6-01 | Breast | breast invasive carcinoma | Female | <65 | I/II | Unknown | Unknown | SD |
| RALGAPB | SNV | Missense_Mutation | c.2992N>A | p.Ala998Thr | p.A998T | Q86X10 | protein_coding | tolerated(0.49) | probably_damaging(0.993) | TCGA-BH-A0HF-01 | Breast | breast invasive carcinoma | Female | >=65 | I/II | Hormone Therapy | arimidex | SD | |
| RALGAPB | SNV | Missense_Mutation | c.79G>A | p.Glu27Lys | p.E27K | Q86X10 | protein_coding | tolerated(0.75) | benign(0.022) | TCGA-BH-A18P-01 | Breast | breast invasive carcinoma | Female | <65 | I/II | Unknown | Unknown | PD |
| Page: 1 2 3 4 5 6 7 8 9 10 11 12 13 14 15 16 17 18 19 20 |
Top |
Related drugs of malignant transformation related genes |
| Identification of chemicals and drugs interact with genes involved in malignant transfromation |
| (DGIdb 4.0) |
| Entrez ID | Symbol | Category | Interaction Types | Drug Claim Name | Drug Name | PMIDs |
| Page: 1 |

Copyright 2023-Present -The University of Texas Health Science Center at Houston |