
|
|||||
|
 | |
| |
| |
| |
| |
| |
|
Gene: RALGAPA1 |
Gene summary for RALGAPA1 |
| Gene information | Species | Human | Gene symbol | RALGAPA1 | Gene ID | 253959 |
| Gene name | Ral GTPase activating protein catalytic subunit alpha 1 | |
| Gene Alias | GARNL1 | |
| Cytomap | 14q13.2 | |
| Gene Type | protein-coding | GO ID | GO:0007154 | UniProtAcc | Q6GYQ0 |
Top |
Malignant transformation analysis |
| Identification of the aberrant gene expression in precancerous and cancerous lesions by comparing the gene expression of stem-like cells in diseased tissues with normal stem cells |
| Entrez ID | Symbol | Replicates | Species | Organ | Tissue | Adj P-value | Log2FC | Malignancy |
| 253959 | RALGAPA1 | CCI_1 | Human | Cervix | CC | 8.15e-04 | 6.27e-01 | 0.528 |
| 253959 | RALGAPA1 | CCI_2 | Human | Cervix | CC | 9.75e-07 | 8.31e-01 | 0.5249 |
| 253959 | RALGAPA1 | HTA11_3410_2000001011 | Human | Colorectum | AD | 1.09e-51 | -9.99e-01 | 0.0155 |
| 253959 | RALGAPA1 | HTA11_2487_2000001011 | Human | Colorectum | SER | 1.33e-09 | -6.06e-01 | -0.1808 |
| 253959 | RALGAPA1 | HTA11_2951_2000001011 | Human | Colorectum | AD | 9.87e-07 | -9.47e-01 | 0.0216 |
| 253959 | RALGAPA1 | HTA11_1938_2000001011 | Human | Colorectum | AD | 7.04e-09 | -5.08e-01 | -0.0811 |
| 253959 | RALGAPA1 | HTA11_347_2000001011 | Human | Colorectum | AD | 4.27e-03 | 4.27e-01 | -0.1954 |
| 253959 | RALGAPA1 | HTA11_3361_2000001011 | Human | Colorectum | AD | 5.88e-19 | -8.08e-01 | -0.1207 |
| 253959 | RALGAPA1 | HTA11_696_2000001011 | Human | Colorectum | AD | 1.73e-07 | -4.03e-01 | -0.1464 |
| 253959 | RALGAPA1 | HTA11_5212_2000001011 | Human | Colorectum | AD | 1.52e-09 | -7.95e-01 | -0.2061 |
| 253959 | RALGAPA1 | HTA11_5216_2000001011 | Human | Colorectum | SER | 7.69e-05 | -6.15e-01 | -0.1462 |
| 253959 | RALGAPA1 | HTA11_7862_2000001011 | Human | Colorectum | AD | 1.29e-08 | -5.77e-01 | -0.0179 |
| 253959 | RALGAPA1 | HTA11_866_3004761011 | Human | Colorectum | AD | 2.90e-18 | -6.95e-01 | 0.096 |
| 253959 | RALGAPA1 | HTA11_9408_2000001011 | Human | Colorectum | AD | 1.62e-02 | -8.43e-01 | 0.0451 |
| 253959 | RALGAPA1 | HTA11_8622_2000001021 | Human | Colorectum | SER | 1.66e-07 | -7.66e-01 | 0.0528 |
| 253959 | RALGAPA1 | HTA11_7663_2000001011 | Human | Colorectum | SER | 5.12e-03 | -5.48e-01 | 0.0131 |
| 253959 | RALGAPA1 | HTA11_10711_2000001011 | Human | Colorectum | AD | 2.01e-20 | -7.80e-01 | 0.0338 |
| 253959 | RALGAPA1 | HTA11_7696_3000711011 | Human | Colorectum | AD | 3.76e-25 | -7.09e-01 | 0.0674 |
| 253959 | RALGAPA1 | HTA11_6818_2000001011 | Human | Colorectum | AD | 1.10e-05 | -6.90e-01 | 0.0112 |
| 253959 | RALGAPA1 | HTA11_7469_2000001011 | Human | Colorectum | AD | 2.10e-02 | -7.79e-01 | -0.0124 |
| Page: 1 2 3 4 5 6 7 8 9 10 |
| Tissue | Expression Dynamics | Abbreviation |
| Cervix | 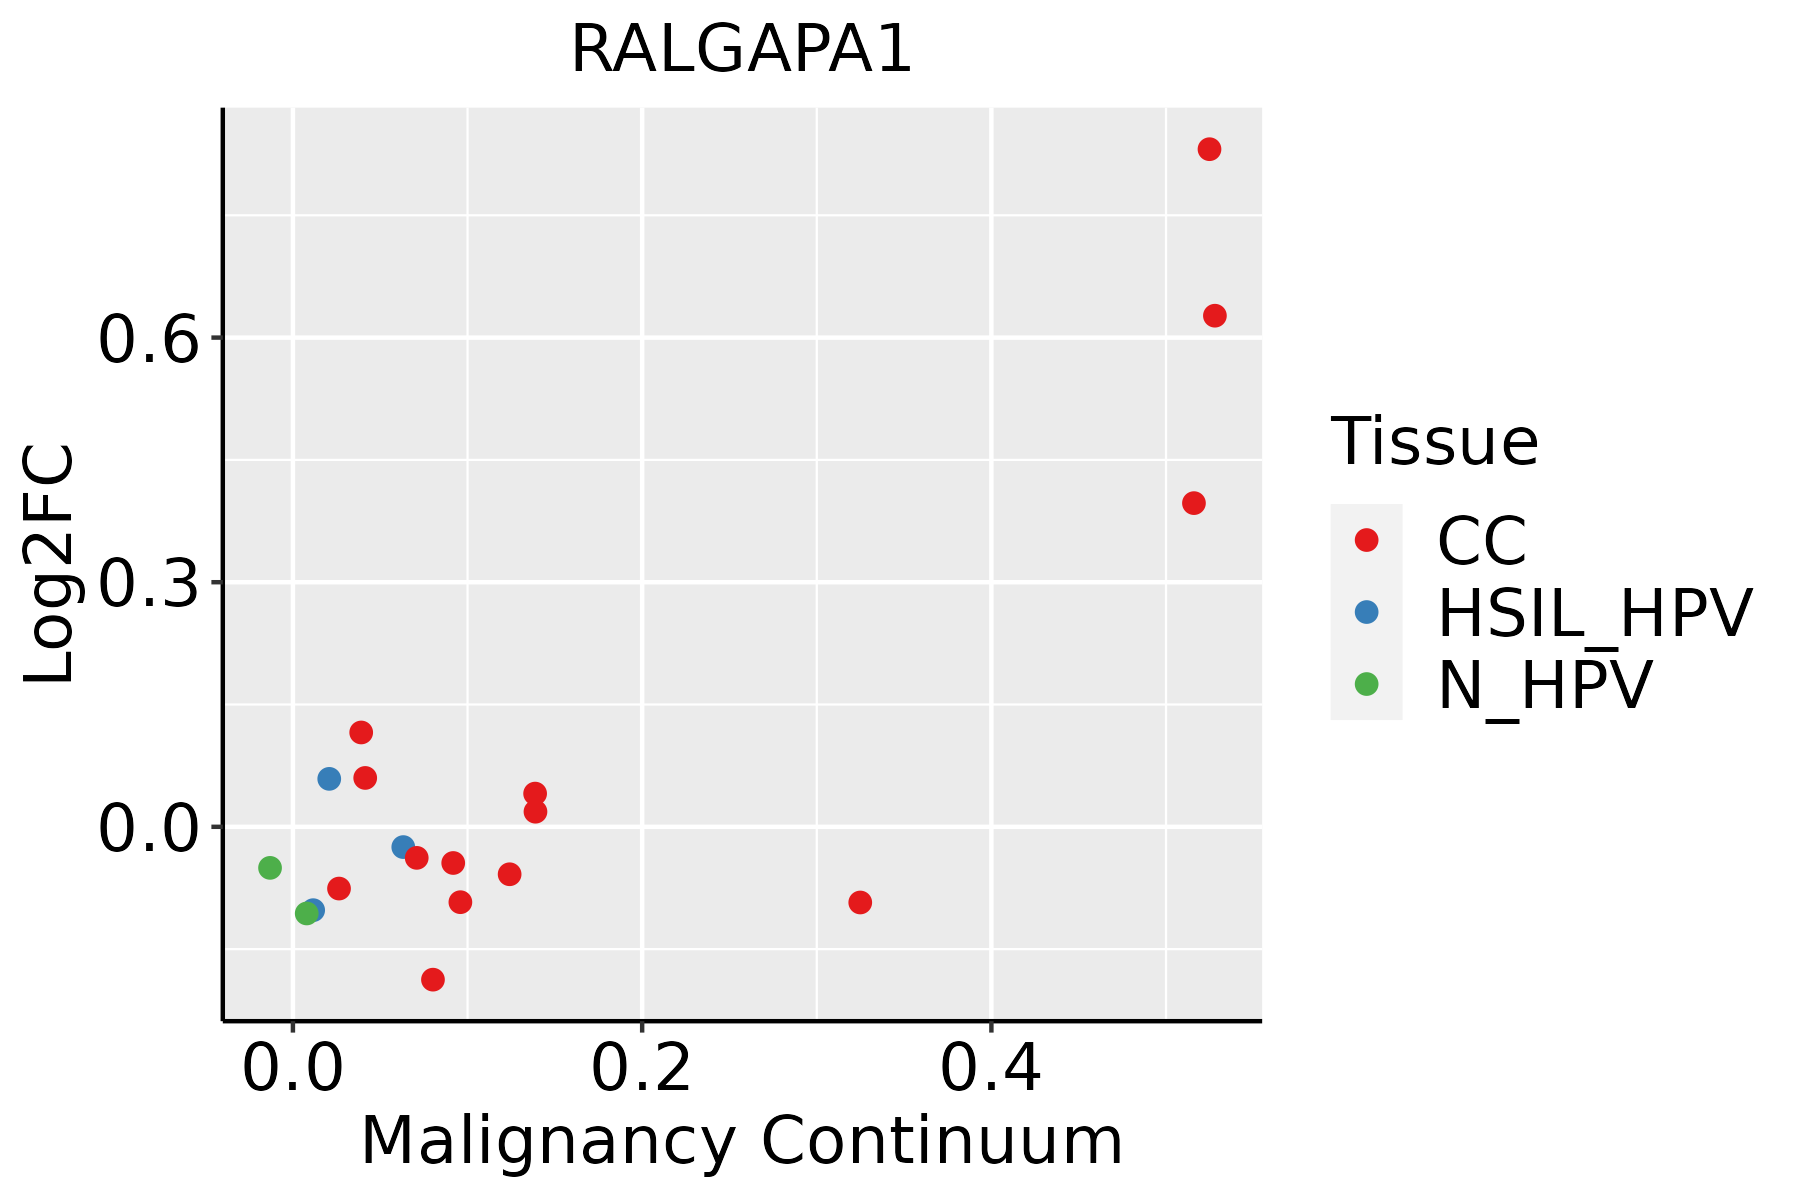 | CC: Cervix cancer |
| HSIL_HPV: HPV-infected high-grade squamous intraepithelial lesions | ||
| N_HPV: HPV-infected normal cervix | ||
| Colorectum (GSE201348) | 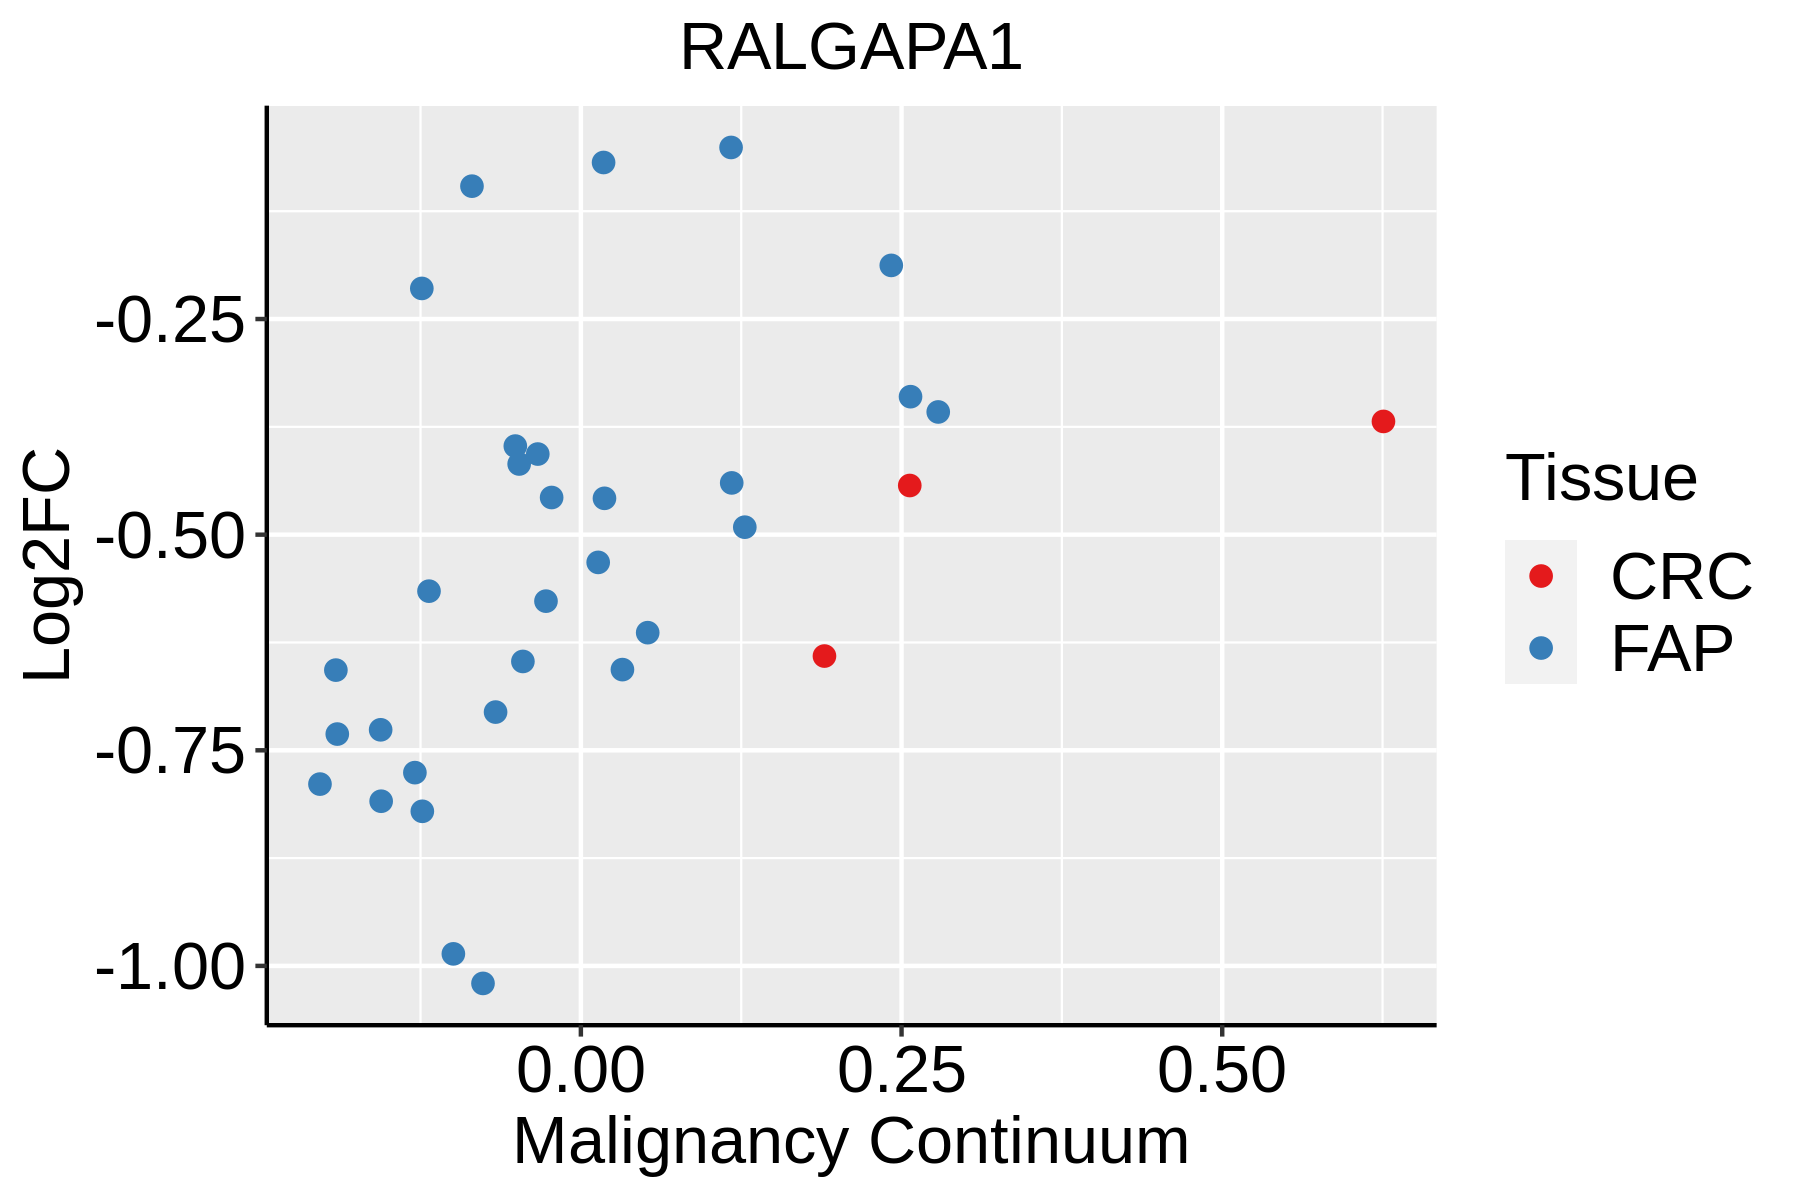 | FAP: Familial adenomatous polyposis |
| CRC: Colorectal cancer | ||
| Colorectum (HTA11) |  | AD: Adenomas |
| SER: Sessile serrated lesions | ||
| MSI-H: Microsatellite-high colorectal cancer | ||
| MSS: Microsatellite stable colorectal cancer | ||
| Endometrium | 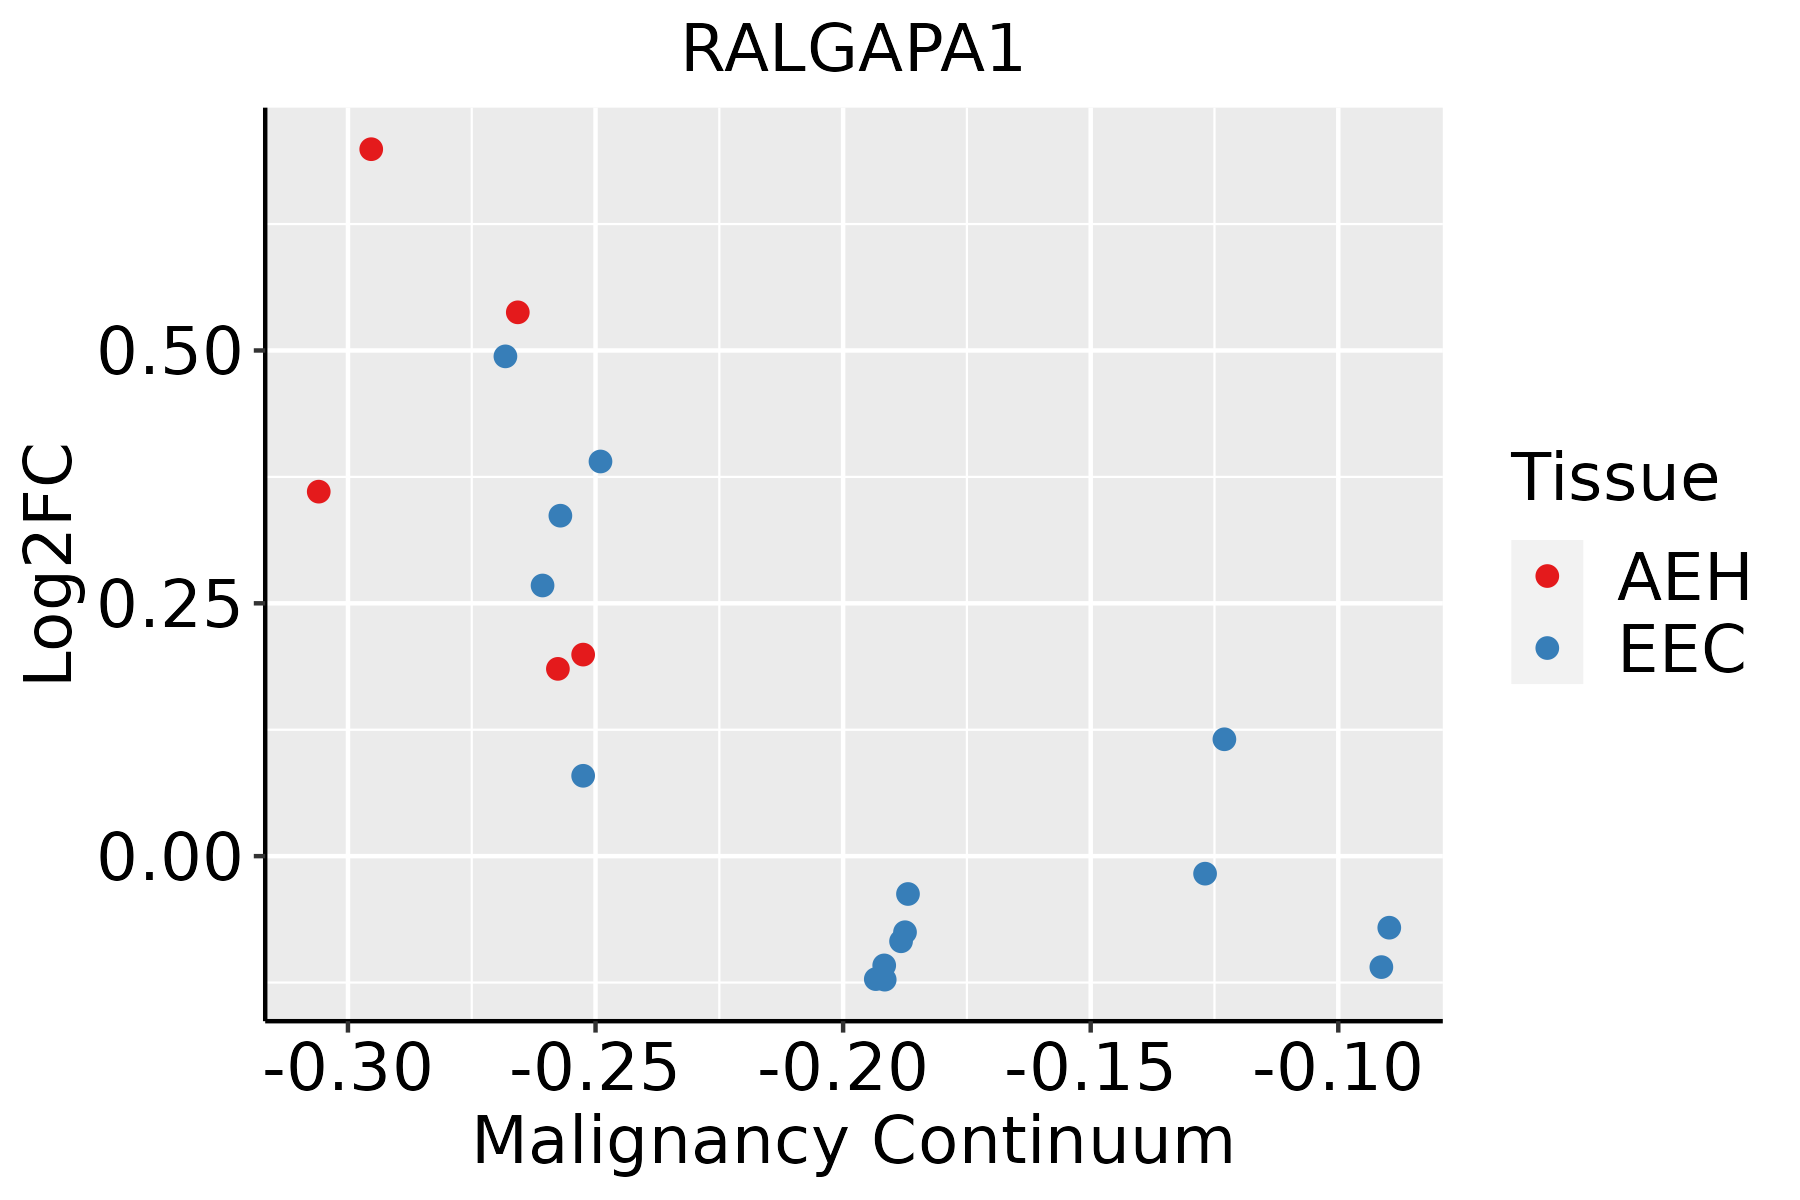 | AEH: Atypical endometrial hyperplasia |
| EEC: Endometrioid Cancer | ||
| Esophagus | 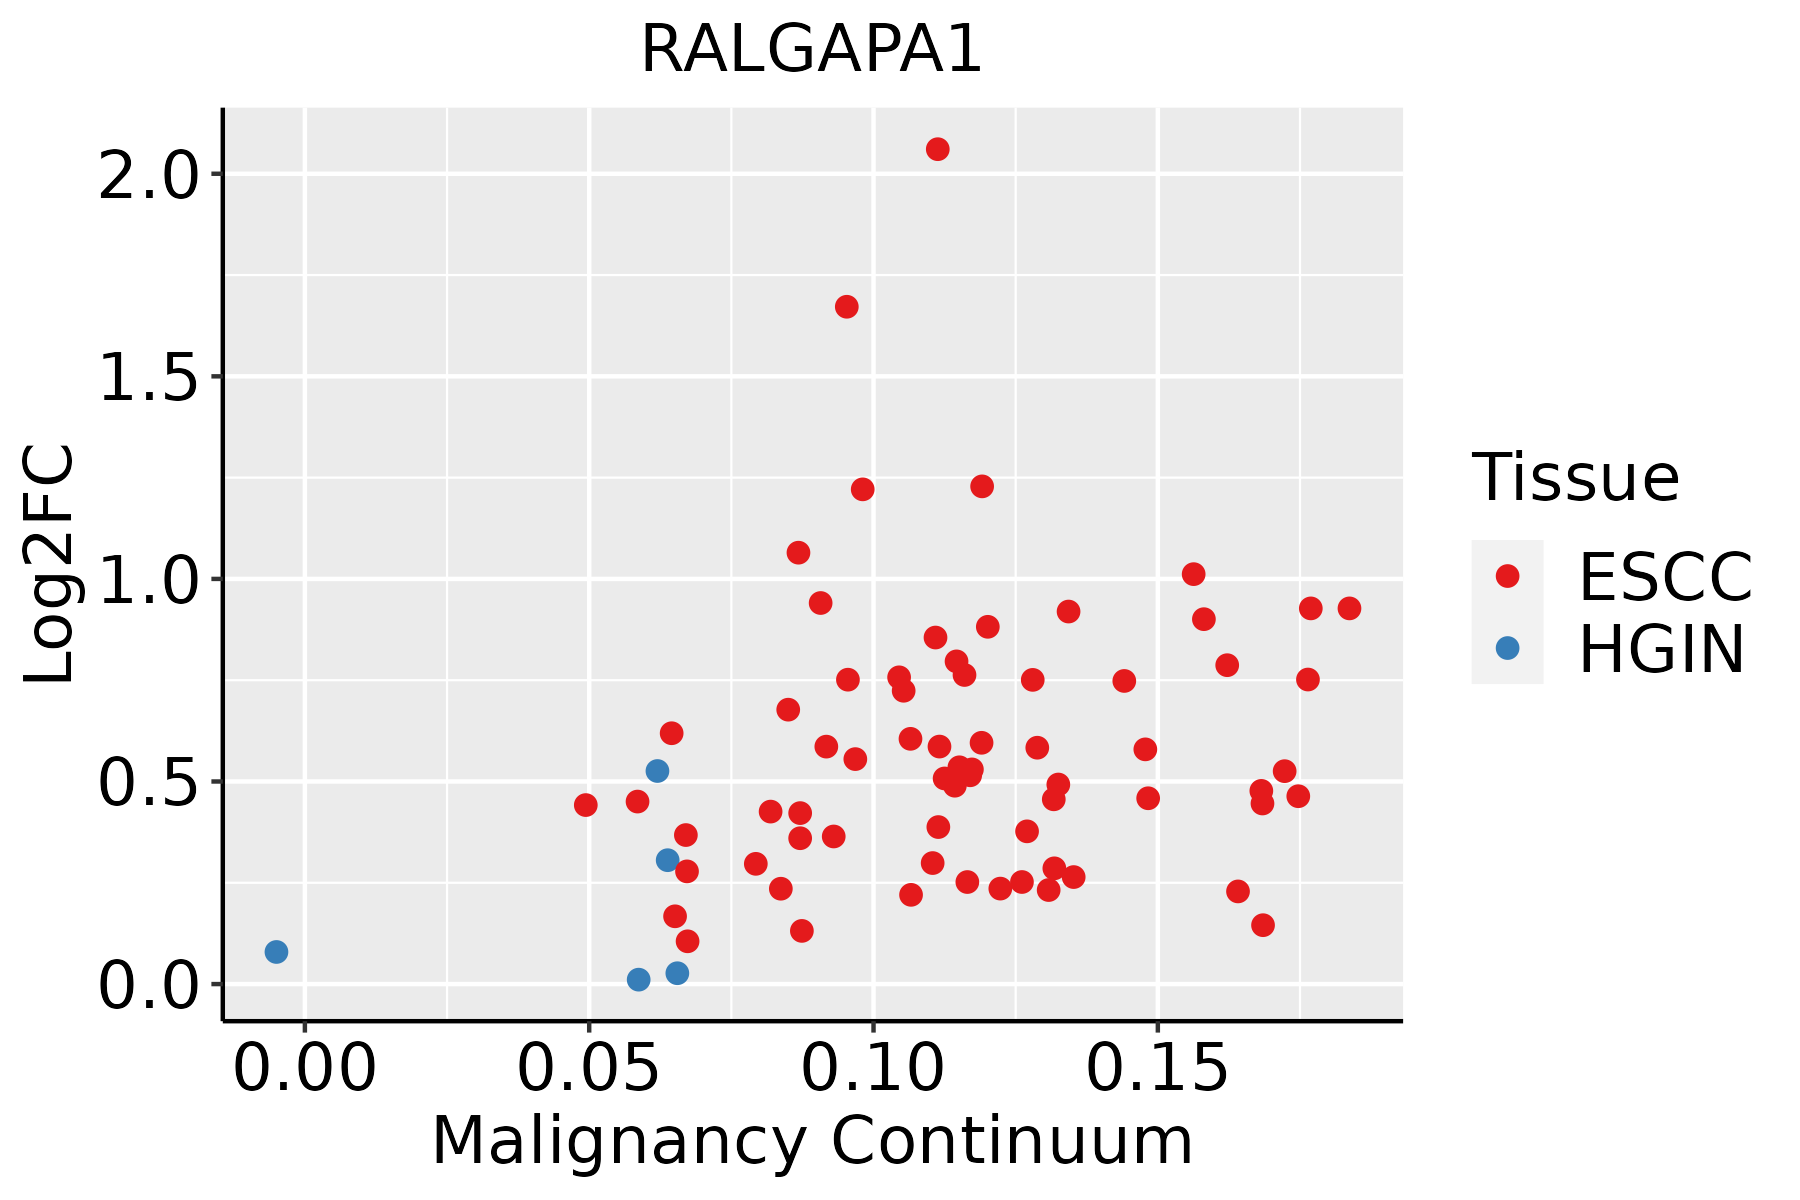 | ESCC: Esophageal squamous cell carcinoma |
| HGIN: High-grade intraepithelial neoplasias | ||
| LGIN: Low-grade intraepithelial neoplasias | ||
| Lung | 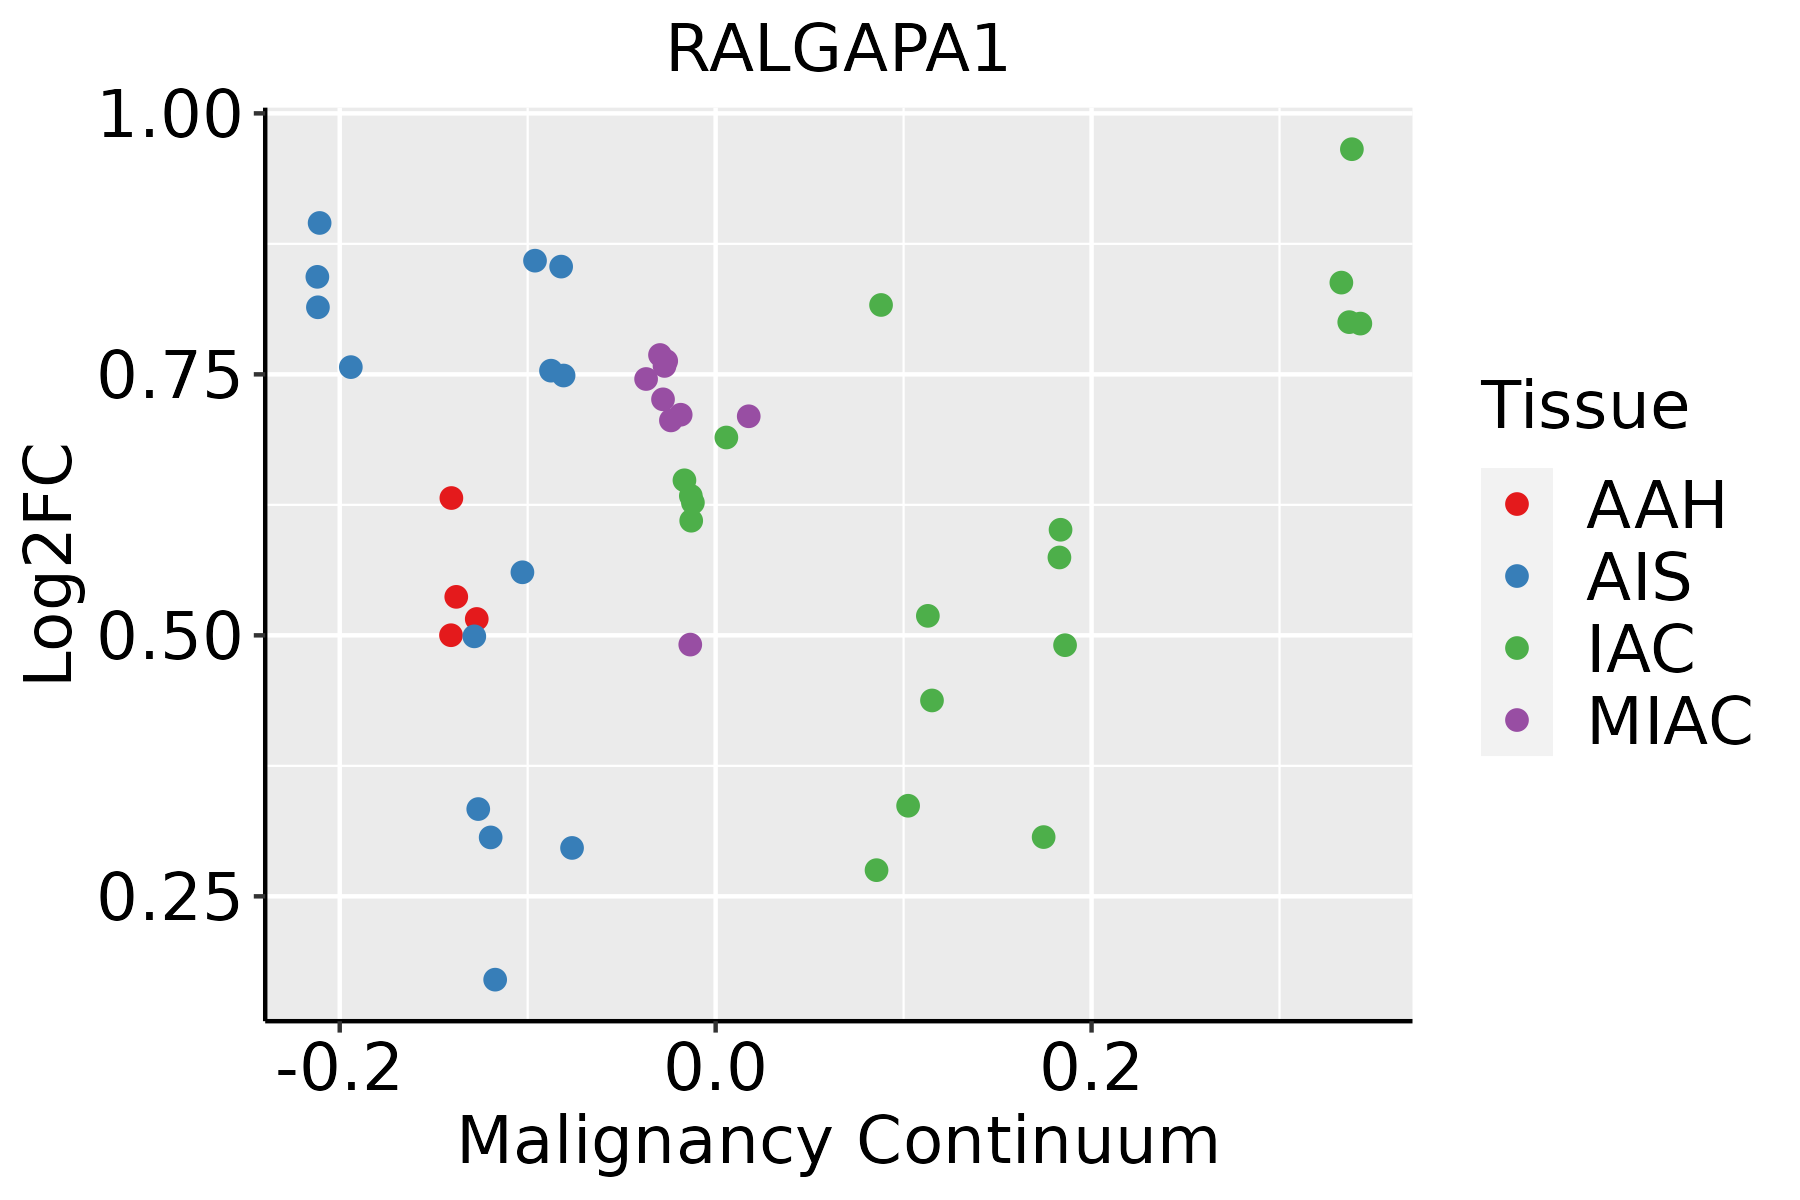 | AAH: Atypical adenomatous hyperplasia |
| AIS: Adenocarcinoma in situ | ||
| IAC: Invasive lung adenocarcinoma | ||
| MIA: Minimally invasive adenocarcinoma | ||
| Prostate |  | BPH: Benign Prostatic Hyperplasia |
| Thyroid | 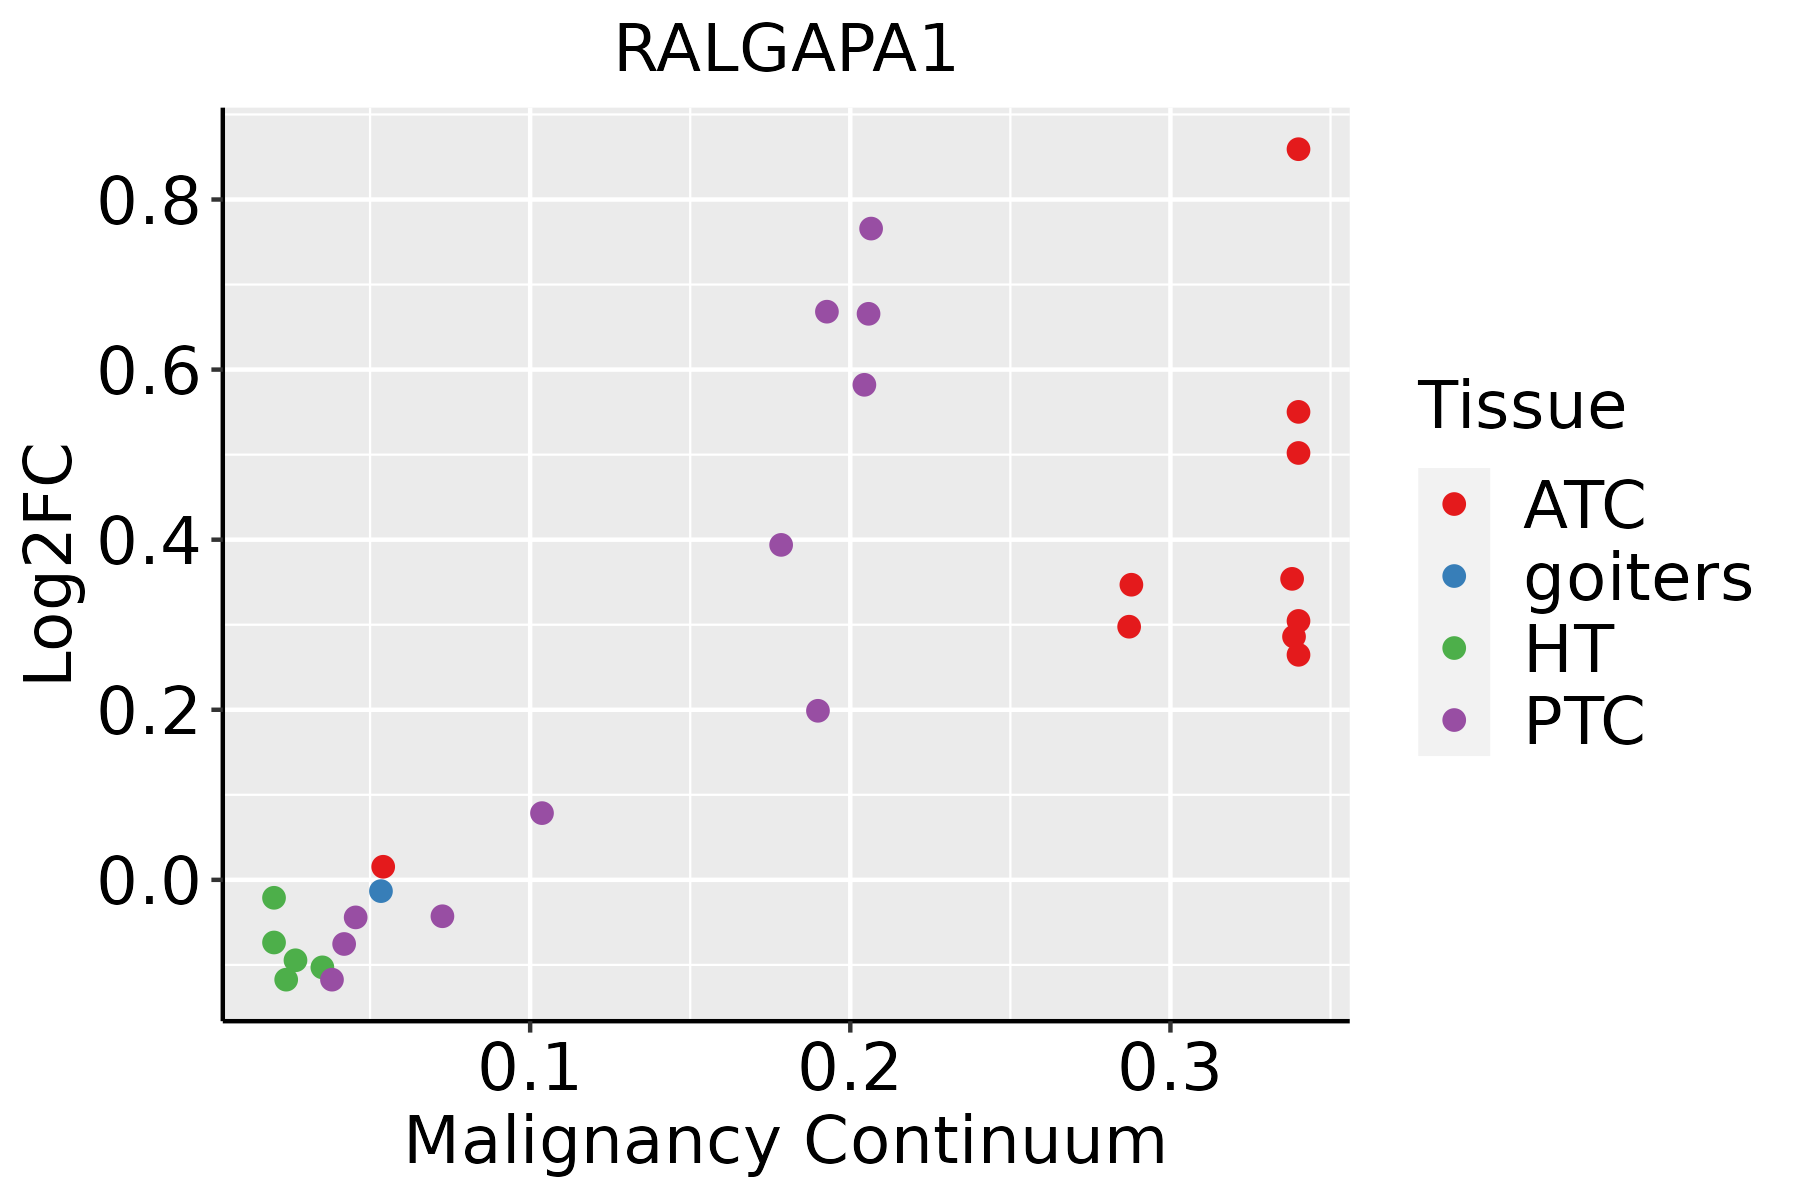 | ATC: Anaplastic thyroid cancer |
| HT: Hashimoto's thyroiditis | ||
| PTC: Papillary thyroid cancer |
| ∗log2FC in expression of this searched gene in stem-like cells from each diseased tissue sample relative to stem-like cells in normal samples in each tissue plotted against the malignancy continuum. Samples are colored based on if they are from different disease stage. |
Top |
Malignant transformation related pathway analysis |
| Find out the enriched GO biological processes and KEGG pathways involved in transition from healthy to precancer to cancer |
| Tissue | Disease Stage | Enriched GO biological Processes |
| Colorectum | AD |  |
| Colorectum | SER |  |
| Colorectum | MSS |  |
| Colorectum | MSI-H |  |
| Colorectum | FAP |  |
| ∗Top 15 enriched GO BP terms are showed in the bar plot of each disease state in each tissue. Each row represents a significant GO biological process which is colored according to the -log10(p.adjust). |
| Page: 1 2 3 4 5 6 7 8 9 |
| GO ID | Tissue | Disease Stage | Description | Gene Ratio | Bg Ratio | pvalue | p.adjust | Count |
| GO:00510566 | Cervix | CC | regulation of small GTPase mediated signal transduction | 75/2311 | 302/18723 | 1.54e-09 | 1.74e-07 | 75 |
| GO:00430877 | Cervix | CC | regulation of GTPase activity | 79/2311 | 348/18723 | 4.21e-08 | 2.60e-06 | 79 |
| GO:00435476 | Cervix | CC | positive regulation of GTPase activity | 53/2311 | 255/18723 | 8.72e-05 | 1.16e-03 | 53 |
| GO:0043087 | Colorectum | AD | regulation of GTPase activity | 110/3918 | 348/18723 | 1.64e-06 | 5.03e-05 | 110 |
| GO:0051056 | Colorectum | AD | regulation of small GTPase mediated signal transduction | 94/3918 | 302/18723 | 1.81e-05 | 3.76e-04 | 94 |
| GO:0043547 | Colorectum | AD | positive regulation of GTPase activity | 75/3918 | 255/18723 | 7.95e-04 | 7.91e-03 | 75 |
| GO:00430871 | Colorectum | SER | regulation of GTPase activity | 77/2897 | 348/18723 | 5.90e-04 | 8.07e-03 | 77 |
| GO:00430872 | Colorectum | MSS | regulation of GTPase activity | 101/3467 | 348/18723 | 1.00e-06 | 3.46e-05 | 101 |
| GO:00510561 | Colorectum | MSS | regulation of small GTPase mediated signal transduction | 82/3467 | 302/18723 | 1.31e-04 | 1.99e-03 | 82 |
| GO:00435471 | Colorectum | MSS | positive regulation of GTPase activity | 68/3467 | 255/18723 | 7.97e-04 | 8.38e-03 | 68 |
| GO:00510562 | Colorectum | FAP | regulation of small GTPase mediated signal transduction | 78/2622 | 302/18723 | 3.25e-08 | 2.85e-06 | 78 |
| GO:00430873 | Colorectum | FAP | regulation of GTPase activity | 85/2622 | 348/18723 | 1.20e-07 | 7.68e-06 | 85 |
| GO:00435472 | Colorectum | FAP | positive regulation of GTPase activity | 61/2622 | 255/18723 | 1.39e-05 | 3.73e-04 | 61 |
| GO:0090630 | Colorectum | FAP | activation of GTPase activity | 27/2622 | 115/18723 | 4.23e-03 | 2.90e-02 | 27 |
| GO:00510563 | Colorectum | CRC | regulation of small GTPase mediated signal transduction | 69/2078 | 302/18723 | 3.34e-09 | 9.08e-07 | 69 |
| GO:00430874 | Colorectum | CRC | regulation of GTPase activity | 69/2078 | 348/18723 | 1.11e-06 | 6.69e-05 | 69 |
| GO:00435473 | Colorectum | CRC | positive regulation of GTPase activity | 49/2078 | 255/18723 | 8.67e-05 | 1.77e-03 | 49 |
| GO:00430878 | Endometrium | AEH | regulation of GTPase activity | 66/2100 | 348/18723 | 1.26e-05 | 2.77e-04 | 66 |
| GO:00510567 | Endometrium | AEH | regulation of small GTPase mediated signal transduction | 59/2100 | 302/18723 | 1.43e-05 | 3.03e-04 | 59 |
| GO:00435477 | Endometrium | AEH | positive regulation of GTPase activity | 48/2100 | 255/18723 | 2.18e-04 | 2.67e-03 | 48 |
| Page: 1 2 3 |
| Pathway ID | Tissue | Disease Stage | Description | Gene Ratio | Bg Ratio | pvalue | p.adjust | qvalue | Count |
| hsa040142 | Cervix | CC | Ras signaling pathway | 51/1267 | 236/8465 | 3.55e-03 | 1.34e-02 | 7.91e-03 | 51 |
| hsa0401411 | Cervix | CC | Ras signaling pathway | 51/1267 | 236/8465 | 3.55e-03 | 1.34e-02 | 7.91e-03 | 51 |
| hsa04014 | Colorectum | CRC | Ras signaling pathway | 49/1091 | 236/8465 | 4.04e-04 | 4.50e-03 | 3.05e-03 | 49 |
| hsa040141 | Colorectum | CRC | Ras signaling pathway | 49/1091 | 236/8465 | 4.04e-04 | 4.50e-03 | 3.05e-03 | 49 |
| Page: 1 |
Top |
Cell-cell communication analysis |
| Identification of potential cell-cell interactions between two cell types and their ligand-receptor pairs for different disease states |
| Ligand | Receptor | LRpair | Pathway | Tissue | Disease Stage |
| Page: 1 |
Top |
Single-cell gene regulatory network inference analysis |
| Find out the significant the regulons (TFs) and the target genes of each regulon across cell types for different disease states |
| TF | Cell Type | Tissue | Disease Stage | Target Gene | RSS | Regulon Activity |
| ∗The dot plots of a searched regulon are shown for all cell subpopulations in each disease state of each tissue based on the regulon specific score inferred using pySCENIC and by calculating the average expression. |
| Page: 1 |
Top |
Somatic mutation of malignant transformation related genes |
| Annotation of somatic variants for genes involved in malignant transformation |
| Hugo Symbol | Variant Class | Variant Classification | dbSNP RS | HGVSc | HGVSp | HGVSp Short | SWISSPROT | BIOTYPE | SIFT | PolyPhen | Tumor Sample Barcode | Tissue | Histology | Sex | Age | Stage | Therapy Types | Drugs | Outcome |
| RALGAPA1 | SNV | Missense_Mutation | c.5074G>C | p.Glu1692Gln | p.E1692Q | protein_coding | deleterious(0.02) | probably_damaging(0.994) | TCGA-A1-A0SF-01 | Breast | breast invasive carcinoma | Female | <65 | I/II | Chemotherapy | tc | SD | ||
| RALGAPA1 | SNV | Missense_Mutation | novel | c.691G>C | p.Glu231Gln | p.E231Q | protein_coding | tolerated(0.12) | probably_damaging(0.986) | TCGA-A7-A56D-01 | Breast | breast invasive carcinoma | Female | >=65 | I/II | Hormone Therapy | arimidex | SD | |
| RALGAPA1 | SNV | Missense_Mutation | novel | c.7348N>A | p.Gln2450Lys | p.Q2450K | protein_coding | deleterious(0.01) | benign(0.143) | TCGA-AN-A046-01 | Breast | breast invasive carcinoma | Female | >=65 | I/II | Unknown | Unknown | SD | |
| RALGAPA1 | SNV | Missense_Mutation | novel | c.2381N>A | p.Arg794Gln | p.R794Q | protein_coding | deleterious(0.01) | probably_damaging(0.982) | TCGA-AN-A046-01 | Breast | breast invasive carcinoma | Female | >=65 | I/II | Unknown | Unknown | SD | |
| RALGAPA1 | SNV | Missense_Mutation | novel | c.174N>A | p.Phe58Leu | p.F58L | protein_coding | tolerated(0.13) | possibly_damaging(0.825) | TCGA-AN-A046-01 | Breast | breast invasive carcinoma | Female | >=65 | I/II | Unknown | Unknown | SD | |
| RALGAPA1 | SNV | Missense_Mutation | novel | c.2001G>T | p.Glu667Asp | p.E667D | protein_coding | tolerated(0.66) | probably_damaging(0.979) | TCGA-AR-A0U0-01 | Breast | breast invasive carcinoma | Female | >=65 | I/II | Unknown | Unknown | SD | |
| RALGAPA1 | SNV | Missense_Mutation | novel | c.2398G>T | p.Asp800Tyr | p.D800Y | protein_coding | deleterious(0) | probably_damaging(0.999) | TCGA-AR-A5QQ-01 | Breast | breast invasive carcinoma | Female | >=65 | III/IV | Chemotherapy | carboplatin | PD | |
| RALGAPA1 | SNV | Missense_Mutation | c.3898N>A | p.Glu1300Lys | p.E1300K | protein_coding | deleterious_low_confidence(0) | probably_damaging(0.943) | TCGA-D8-A1JA-01 | Breast | breast invasive carcinoma | Female | <65 | III/IV | Chemotherapy | adriamycin | PD | ||
| RALGAPA1 | SNV | Missense_Mutation | c.6331N>G | p.Thr2111Ala | p.T2111A | protein_coding | tolerated(0.64) | benign(0) | TCGA-D8-A1XK-01 | Breast | breast invasive carcinoma | Female | <65 | I/II | Chemotherapy | doxorubicine+cyclophosphamide | SD | ||
| RALGAPA1 | SNV | Missense_Mutation | rs781337724 | c.4251N>A | p.Ser1417Arg | p.S1417R | protein_coding | tolerated(0.07) | probably_damaging(0.991) | TCGA-D8-A1Y1-01 | Breast | breast invasive carcinoma | Female | >=65 | III/IV | Hormone Therapy | tamoxiphen | PD |
| Page: 1 2 3 4 5 6 7 8 9 10 11 12 13 14 15 16 17 18 19 20 21 |
Top |
Related drugs of malignant transformation related genes |
| Identification of chemicals and drugs interact with genes involved in malignant transfromation |
| (DGIdb 4.0) |
| Entrez ID | Symbol | Category | Interaction Types | Drug Claim Name | Drug Name | PMIDs |
| Page: 1 |

Copyright 2023-Present -The University of Texas Health Science Center at Houston |