
|
|||||
|
 | |
| |
| |
| |
| |
| |
|
Gene: RALBP1 |
Gene summary for RALBP1 |
| Gene information | Species | Human | Gene symbol | RALBP1 | Gene ID | 10928 |
| Gene name | ralA binding protein 1 | |
| Gene Alias | RIP1 | |
| Cytomap | 18p11.22 | |
| Gene Type | protein-coding | GO ID | GO:0000266 | UniProtAcc | Q15311 |
Top |
Malignant transformation analysis |
| Identification of the aberrant gene expression in precancerous and cancerous lesions by comparing the gene expression of stem-like cells in diseased tissues with normal stem cells |
| Entrez ID | Symbol | Replicates | Species | Organ | Tissue | Adj P-value | Log2FC | Malignancy |
| 10928 | RALBP1 | HTA11_347_2000001011 | Human | Colorectum | AD | 6.03e-20 | 6.11e-01 | -0.1954 |
| 10928 | RALBP1 | HTA11_546_2000001011 | Human | Colorectum | AD | 2.72e-03 | 3.30e-01 | -0.0842 |
| 10928 | RALBP1 | A015-C-203 | Human | Colorectum | FAP | 4.46e-11 | -6.76e-02 | -0.1294 |
| 10928 | RALBP1 | A001-C-108 | Human | Colorectum | FAP | 2.63e-05 | 4.60e-02 | -0.0272 |
| 10928 | RALBP1 | A002-C-205 | Human | Colorectum | FAP | 2.87e-02 | -3.66e-02 | -0.1236 |
| 10928 | RALBP1 | A015-C-104 | Human | Colorectum | FAP | 2.17e-13 | 5.58e-02 | -0.1899 |
| 10928 | RALBP1 | A001-C-014 | Human | Colorectum | FAP | 3.59e-03 | -2.55e-02 | 0.0135 |
| 10928 | RALBP1 | A002-C-016 | Human | Colorectum | FAP | 1.75e-05 | -4.33e-02 | 0.0521 |
| 10928 | RALBP1 | A002-C-116 | Human | Colorectum | FAP | 4.43e-14 | -1.27e-01 | -0.0452 |
| 10928 | RALBP1 | F034 | Human | Colorectum | FAP | 1.06e-07 | 6.95e-02 | -0.0665 |
| 10928 | RALBP1 | F072B | Human | Colorectum | FAP | 4.68e-02 | -2.99e-02 | 0.257 |
| 10928 | RALBP1 | CRC-1-8810 | Human | Colorectum | CRC | 3.58e-03 | -1.76e-01 | 0.6257 |
| 10928 | RALBP1 | CRC-3-11773 | Human | Colorectum | CRC | 4.58e-02 | -1.24e-01 | 0.2564 |
| 10928 | RALBP1 | LZE2T | Human | Esophagus | ESCC | 3.23e-07 | 1.44e+00 | 0.082 |
| 10928 | RALBP1 | LZE4T | Human | Esophagus | ESCC | 3.97e-10 | 2.37e-01 | 0.0811 |
| 10928 | RALBP1 | LZE7T | Human | Esophagus | ESCC | 2.38e-06 | 5.00e-01 | 0.0667 |
| 10928 | RALBP1 | LZE8T | Human | Esophagus | ESCC | 8.64e-06 | 1.49e-01 | 0.067 |
| 10928 | RALBP1 | LZE20T | Human | Esophagus | ESCC | 2.64e-11 | 3.48e-01 | 0.0662 |
| 10928 | RALBP1 | LZE22D1 | Human | Esophagus | HGIN | 2.83e-04 | 1.73e-01 | 0.0595 |
| 10928 | RALBP1 | LZE24T | Human | Esophagus | ESCC | 1.22e-23 | 9.34e-01 | 0.0596 |
| Page: 1 2 3 4 5 6 7 8 |
| Tissue | Expression Dynamics | Abbreviation |
| Colorectum (GSE201348) |  | FAP: Familial adenomatous polyposis |
| CRC: Colorectal cancer | ||
| Colorectum (HTA11) |  | AD: Adenomas |
| SER: Sessile serrated lesions | ||
| MSI-H: Microsatellite-high colorectal cancer | ||
| MSS: Microsatellite stable colorectal cancer | ||
| Esophagus | 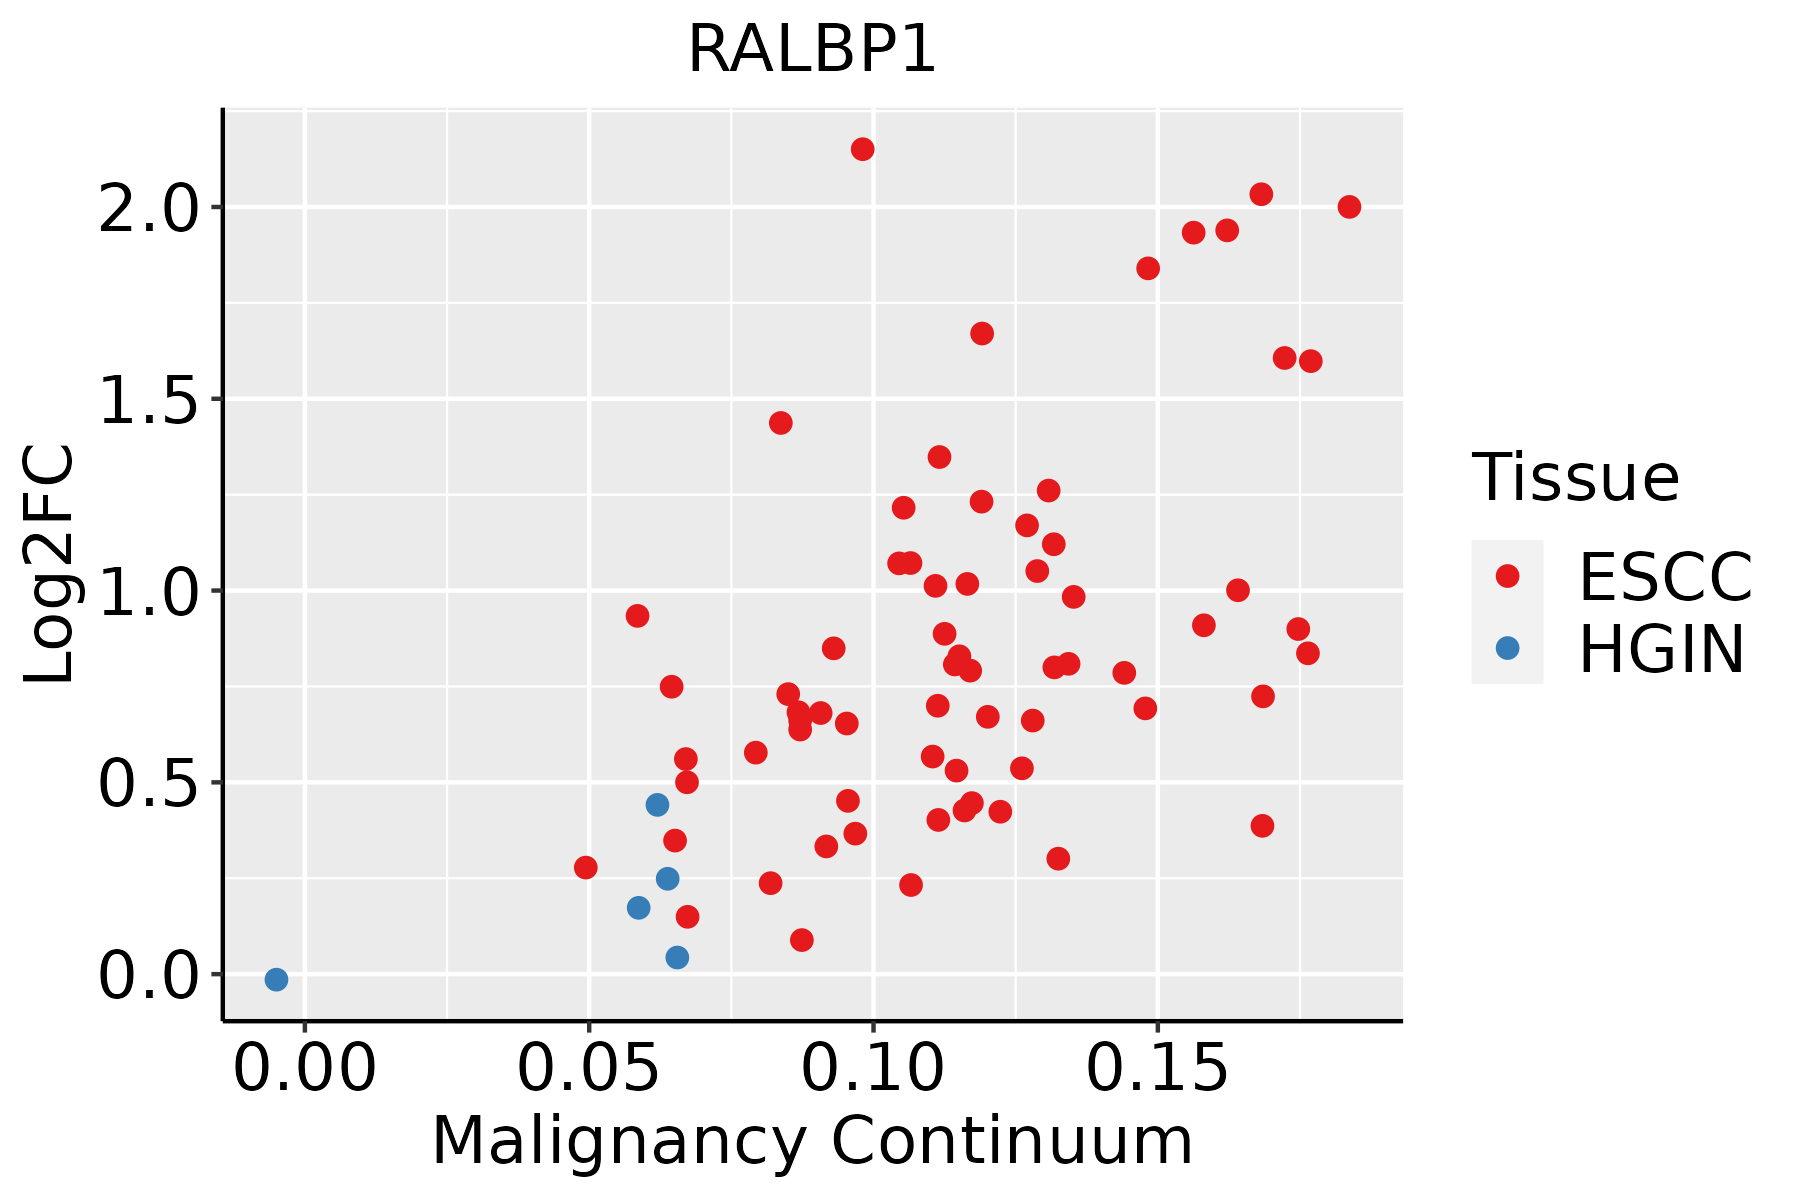 | ESCC: Esophageal squamous cell carcinoma |
| HGIN: High-grade intraepithelial neoplasias | ||
| LGIN: Low-grade intraepithelial neoplasias | ||
| Liver | 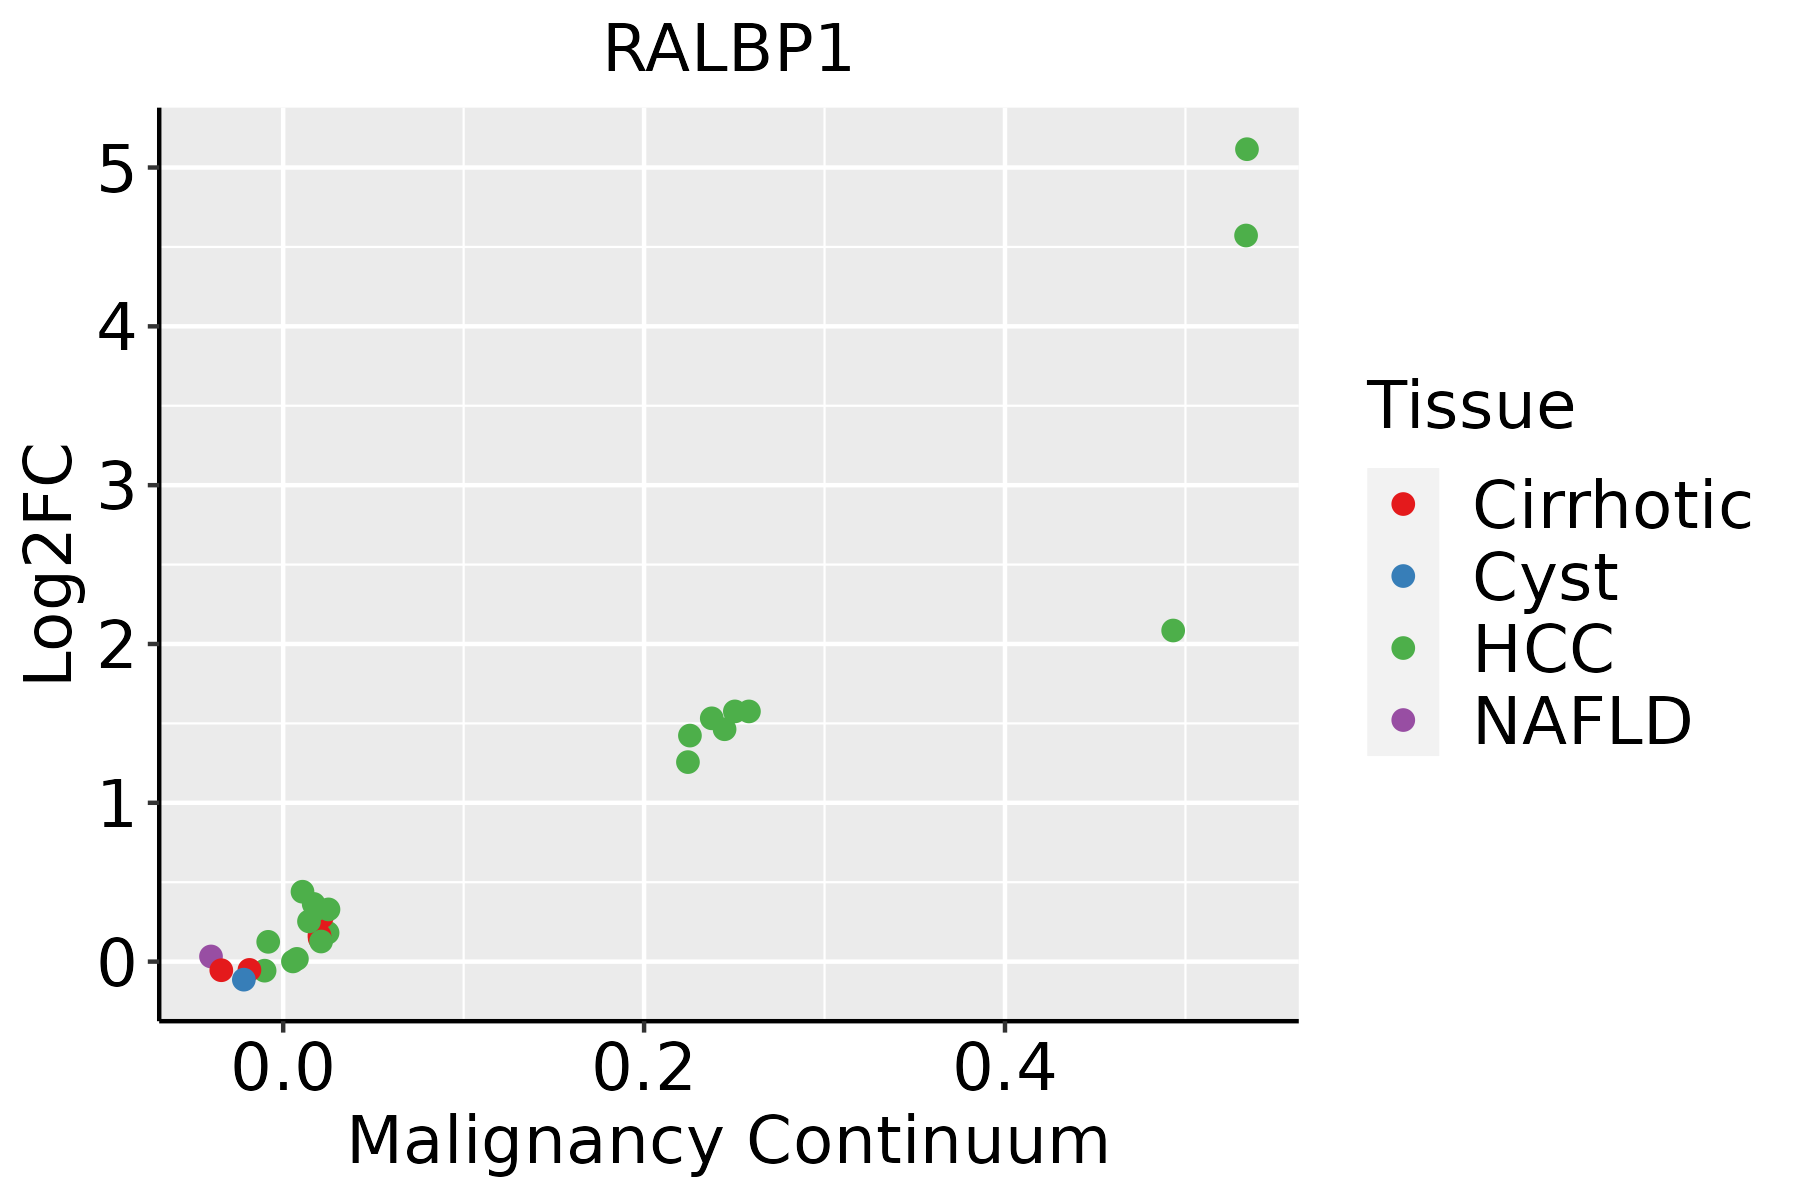 | HCC: Hepatocellular carcinoma |
| NAFLD: Non-alcoholic fatty liver disease | ||
| Oral Cavity | 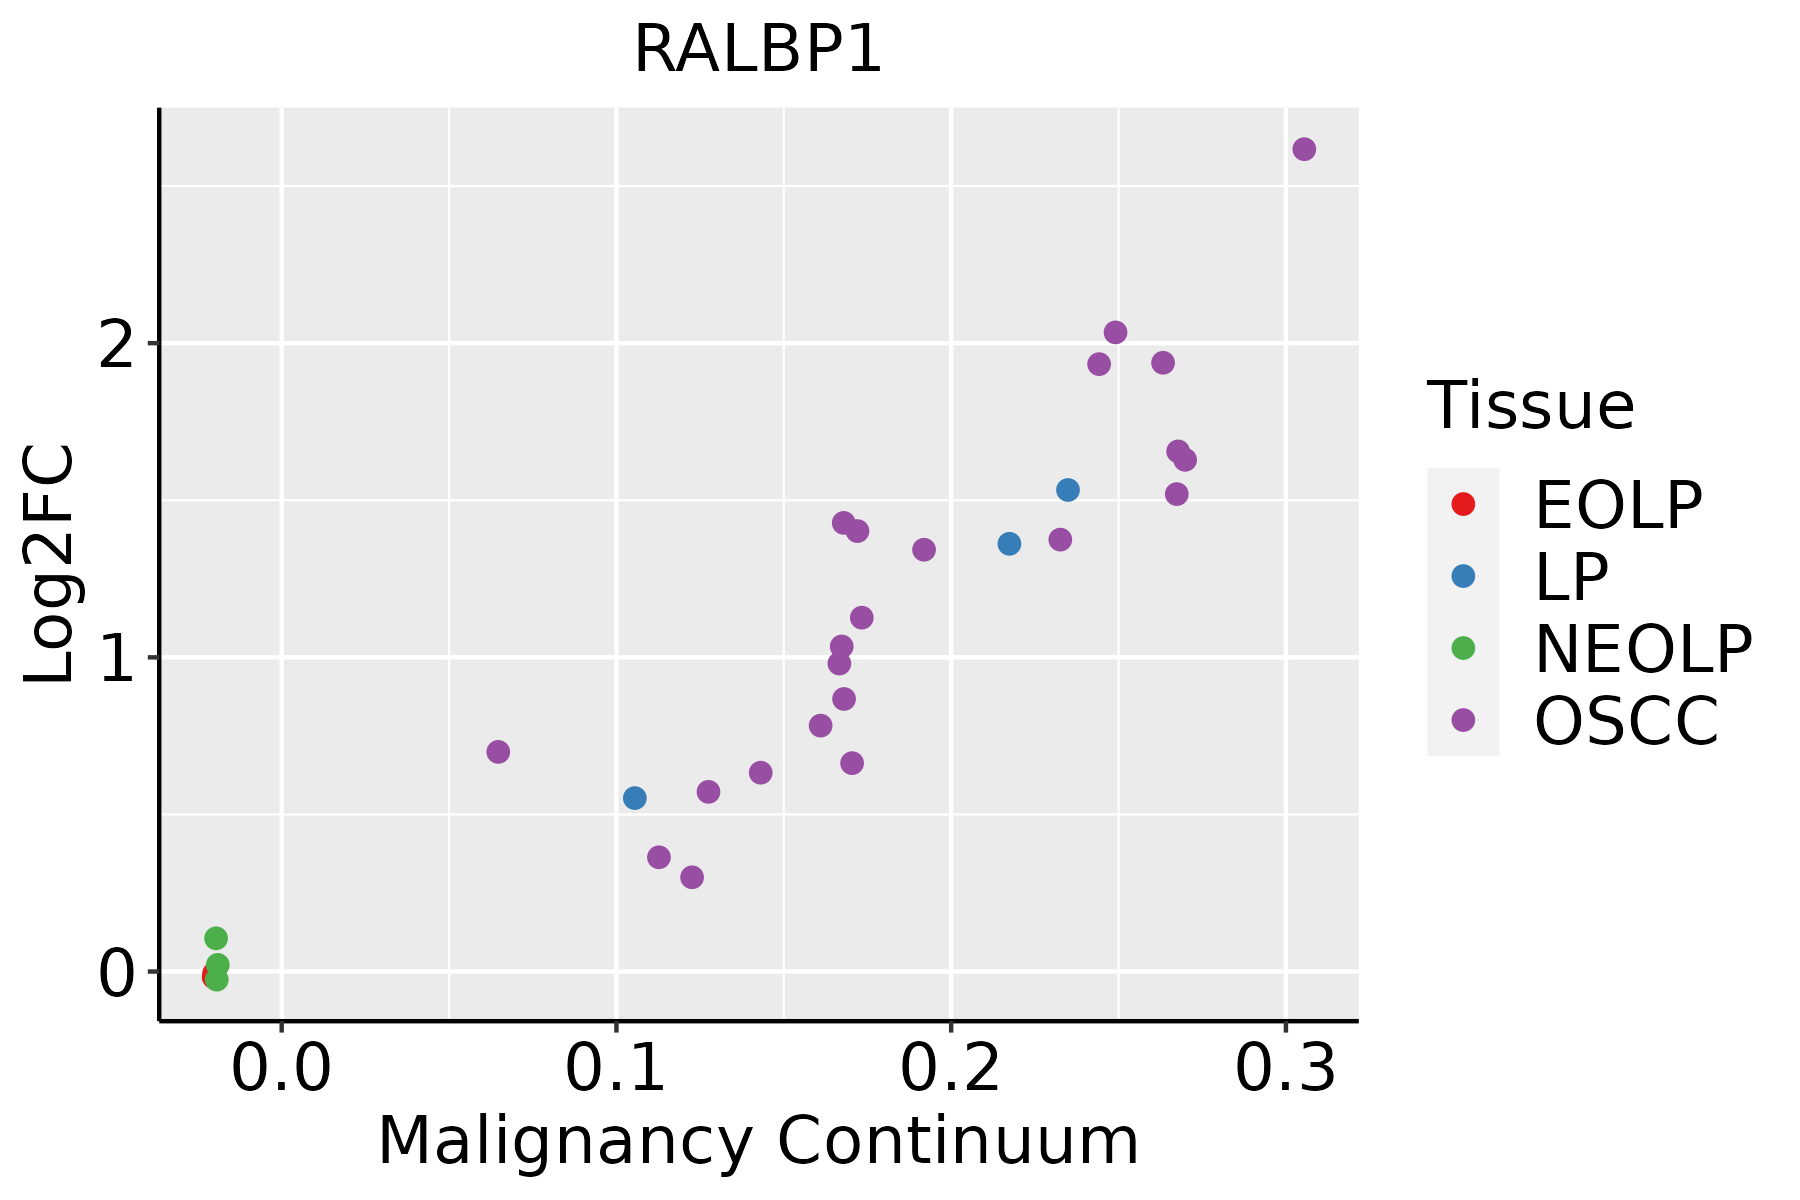 | EOLP: Erosive Oral lichen planus |
| LP: leukoplakia | ||
| NEOLP: Non-erosive oral lichen planus | ||
| OSCC: Oral squamous cell carcinoma | ||
| Prostate |  | BPH: Benign Prostatic Hyperplasia |
| Skin | 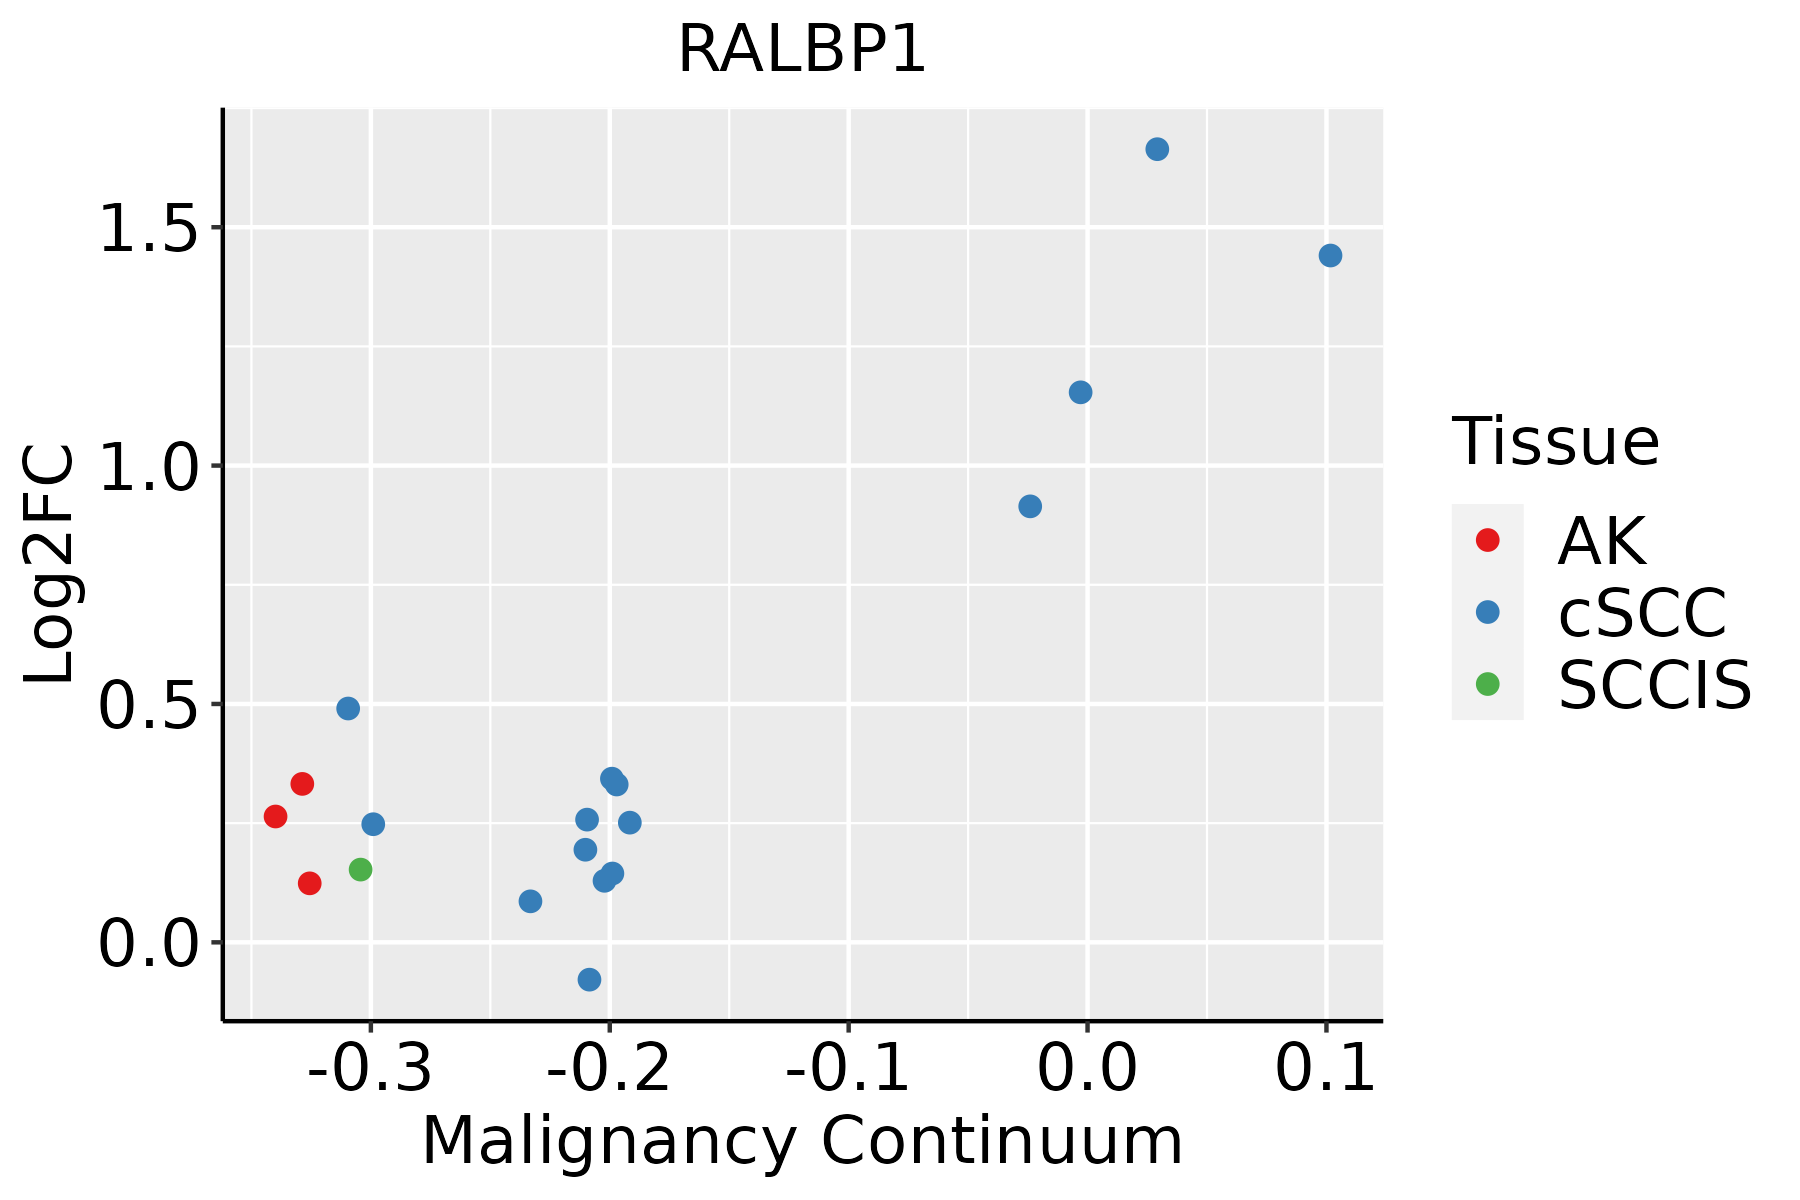 | AK: Actinic keratosis |
| cSCC: Cutaneous squamous cell carcinoma | ||
| SCCIS:squamous cell carcinoma in situ | ||
| Thyroid |  | ATC: Anaplastic thyroid cancer |
| HT: Hashimoto's thyroiditis | ||
| PTC: Papillary thyroid cancer |
| ∗log2FC in expression of this searched gene in stem-like cells from each diseased tissue sample relative to stem-like cells in normal samples in each tissue plotted against the malignancy continuum. Samples are colored based on if they are from different disease stage. |
Top |
Malignant transformation related pathway analysis |
| Find out the enriched GO biological processes and KEGG pathways involved in transition from healthy to precancer to cancer |
| Tissue | Disease Stage | Enriched GO biological Processes |
| Colorectum | AD |  |
| Colorectum | SER |  |
| Colorectum | MSS |  |
| Colorectum | MSI-H |  |
| Colorectum | FAP |  |
| ∗Top 15 enriched GO BP terms are showed in the bar plot of each disease state in each tissue. Each row represents a significant GO biological process which is colored according to the -log10(p.adjust). |
| Page: 1 2 3 4 5 6 7 8 9 |
| GO ID | Tissue | Disease Stage | Description | Gene Ratio | Bg Ratio | pvalue | p.adjust | Count |
| GO:0010821 | Colorectum | AD | regulation of mitochondrion organization | 57/3918 | 144/18723 | 2.43e-07 | 9.92e-06 | 57 |
| GO:0009636 | Colorectum | AD | response to toxic substance | 88/3918 | 262/18723 | 1.12e-06 | 3.72e-05 | 88 |
| GO:0043087 | Colorectum | AD | regulation of GTPase activity | 110/3918 | 348/18723 | 1.64e-06 | 5.03e-05 | 110 |
| GO:0007265 | Colorectum | AD | Ras protein signal transduction | 104/3918 | 337/18723 | 1.01e-05 | 2.35e-04 | 104 |
| GO:0010822 | Colorectum | AD | positive regulation of mitochondrion organization | 32/3918 | 74/18723 | 1.22e-05 | 2.68e-04 | 32 |
| GO:0051056 | Colorectum | AD | regulation of small GTPase mediated signal transduction | 94/3918 | 302/18723 | 1.81e-05 | 3.76e-04 | 94 |
| GO:0098754 | Colorectum | AD | detoxification | 53/3918 | 152/18723 | 4.63e-05 | 7.98e-04 | 53 |
| GO:0043547 | Colorectum | AD | positive regulation of GTPase activity | 75/3918 | 255/18723 | 7.95e-04 | 7.91e-03 | 75 |
| GO:0046578 | Colorectum | AD | regulation of Ras protein signal transduction | 56/3918 | 189/18723 | 2.85e-03 | 2.14e-02 | 56 |
| GO:0007266 | Colorectum | AD | Rho protein signal transduction | 42/3918 | 137/18723 | 4.64e-03 | 3.16e-02 | 42 |
| GO:00510562 | Colorectum | FAP | regulation of small GTPase mediated signal transduction | 78/2622 | 302/18723 | 3.25e-08 | 2.85e-06 | 78 |
| GO:00430873 | Colorectum | FAP | regulation of GTPase activity | 85/2622 | 348/18723 | 1.20e-07 | 7.68e-06 | 85 |
| GO:00072652 | Colorectum | FAP | Ras protein signal transduction | 80/2622 | 337/18723 | 9.61e-07 | 4.33e-05 | 80 |
| GO:00435472 | Colorectum | FAP | positive regulation of GTPase activity | 61/2622 | 255/18723 | 1.39e-05 | 3.73e-04 | 61 |
| GO:00465781 | Colorectum | FAP | regulation of Ras protein signal transduction | 47/2622 | 189/18723 | 4.67e-05 | 9.60e-04 | 47 |
| GO:00072661 | Colorectum | FAP | Rho protein signal transduction | 34/2622 | 137/18723 | 5.11e-04 | 5.82e-03 | 34 |
| GO:00108213 | Colorectum | FAP | regulation of mitochondrion organization | 35/2622 | 144/18723 | 6.44e-04 | 7.05e-03 | 35 |
| GO:0035023 | Colorectum | FAP | regulation of Rho protein signal transduction | 22/2622 | 86/18723 | 3.11e-03 | 2.33e-02 | 22 |
| GO:00096363 | Colorectum | FAP | response to toxic substance | 53/2622 | 262/18723 | 3.35e-03 | 2.46e-02 | 53 |
| GO:00510563 | Colorectum | CRC | regulation of small GTPase mediated signal transduction | 69/2078 | 302/18723 | 3.34e-09 | 9.08e-07 | 69 |
| Page: 1 2 3 4 5 6 7 |
| Pathway ID | Tissue | Disease Stage | Description | Gene Ratio | Bg Ratio | pvalue | p.adjust | qvalue | Count |
| hsa05212 | Colorectum | AD | Pancreatic cancer | 29/2092 | 76/8465 | 6.25e-03 | 2.68e-02 | 1.71e-02 | 29 |
| hsa052121 | Colorectum | AD | Pancreatic cancer | 29/2092 | 76/8465 | 6.25e-03 | 2.68e-02 | 1.71e-02 | 29 |
| hsa052124 | Colorectum | FAP | Pancreatic cancer | 24/1404 | 76/8465 | 8.95e-04 | 5.20e-03 | 3.16e-03 | 24 |
| hsa052125 | Colorectum | FAP | Pancreatic cancer | 24/1404 | 76/8465 | 8.95e-04 | 5.20e-03 | 3.16e-03 | 24 |
| hsa04014 | Colorectum | CRC | Ras signaling pathway | 49/1091 | 236/8465 | 4.04e-04 | 4.50e-03 | 3.05e-03 | 49 |
| hsa040141 | Colorectum | CRC | Ras signaling pathway | 49/1091 | 236/8465 | 4.04e-04 | 4.50e-03 | 3.05e-03 | 49 |
| hsa0521216 | Esophagus | ESCC | Pancreatic cancer | 62/4205 | 76/8465 | 7.37e-09 | 6.85e-08 | 3.51e-08 | 62 |
| hsa0521217 | Esophagus | ESCC | Pancreatic cancer | 62/4205 | 76/8465 | 7.37e-09 | 6.85e-08 | 3.51e-08 | 62 |
| hsa052126 | Liver | Cirrhotic | Pancreatic cancer | 34/2530 | 76/8465 | 4.20e-03 | 1.63e-02 | 1.00e-02 | 34 |
| hsa0521211 | Liver | Cirrhotic | Pancreatic cancer | 34/2530 | 76/8465 | 4.20e-03 | 1.63e-02 | 1.00e-02 | 34 |
| hsa0521221 | Liver | HCC | Pancreatic cancer | 54/4020 | 76/8465 | 2.50e-05 | 1.64e-04 | 9.12e-05 | 54 |
| hsa0521231 | Liver | HCC | Pancreatic cancer | 54/4020 | 76/8465 | 2.50e-05 | 1.64e-04 | 9.12e-05 | 54 |
| hsa0521210 | Oral cavity | OSCC | Pancreatic cancer | 60/3704 | 76/8465 | 3.32e-10 | 4.45e-09 | 2.26e-09 | 60 |
| hsa0521215 | Oral cavity | OSCC | Pancreatic cancer | 60/3704 | 76/8465 | 3.32e-10 | 4.45e-09 | 2.26e-09 | 60 |
| hsa0521223 | Oral cavity | LP | Pancreatic cancer | 40/2418 | 76/8465 | 8.08e-06 | 6.11e-05 | 3.94e-05 | 40 |
| hsa0521233 | Oral cavity | LP | Pancreatic cancer | 40/2418 | 76/8465 | 8.08e-06 | 6.11e-05 | 3.94e-05 | 40 |
| hsa052129 | Prostate | BPH | Pancreatic cancer | 31/1718 | 76/8465 | 3.36e-05 | 2.47e-04 | 1.53e-04 | 31 |
| hsa0521214 | Prostate | BPH | Pancreatic cancer | 31/1718 | 76/8465 | 3.36e-05 | 2.47e-04 | 1.53e-04 | 31 |
| hsa0521222 | Prostate | Tumor | Pancreatic cancer | 33/1791 | 76/8465 | 9.72e-06 | 8.05e-05 | 4.99e-05 | 33 |
| hsa0521232 | Prostate | Tumor | Pancreatic cancer | 33/1791 | 76/8465 | 9.72e-06 | 8.05e-05 | 4.99e-05 | 33 |
| Page: 1 |
Top |
Cell-cell communication analysis |
| Identification of potential cell-cell interactions between two cell types and their ligand-receptor pairs for different disease states |
| Ligand | Receptor | LRpair | Pathway | Tissue | Disease Stage |
| Page: 1 |
Top |
Single-cell gene regulatory network inference analysis |
| Find out the significant the regulons (TFs) and the target genes of each regulon across cell types for different disease states |
| TF | Cell Type | Tissue | Disease Stage | Target Gene | RSS | Regulon Activity |
| ∗The dot plots of a searched regulon are shown for all cell subpopulations in each disease state of each tissue based on the regulon specific score inferred using pySCENIC and by calculating the average expression. |
| Page: 1 |
Top |
Somatic mutation of malignant transformation related genes |
| Annotation of somatic variants for genes involved in malignant transformation |
| Hugo Symbol | Variant Class | Variant Classification | dbSNP RS | HGVSc | HGVSp | HGVSp Short | SWISSPROT | BIOTYPE | SIFT | PolyPhen | Tumor Sample Barcode | Tissue | Histology | Sex | Age | Stage | Therapy Types | Drugs | Outcome |
| RALBP1 | SNV | Missense_Mutation | novel | c.1744N>A | p.Glu582Lys | p.E582K | Q15311 | protein_coding | tolerated(0.05) | benign(0.111) | TCGA-5L-AAT1-01 | Breast | breast invasive carcinoma | Female | <65 | III/IV | Hormone Therapy | letrozol | SD |
| RALBP1 | SNV | Missense_Mutation | c.1316N>C | p.Leu439Pro | p.L439P | Q15311 | protein_coding | deleterious(0) | probably_damaging(0.999) | TCGA-AO-A128-01 | Breast | breast invasive carcinoma | Female | <65 | I/II | Chemotherapy | doxorubicin | SD | |
| RALBP1 | SNV | Missense_Mutation | c.1278A>C | p.Glu426Asp | p.E426D | Q15311 | protein_coding | tolerated(0.09) | benign(0.365) | TCGA-B6-A1KC-01 | Breast | breast invasive carcinoma | Female | >=65 | I/II | Unknown | Unknown | SD | |
| RALBP1 | insertion | Nonsense_Mutation | novel | c.360_361insTCATTCCATTAGCCCTCTATGTAGAGCCTTTCAGGTGT | p.Lys121SerfsTer4 | p.K121Sfs*4 | Q15311 | protein_coding | TCGA-A8-A06U-01 | Breast | breast invasive carcinoma | Female | >=65 | I/II | Unknown | Unknown | SD | ||
| RALBP1 | SNV | Missense_Mutation | rs780034442 | c.47N>A | p.Arg16His | p.R16H | Q15311 | protein_coding | tolerated_low_confidence(0.16) | benign(0.011) | TCGA-2W-A8YY-01 | Cervix | cervical & endocervical cancer | Female | <65 | I/II | Chemotherapy | cisplatin | CR |
| RALBP1 | SNV | Missense_Mutation | novel | c.1348N>C | p.Glu450Gln | p.E450Q | Q15311 | protein_coding | tolerated(0.16) | benign(0.035) | TCGA-2W-A8YY-01 | Cervix | cervical & endocervical cancer | Female | <65 | I/II | Chemotherapy | cisplatin | CR |
| RALBP1 | SNV | Missense_Mutation | novel | c.956N>A | p.Ser319Tyr | p.S319Y | Q15311 | protein_coding | deleterious(0) | probably_damaging(0.966) | TCGA-C5-A8ZZ-01 | Cervix | cervical & endocervical cancer | Female | <65 | I/II | Unspecific | Cisplatin | SD |
| RALBP1 | SNV | Missense_Mutation | c.1825N>A | p.Glu609Lys | p.E609K | Q15311 | protein_coding | tolerated_low_confidence(0.25) | benign(0.026) | TCGA-IR-A3LK-01 | Cervix | cervical & endocervical cancer | Female | >=65 | I/II | Chemotherapy | cisplatin | PD | |
| RALBP1 | SNV | Missense_Mutation | novel | c.742N>C | p.Asp248His | p.D248H | Q15311 | protein_coding | deleterious(0.01) | probably_damaging(0.998) | TCGA-MA-AA3Z-01 | Cervix | cervical & endocervical cancer | Female | <65 | I/II | Unknown | Unknown | SD |
| RALBP1 | SNV | Missense_Mutation | c.892N>A | p.Glu298Lys | p.E298K | Q15311 | protein_coding | tolerated(0.2) | probably_damaging(0.998) | TCGA-Q1-A5R2-01 | Cervix | cervical & endocervical cancer | Female | <65 | I/II | Chemotherapy | cisplatin | PR |
| Page: 1 2 3 4 5 6 7 8 |
Top |
Related drugs of malignant transformation related genes |
| Identification of chemicals and drugs interact with genes involved in malignant transfromation |
| (DGIdb 4.0) |
| Entrez ID | Symbol | Category | Interaction Types | Drug Claim Name | Drug Name | PMIDs |
| 10928 | RALBP1 | TRANSPORTER, ABC TRANSPORTER | carbamazepine | CARBAMAZEPINE | 21738081 | |
| 10928 | RALBP1 | TRANSPORTER, ABC TRANSPORTER | DOX | 12632060 | ||
| 10928 | RALBP1 | TRANSPORTER, ABC TRANSPORTER | vincristine | VINCRISTINE | 27180762 |
| Page: 1 |

Copyright 2023-Present -The University of Texas Health Science Center at Houston |