
|
|||||
|
 | |
| |
| |
| |
| |
| |
|
Gene: RAI1 |
Gene summary for RAI1 |
| Gene information | Species | Human | Gene symbol | RAI1 | Gene ID | 10743 |
| Gene name | retinoic acid induced 1 | |
| Gene Alias | SMCR | |
| Cytomap | 17p11.2 | |
| Gene Type | protein-coding | GO ID | GO:0001501 | UniProtAcc | Q7Z5J4 |
Top |
Malignant transformation analysis |
| Identification of the aberrant gene expression in precancerous and cancerous lesions by comparing the gene expression of stem-like cells in diseased tissues with normal stem cells |
| Entrez ID | Symbol | Replicates | Species | Organ | Tissue | Adj P-value | Log2FC | Malignancy |
| 10743 | RAI1 | CCI_1 | Human | Cervix | CC | 2.94e-05 | 7.50e-01 | 0.528 |
| 10743 | RAI1 | CCI_2 | Human | Cervix | CC | 7.34e-10 | 1.05e+00 | 0.5249 |
| 10743 | RAI1 | CCI_3 | Human | Cervix | CC | 2.17e-06 | 6.29e-01 | 0.516 |
| 10743 | RAI1 | LZE2T | Human | Esophagus | ESCC | 4.78e-02 | 4.22e-01 | 0.082 |
| 10743 | RAI1 | LZE24T | Human | Esophagus | ESCC | 8.64e-07 | 1.39e-01 | 0.0596 |
| 10743 | RAI1 | LZE21T | Human | Esophagus | ESCC | 4.41e-06 | 1.82e-01 | 0.0655 |
| 10743 | RAI1 | P1T-E | Human | Esophagus | ESCC | 2.65e-05 | 1.20e-01 | 0.0875 |
| 10743 | RAI1 | P2T-E | Human | Esophagus | ESCC | 2.31e-10 | 9.17e-02 | 0.1177 |
| 10743 | RAI1 | P4T-E | Human | Esophagus | ESCC | 1.37e-08 | 1.52e-01 | 0.1323 |
| 10743 | RAI1 | P8T-E | Human | Esophagus | ESCC | 3.79e-15 | 2.35e-01 | 0.0889 |
| 10743 | RAI1 | P9T-E | Human | Esophagus | ESCC | 1.38e-06 | 1.07e-01 | 0.1131 |
| 10743 | RAI1 | P10T-E | Human | Esophagus | ESCC | 7.10e-18 | 1.96e-01 | 0.116 |
| 10743 | RAI1 | P11T-E | Human | Esophagus | ESCC | 7.23e-07 | 6.77e-02 | 0.1426 |
| 10743 | RAI1 | P12T-E | Human | Esophagus | ESCC | 4.15e-09 | 7.09e-02 | 0.1122 |
| 10743 | RAI1 | P15T-E | Human | Esophagus | ESCC | 2.43e-11 | 1.34e-01 | 0.1149 |
| 10743 | RAI1 | P16T-E | Human | Esophagus | ESCC | 1.00e-05 | 3.18e-02 | 0.1153 |
| 10743 | RAI1 | P17T-E | Human | Esophagus | ESCC | 3.83e-05 | 5.04e-02 | 0.1278 |
| 10743 | RAI1 | P20T-E | Human | Esophagus | ESCC | 1.10e-12 | 6.84e-02 | 0.1124 |
| 10743 | RAI1 | P21T-E | Human | Esophagus | ESCC | 1.86e-10 | 1.12e-01 | 0.1617 |
| 10743 | RAI1 | P22T-E | Human | Esophagus | ESCC | 1.63e-15 | 1.09e-01 | 0.1236 |
| Page: 1 2 3 |
| Tissue | Expression Dynamics | Abbreviation |
| Cervix |  | CC: Cervix cancer |
| HSIL_HPV: HPV-infected high-grade squamous intraepithelial lesions | ||
| N_HPV: HPV-infected normal cervix | ||
| Esophagus | 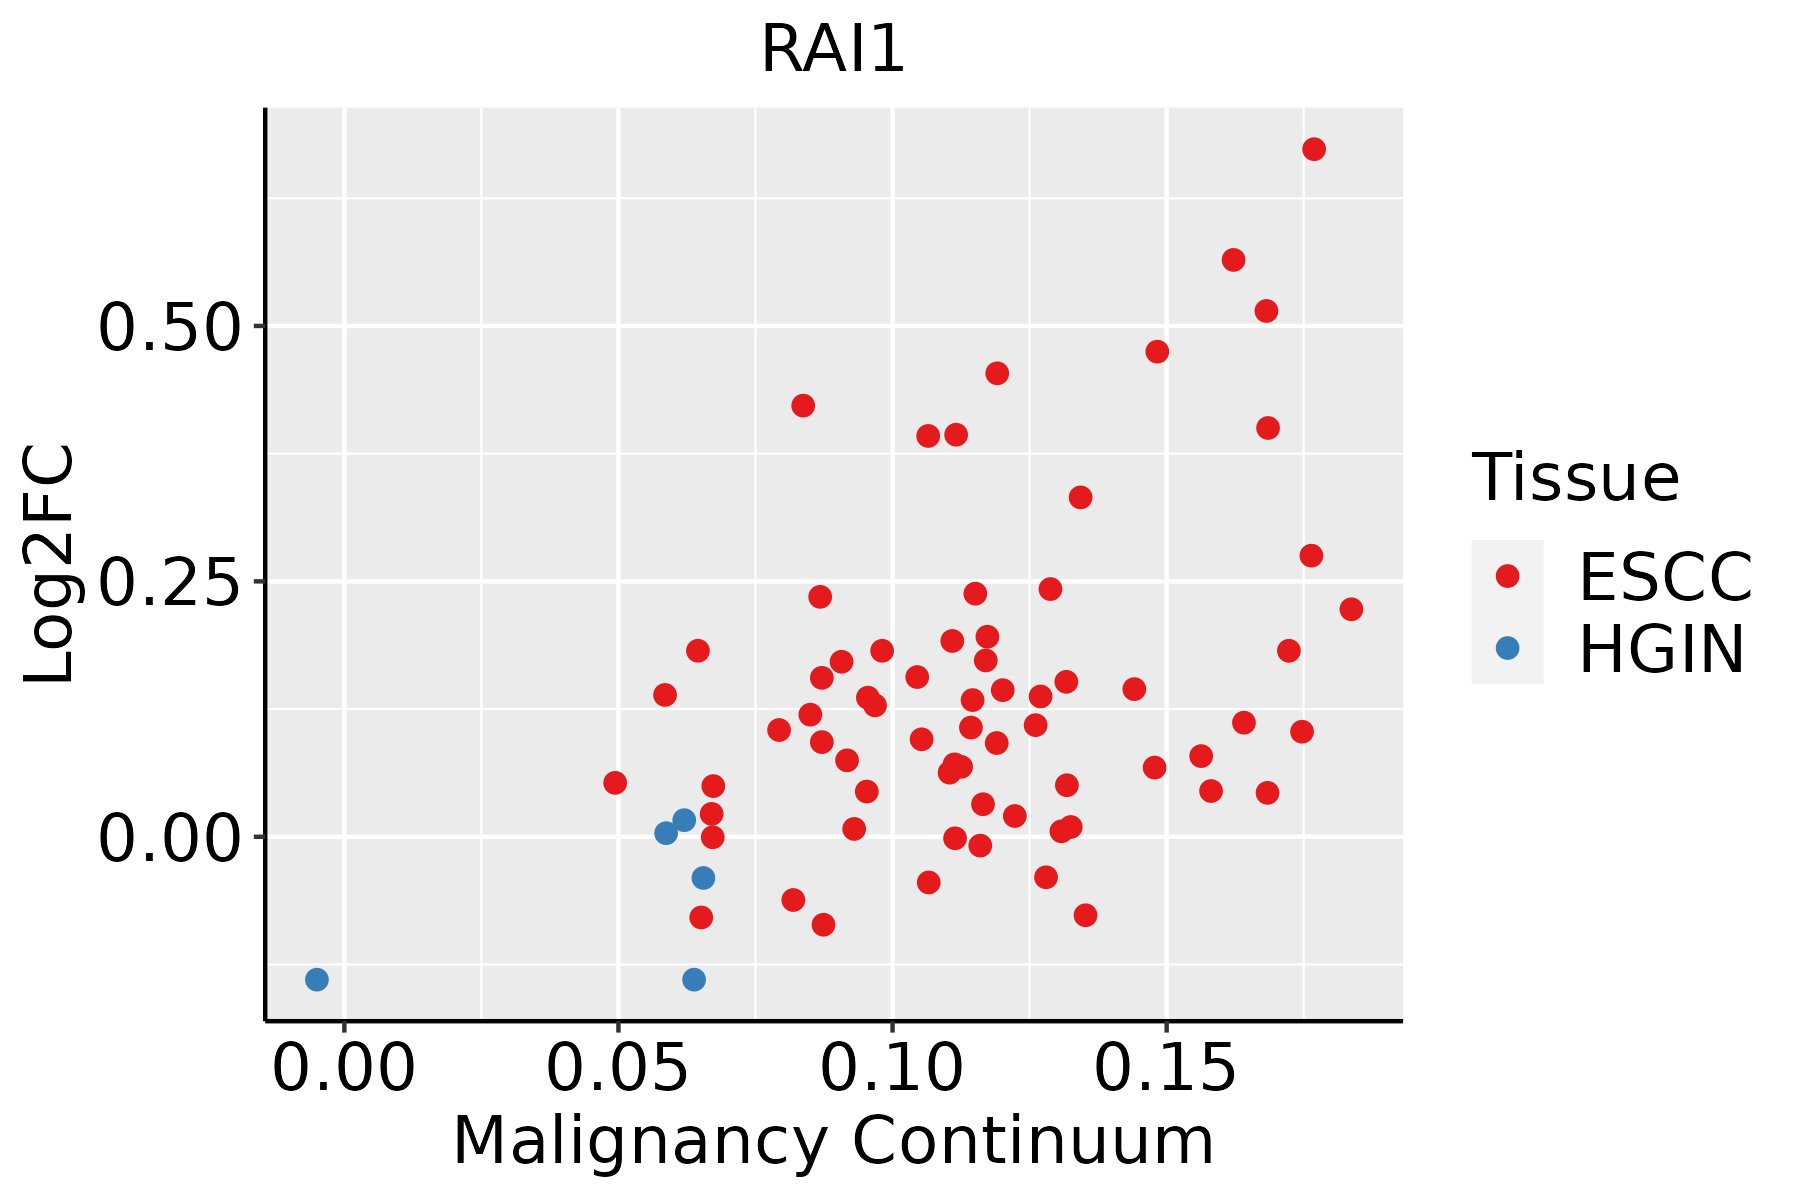 | ESCC: Esophageal squamous cell carcinoma |
| HGIN: High-grade intraepithelial neoplasias | ||
| LGIN: Low-grade intraepithelial neoplasias |
| ∗log2FC in expression of this searched gene in stem-like cells from each diseased tissue sample relative to stem-like cells in normal samples in each tissue plotted against the malignancy continuum. Samples are colored based on if they are from different disease stage. |
Top |
Malignant transformation related pathway analysis |
| Find out the enriched GO biological processes and KEGG pathways involved in transition from healthy to precancer to cancer |
| Tissue | Disease Stage | Enriched GO biological Processes |
| Colorectum | AD |  |
| Colorectum | SER |  |
| Colorectum | MSS |  |
| Colorectum | MSI-H |  |
| Colorectum | FAP |  |
| ∗Top 15 enriched GO BP terms are showed in the bar plot of each disease state in each tissue. Each row represents a significant GO biological process which is colored according to the -log10(p.adjust). |
| Page: 1 2 3 4 5 6 7 8 9 |
| GO ID | Tissue | Disease Stage | Description | Gene Ratio | Bg Ratio | pvalue | p.adjust | Count |
| GO:00485118 | Cervix | CC | rhythmic process | 65/2311 | 298/18723 | 2.79e-06 | 8.04e-05 | 65 |
| GO:00076238 | Cervix | CC | circadian rhythm | 46/2311 | 210/18723 | 6.76e-05 | 9.60e-04 | 46 |
| GO:00486386 | Cervix | CC | regulation of developmental growth | 61/2311 | 330/18723 | 7.69e-04 | 6.85e-03 | 61 |
| GO:00329226 | Cervix | CC | circadian regulation of gene expression | 18/2311 | 68/18723 | 1.18e-03 | 9.56e-03 | 18 |
| GO:0048732 | Colorectum | AD | gland development | 149/3918 | 436/18723 | 6.07e-11 | 6.33e-09 | 149 |
| GO:0030879 | Colorectum | AD | mammary gland development | 53/3918 | 137/18723 | 1.46e-06 | 4.58e-05 | 53 |
| GO:0061180 | Colorectum | AD | mammary gland epithelium development | 28/3918 | 67/18723 | 8.74e-05 | 1.35e-03 | 28 |
| GO:00487321 | Colorectum | SER | gland development | 112/2897 | 436/18723 | 1.75e-08 | 1.28e-06 | 112 |
| GO:00611801 | Colorectum | SER | mammary gland epithelium development | 22/2897 | 67/18723 | 3.11e-04 | 5.03e-03 | 22 |
| GO:00308791 | Colorectum | SER | mammary gland development | 37/2897 | 137/18723 | 3.61e-04 | 5.61e-03 | 37 |
| GO:00487322 | Colorectum | MSS | gland development | 143/3467 | 436/18723 | 3.85e-13 | 8.01e-11 | 143 |
| GO:00308792 | Colorectum | MSS | mammary gland development | 51/3467 | 137/18723 | 1.88e-07 | 8.26e-06 | 51 |
| GO:00611802 | Colorectum | MSS | mammary gland epithelium development | 28/3467 | 67/18723 | 8.47e-06 | 2.11e-04 | 28 |
| GO:0051349 | Colorectum | MSS | positive regulation of lyase activity | 10/3467 | 23/18723 | 5.06e-03 | 3.47e-02 | 10 |
| GO:00487323 | Colorectum | MSI-H | gland development | 53/1319 | 436/18723 | 7.08e-05 | 2.35e-03 | 53 |
| GO:0048732111 | Esophagus | ESCC | gland development | 269/8552 | 436/18723 | 7.81e-12 | 2.95e-10 | 269 |
| GO:00459267 | Esophagus | ESCC | negative regulation of growth | 148/8552 | 249/18723 | 7.88e-06 | 7.73e-05 | 148 |
| GO:003292215 | Esophagus | ESCC | circadian regulation of gene expression | 48/8552 | 68/18723 | 2.76e-05 | 2.30e-04 | 48 |
| GO:003087914 | Esophagus | ESCC | mammary gland development | 85/8552 | 137/18723 | 8.11e-05 | 6.01e-04 | 85 |
| GO:00352647 | Esophagus | ESCC | multicellular organism growth | 80/8552 | 132/18723 | 3.84e-04 | 2.22e-03 | 80 |
| Page: 1 2 |
| Pathway ID | Tissue | Disease Stage | Description | Gene Ratio | Bg Ratio | pvalue | p.adjust | qvalue | Count |
| Page: 1 |
Top |
Cell-cell communication analysis |
| Identification of potential cell-cell interactions between two cell types and their ligand-receptor pairs for different disease states |
| Ligand | Receptor | LRpair | Pathway | Tissue | Disease Stage |
| Page: 1 |
Top |
Single-cell gene regulatory network inference analysis |
| Find out the significant the regulons (TFs) and the target genes of each regulon across cell types for different disease states |
| TF | Cell Type | Tissue | Disease Stage | Target Gene | RSS | Regulon Activity |
| ∗The dot plots of a searched regulon are shown for all cell subpopulations in each disease state of each tissue based on the regulon specific score inferred using pySCENIC and by calculating the average expression. |
| Page: 1 |
Top |
Somatic mutation of malignant transformation related genes |
| Annotation of somatic variants for genes involved in malignant transformation |
| Hugo Symbol | Variant Class | Variant Classification | dbSNP RS | HGVSc | HGVSp | HGVSp Short | SWISSPROT | BIOTYPE | SIFT | PolyPhen | Tumor Sample Barcode | Tissue | Histology | Sex | Age | Stage | Therapy Types | Drugs | Outcome |
| RAI1 | SNV | Missense_Mutation | c.2854G>T | p.Gly952Cys | p.G952C | Q7Z5J4 | protein_coding | deleterious(0.02) | possibly_damaging(0.594) | TCGA-A7-A0CE-01 | Breast | breast invasive carcinoma | Female | <65 | I/II | Chemotherapy | adriamycin | SD | |
| RAI1 | SNV | Missense_Mutation | novel | c.2855G>C | p.Gly952Ala | p.G952A | Q7Z5J4 | protein_coding | tolerated(0.22) | benign(0.049) | TCGA-A7-A0CE-01 | Breast | breast invasive carcinoma | Female | <65 | I/II | Chemotherapy | adriamycin | SD |
| RAI1 | SNV | Missense_Mutation | c.4124N>T | p.Pro1375Leu | p.P1375L | Q7Z5J4 | protein_coding | tolerated(0.2) | benign(0) | TCGA-A8-A08H-01 | Breast | breast invasive carcinoma | Female | >=65 | I/II | Unknown | Unknown | SD | |
| RAI1 | SNV | Missense_Mutation | novel | c.2167N>G | p.Thr723Ala | p.T723A | Q7Z5J4 | protein_coding | tolerated(1) | benign(0) | TCGA-AC-A3TM-01 | Breast | breast invasive carcinoma | Female | <65 | III/IV | Chemotherapy | cytoxan | CR |
| RAI1 | SNV | Missense_Mutation | novel | c.4181C>A | p.Ser1394Tyr | p.S1394Y | Q7Z5J4 | protein_coding | tolerated(0.06) | benign(0.087) | TCGA-AC-A8OP-01 | Breast | breast invasive carcinoma | Female | >=65 | I/II | Unknown | Unknown | SD |
| RAI1 | SNV | Missense_Mutation | c.1283N>T | p.Ser428Leu | p.S428L | Q7Z5J4 | protein_coding | deleterious(0) | probably_damaging(0.987) | TCGA-AO-A0J9-01 | Breast | breast invasive carcinoma | Female | <65 | III/IV | Chemotherapy | cyclophosphamide | PD | |
| RAI1 | SNV | Missense_Mutation | novel | c.4335N>T | p.Lys1445Asn | p.K1445N | Q7Z5J4 | protein_coding | deleterious(0) | possibly_damaging(0.879) | TCGA-BH-A0B6-01 | Breast | breast invasive carcinoma | Female | <65 | I/II | Unknown | Unknown | SD |
| RAI1 | SNV | Missense_Mutation | novel | c.3206N>T | p.Pro1069Leu | p.P1069L | Q7Z5J4 | protein_coding | tolerated(0.18) | possibly_damaging(0.879) | TCGA-C8-A1HM-01 | Breast | breast invasive carcinoma | Female | >=65 | I/II | Chemotherapy | doxorubicin | CR |
| RAI1 | SNV | Missense_Mutation | novel | c.1855N>T | p.Gly619Cys | p.G619C | Q7Z5J4 | protein_coding | deleterious(0.02) | possibly_damaging(0.466) | TCGA-LL-A7SZ-01 | Breast | breast invasive carcinoma | Female | <65 | I/II | Chemotherapy | adriamycin | CR |
| RAI1 | insertion | In_Frame_Ins | novel | c.4768_4769insCTT | p.Ser1590delinsThrCys | p.S1590delinsTC | Q7Z5J4 | protein_coding | TCGA-AN-A0FF-01 | Breast | breast invasive carcinoma | Female | <65 | I/II | Unknown | Unknown | SD |
| Page: 1 2 3 4 5 6 7 8 9 10 11 12 13 14 15 16 17 |
Top |
Related drugs of malignant transformation related genes |
| Identification of chemicals and drugs interact with genes involved in malignant transfromation |
| (DGIdb 4.0) |
| Entrez ID | Symbol | Category | Interaction Types | Drug Claim Name | Drug Name | PMIDs |
| Page: 1 |

Copyright 2023-Present -The University of Texas Health Science Center at Houston |