
|
|||||
|
 | |
| |
| |
| |
| |
| |
|
Gene: RAET1G |
Gene summary for RAET1G |
| Gene information | Species | Human | Gene symbol | RAET1G | Gene ID | 353091 |
| Gene name | retinoic acid early transcript 1G | |
| Gene Alias | ULBP5 | |
| Cytomap | 6q25.1 | |
| Gene Type | protein-coding | GO ID | GO:0001816 | UniProtAcc | Q6H3X3 |
Top |
Malignant transformation analysis |
| Identification of the aberrant gene expression in precancerous and cancerous lesions by comparing the gene expression of stem-like cells in diseased tissues with normal stem cells |
| Entrez ID | Symbol | Replicates | Species | Organ | Tissue | Adj P-value | Log2FC | Malignancy |
| 353091 | RAET1G | C04 | Human | Oral cavity | OSCC | 3.88e-10 | 5.14e-01 | 0.2633 |
| 353091 | RAET1G | C21 | Human | Oral cavity | OSCC | 1.66e-17 | 7.48e-01 | 0.2678 |
| 353091 | RAET1G | C30 | Human | Oral cavity | OSCC | 9.91e-20 | 9.64e-01 | 0.3055 |
| 353091 | RAET1G | C51 | Human | Oral cavity | OSCC | 1.14e-08 | 5.01e-01 | 0.2674 |
| 353091 | RAET1G | C06 | Human | Oral cavity | OSCC | 5.79e-11 | 1.71e+00 | 0.2699 |
| 353091 | RAET1G | SYSMH3 | Human | Oral cavity | OSCC | 4.94e-12 | 2.23e-01 | 0.2442 |
| 353091 | RAET1G | SYSMH5 | Human | Oral cavity | OSCC | 1.23e-02 | 3.96e-02 | 0.0647 |
| Page: 1 |
| Tissue | Expression Dynamics | Abbreviation |
| Oral Cavity | 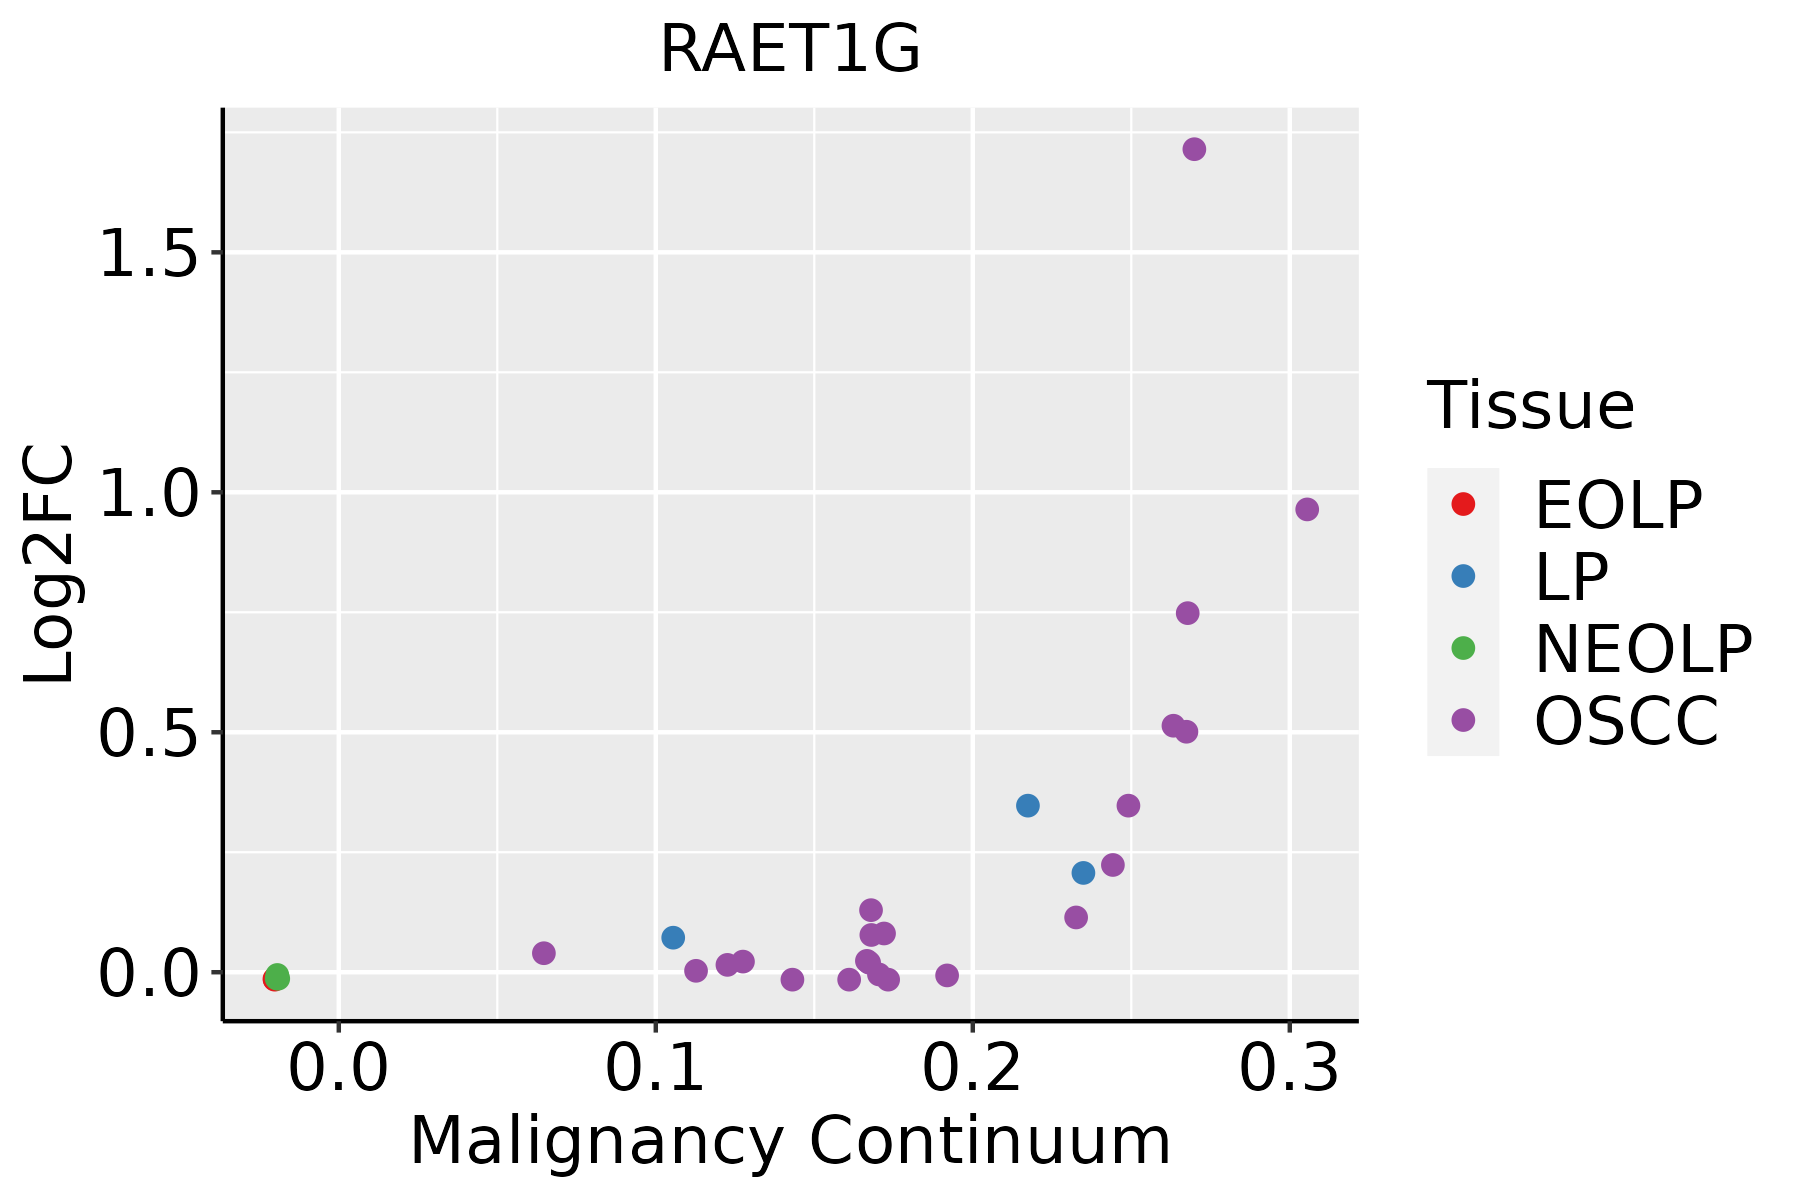 | EOLP: Erosive Oral lichen planus |
| LP: leukoplakia | ||
| NEOLP: Non-erosive oral lichen planus | ||
| OSCC: Oral squamous cell carcinoma |
| ∗log2FC in expression of this searched gene in stem-like cells from each diseased tissue sample relative to stem-like cells in normal samples in each tissue plotted against the malignancy continuum. Samples are colored based on if they are from different disease stage. |
Top |
Malignant transformation related pathway analysis |
| Find out the enriched GO biological processes and KEGG pathways involved in transition from healthy to precancer to cancer |
| Tissue | Disease Stage | Enriched GO biological Processes |
| Colorectum | AD |  |
| Colorectum | SER |  |
| Colorectum | MSS |  |
| Colorectum | MSI-H |  |
| Colorectum | FAP |  |
| ∗Top 15 enriched GO BP terms are showed in the bar plot of each disease state in each tissue. Each row represents a significant GO biological process which is colored according to the -log10(p.adjust). |
| Page: 1 2 3 4 5 6 7 8 9 |
| GO ID | Tissue | Disease Stage | Description | Gene Ratio | Bg Ratio | pvalue | p.adjust | Count |
| GO:00028317 | Oral cavity | OSCC | regulation of response to biotic stimulus | 177/7305 | 327/18723 | 1.73e-08 | 3.43e-07 | 177 |
| GO:00450884 | Oral cavity | OSCC | regulation of innate immune response | 116/7305 | 218/18723 | 1.36e-05 | 1.37e-04 | 116 |
| GO:00321037 | Oral cavity | OSCC | positive regulation of response to external stimulus | 203/7305 | 427/18723 | 1.79e-04 | 1.22e-03 | 203 |
| GO:000181910 | Oral cavity | OSCC | positive regulation of cytokine production | 213/7305 | 467/18723 | 1.93e-03 | 8.96e-03 | 213 |
| GO:00027022 | Oral cavity | OSCC | positive regulation of production of molecular mediator of immune response | 58/7305 | 117/18723 | 1.28e-02 | 4.27e-02 | 58 |
| GO:00313495 | Oral cavity | OSCC | positive regulation of defense response | 127/7305 | 278/18723 | 1.32e-02 | 4.39e-02 | 127 |
| Page: 1 |
| Pathway ID | Tissue | Disease Stage | Description | Gene Ratio | Bg Ratio | pvalue | p.adjust | qvalue | Count |
| Page: 1 |
Top |
Cell-cell communication analysis |
| Identification of potential cell-cell interactions between two cell types and their ligand-receptor pairs for different disease states |
| Ligand | Receptor | LRpair | Pathway | Tissue | Disease Stage |
| RAET1G | KLRK1 | RAET1G_KLRK1 | MHC-I | HNSCC | Precancer |
| Page: 1 |
Top |
Single-cell gene regulatory network inference analysis |
| Find out the significant the regulons (TFs) and the target genes of each regulon across cell types for different disease states |
| TF | Cell Type | Tissue | Disease Stage | Target Gene | RSS | Regulon Activity |
| ∗The dot plots of a searched regulon are shown for all cell subpopulations in each disease state of each tissue based on the regulon specific score inferred using pySCENIC and by calculating the average expression. |
| Page: 1 |
Top |
Somatic mutation of malignant transformation related genes |
| Annotation of somatic variants for genes involved in malignant transformation |
| Hugo Symbol | Variant Class | Variant Classification | dbSNP RS | HGVSc | HGVSp | HGVSp Short | SWISSPROT | BIOTYPE | SIFT | PolyPhen | Tumor Sample Barcode | Tissue | Histology | Sex | Age | Stage | Therapy Types | Drugs | Outcome |
| RAET1G | SNV | Missense_Mutation | c.441N>G | p.Ile147Met | p.I147M | Q6H3X3 | protein_coding | tolerated(0.61) | benign(0.349) | TCGA-JW-A5VL-01 | Cervix | cervical & endocervical cancer | Female | <65 | I/II | Unknown | Unknown | SD | |
| RAET1G | SNV | Missense_Mutation | c.889N>T | p.Val297Leu | p.V297L | Q6H3X3 | protein_coding | deleterious_low_confidence(0) | benign(0.167) | TCGA-R2-A69V-01 | Cervix | cervical & endocervical cancer | Female | <65 | I/II | Chemotherapy | cisplatin | SD | |
| RAET1G | SNV | Missense_Mutation | novel | c.598N>T | p.Gly200Cys | p.G200C | Q6H3X3 | protein_coding | tolerated(0.23) | benign(0.066) | TCGA-AA-3947-01 | Colorectum | colon adenocarcinoma | Female | <65 | I/II | Unknown | Unknown | SD |
| RAET1G | SNV | Missense_Mutation | c.854N>T | p.Ala285Val | p.A285V | Q6H3X3 | protein_coding | deleterious_low_confidence(0.01) | benign(0.009) | TCGA-G4-6586-01 | Colorectum | colon adenocarcinoma | Female | >=65 | I/II | Unknown | Unknown | SD | |
| RAET1G | SNV | Missense_Mutation | novel | c.1001C>A | p.Ser334Tyr | p.S334Y | Q6H3X3 | protein_coding | deleterious_low_confidence(0) | benign(0.029) | TCGA-F5-6814-01 | Colorectum | rectum adenocarcinoma | Male | <65 | I/II | Unknown | Unknown | SD |
| RAET1G | SNV | Missense_Mutation | novel | c.512A>G | p.Lys171Arg | p.K171R | Q6H3X3 | protein_coding | tolerated(0.14) | possibly_damaging(0.489) | TCGA-F5-6814-01 | Colorectum | rectum adenocarcinoma | Male | <65 | I/II | Unknown | Unknown | SD |
| RAET1G | SNV | Missense_Mutation | c.519N>T | p.Glu173Asp | p.E173D | Q6H3X3 | protein_coding | tolerated(0.08) | benign(0.237) | TCGA-A5-A2K5-01 | Endometrium | uterine corpus endometrioid carcinoma | Female | >=65 | I/II | Unknown | Unknown | SD | |
| RAET1G | SNV | Missense_Mutation | novel | c.177N>T | p.Lys59Asn | p.K59N | Q6H3X3 | protein_coding | tolerated(0.27) | benign(0.113) | TCGA-A5-A2K5-01 | Endometrium | uterine corpus endometrioid carcinoma | Female | >=65 | I/II | Unknown | Unknown | SD |
| RAET1G | SNV | Missense_Mutation | novel | c.140N>T | p.Pro47Leu | p.P47L | Q6H3X3 | protein_coding | tolerated(0.05) | possibly_damaging(0.636) | TCGA-AJ-A3OL-01 | Endometrium | uterine corpus endometrioid carcinoma | Female | <65 | III/IV | Chemotherapy | carboplatin | PD |
| RAET1G | SNV | Missense_Mutation | novel | c.333N>T | p.Glu111Asp | p.E111D | Q6H3X3 | protein_coding | tolerated(0.08) | possibly_damaging(0.579) | TCGA-AP-A056-01 | Endometrium | uterine corpus endometrioid carcinoma | Female | <65 | I/II | Unknown | Unknown | SD |
| Page: 1 2 3 |
Top |
Related drugs of malignant transformation related genes |
| Identification of chemicals and drugs interact with genes involved in malignant transfromation |
| (DGIdb 4.0) |
| Entrez ID | Symbol | Category | Interaction Types | Drug Claim Name | Drug Name | PMIDs |
| Page: 1 |

Copyright 2023-Present -The University of Texas Health Science Center at Houston |