
|
|||||
|
 | |
| |
| |
| |
| |
| |
|
Gene: RAD9A |
Gene summary for RAD9A |
| Gene information | Species | Human | Gene symbol | RAD9A | Gene ID | 5883 |
| Gene name | RAD9 checkpoint clamp component A | |
| Gene Alias | RAD9 | |
| Cytomap | 11q13.2 | |
| Gene Type | protein-coding | GO ID | GO:0000075 | UniProtAcc | Q99638 |
Top |
Malignant transformation analysis |
| Identification of the aberrant gene expression in precancerous and cancerous lesions by comparing the gene expression of stem-like cells in diseased tissues with normal stem cells |
| Entrez ID | Symbol | Replicates | Species | Organ | Tissue | Adj P-value | Log2FC | Malignancy |
| 5883 | RAD9A | CCI_1 | Human | Cervix | CC | 2.60e-06 | 6.41e-01 | 0.528 |
| 5883 | RAD9A | CCI_2 | Human | Cervix | CC | 1.18e-06 | 5.64e-01 | 0.5249 |
| 5883 | RAD9A | CCI_3 | Human | Cervix | CC | 1.28e-02 | 3.35e-01 | 0.516 |
| 5883 | RAD9A | CCII_1 | Human | Cervix | CC | 1.11e-12 | 4.46e-01 | 0.3249 |
| 5883 | RAD9A | sample3 | Human | Cervix | CC | 1.06e-03 | 1.64e-01 | 0.1387 |
| 5883 | RAD9A | LZE2T | Human | Esophagus | ESCC | 1.15e-02 | 4.60e-01 | 0.082 |
| 5883 | RAD9A | LZE4T | Human | Esophagus | ESCC | 1.09e-10 | 2.54e-01 | 0.0811 |
| 5883 | RAD9A | LZE7T | Human | Esophagus | ESCC | 2.52e-05 | 3.76e-01 | 0.0667 |
| 5883 | RAD9A | LZE20T | Human | Esophagus | ESCC | 1.76e-10 | 3.82e-01 | 0.0662 |
| 5883 | RAD9A | LZE22D1 | Human | Esophagus | HGIN | 9.00e-05 | 2.19e-01 | 0.0595 |
| 5883 | RAD9A | LZE22T | Human | Esophagus | ESCC | 1.13e-03 | 3.08e-01 | 0.068 |
| 5883 | RAD9A | LZE24T | Human | Esophagus | ESCC | 8.46e-14 | 4.36e-01 | 0.0596 |
| 5883 | RAD9A | LZE6T | Human | Esophagus | ESCC | 1.16e-02 | 2.42e-01 | 0.0845 |
| 5883 | RAD9A | P1T-E | Human | Esophagus | ESCC | 7.08e-14 | 6.70e-01 | 0.0875 |
| 5883 | RAD9A | P2T-E | Human | Esophagus | ESCC | 5.39e-29 | 6.13e-01 | 0.1177 |
| 5883 | RAD9A | P4T-E | Human | Esophagus | ESCC | 1.65e-27 | 6.23e-01 | 0.1323 |
| 5883 | RAD9A | P5T-E | Human | Esophagus | ESCC | 4.21e-19 | 4.69e-01 | 0.1327 |
| 5883 | RAD9A | P8T-E | Human | Esophagus | ESCC | 4.76e-37 | 8.74e-01 | 0.0889 |
| 5883 | RAD9A | P9T-E | Human | Esophagus | ESCC | 1.85e-12 | 2.60e-01 | 0.1131 |
| 5883 | RAD9A | P10T-E | Human | Esophagus | ESCC | 5.00e-18 | 2.79e-01 | 0.116 |
| Page: 1 2 3 4 5 6 |
| Tissue | Expression Dynamics | Abbreviation |
| Cervix | 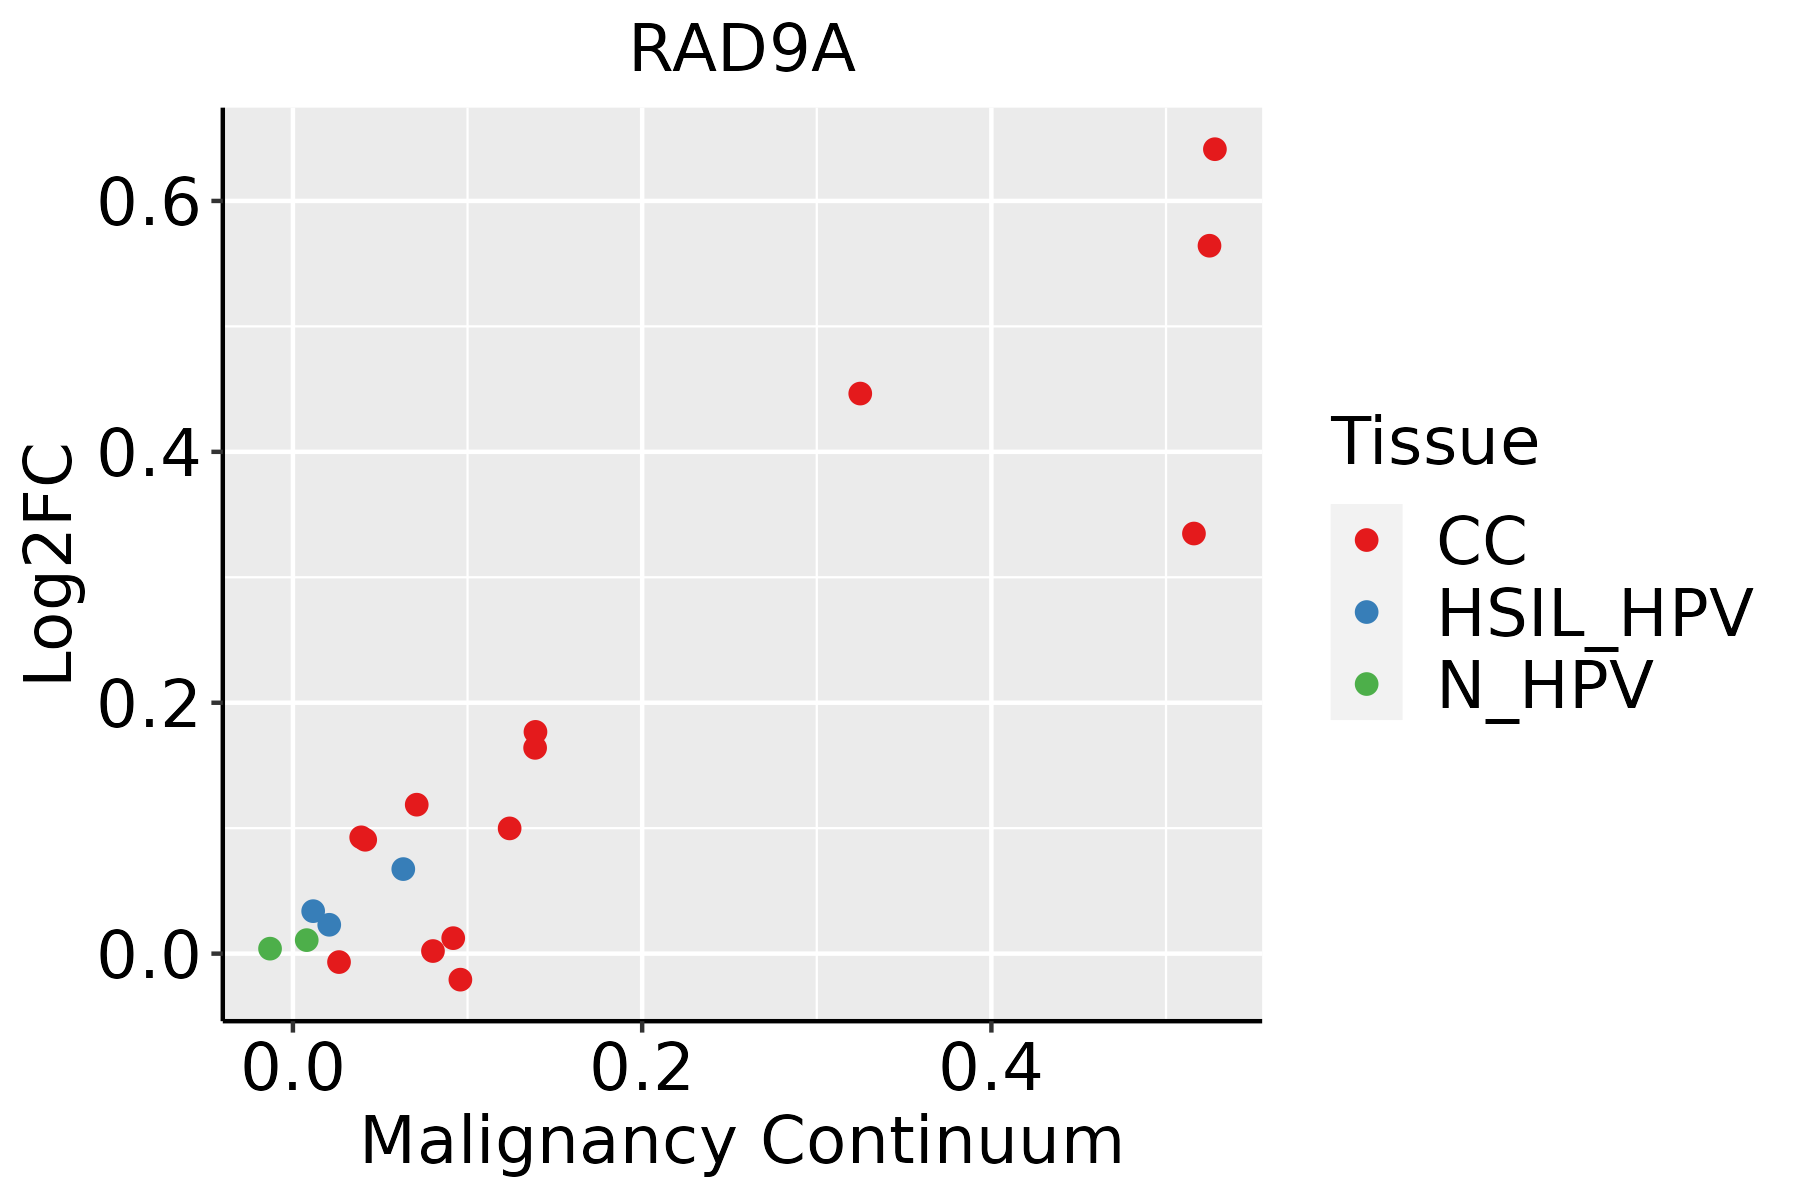 | CC: Cervix cancer |
| HSIL_HPV: HPV-infected high-grade squamous intraepithelial lesions | ||
| N_HPV: HPV-infected normal cervix | ||
| Esophagus |  | ESCC: Esophageal squamous cell carcinoma |
| HGIN: High-grade intraepithelial neoplasias | ||
| LGIN: Low-grade intraepithelial neoplasias | ||
| Lung | 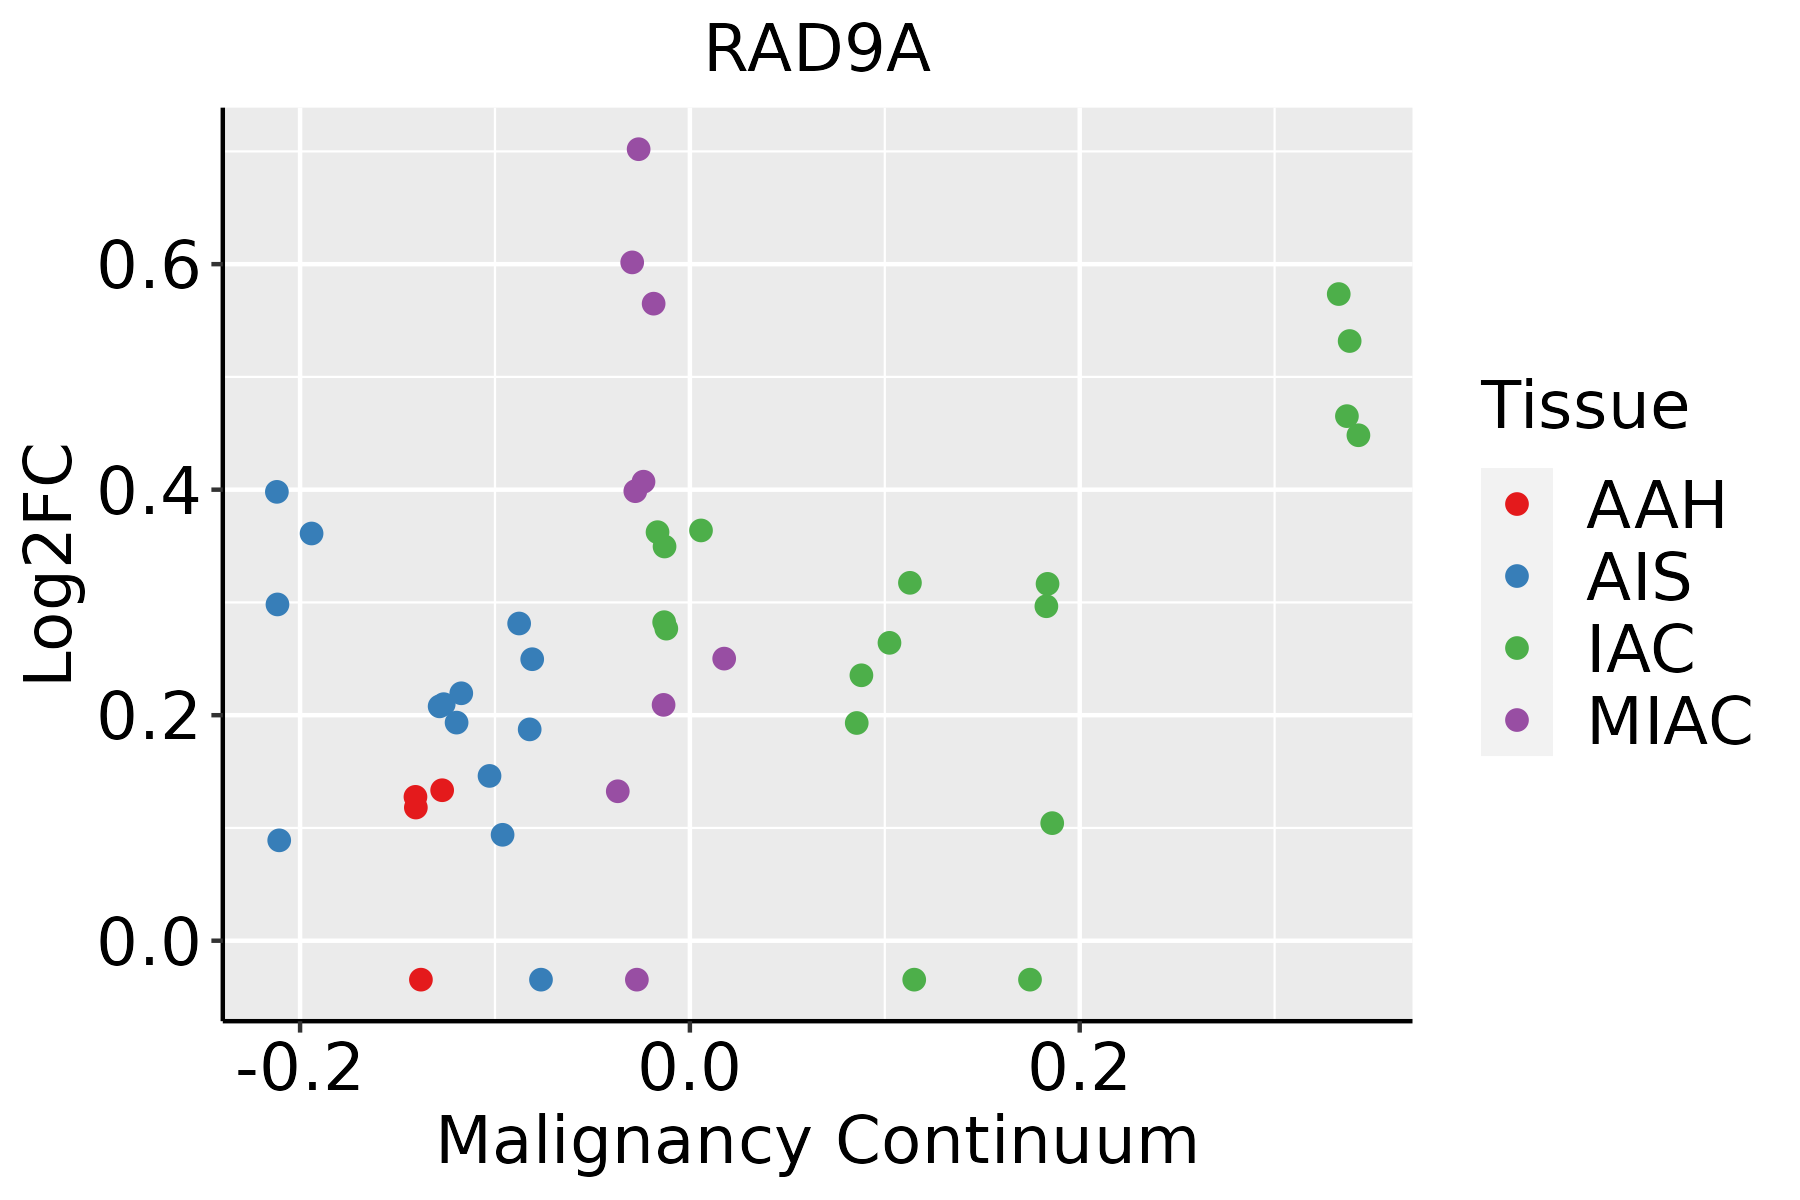 | AAH: Atypical adenomatous hyperplasia |
| AIS: Adenocarcinoma in situ | ||
| IAC: Invasive lung adenocarcinoma | ||
| MIA: Minimally invasive adenocarcinoma | ||
| Oral Cavity |  | EOLP: Erosive Oral lichen planus |
| LP: leukoplakia | ||
| NEOLP: Non-erosive oral lichen planus | ||
| OSCC: Oral squamous cell carcinoma | ||
| Thyroid | 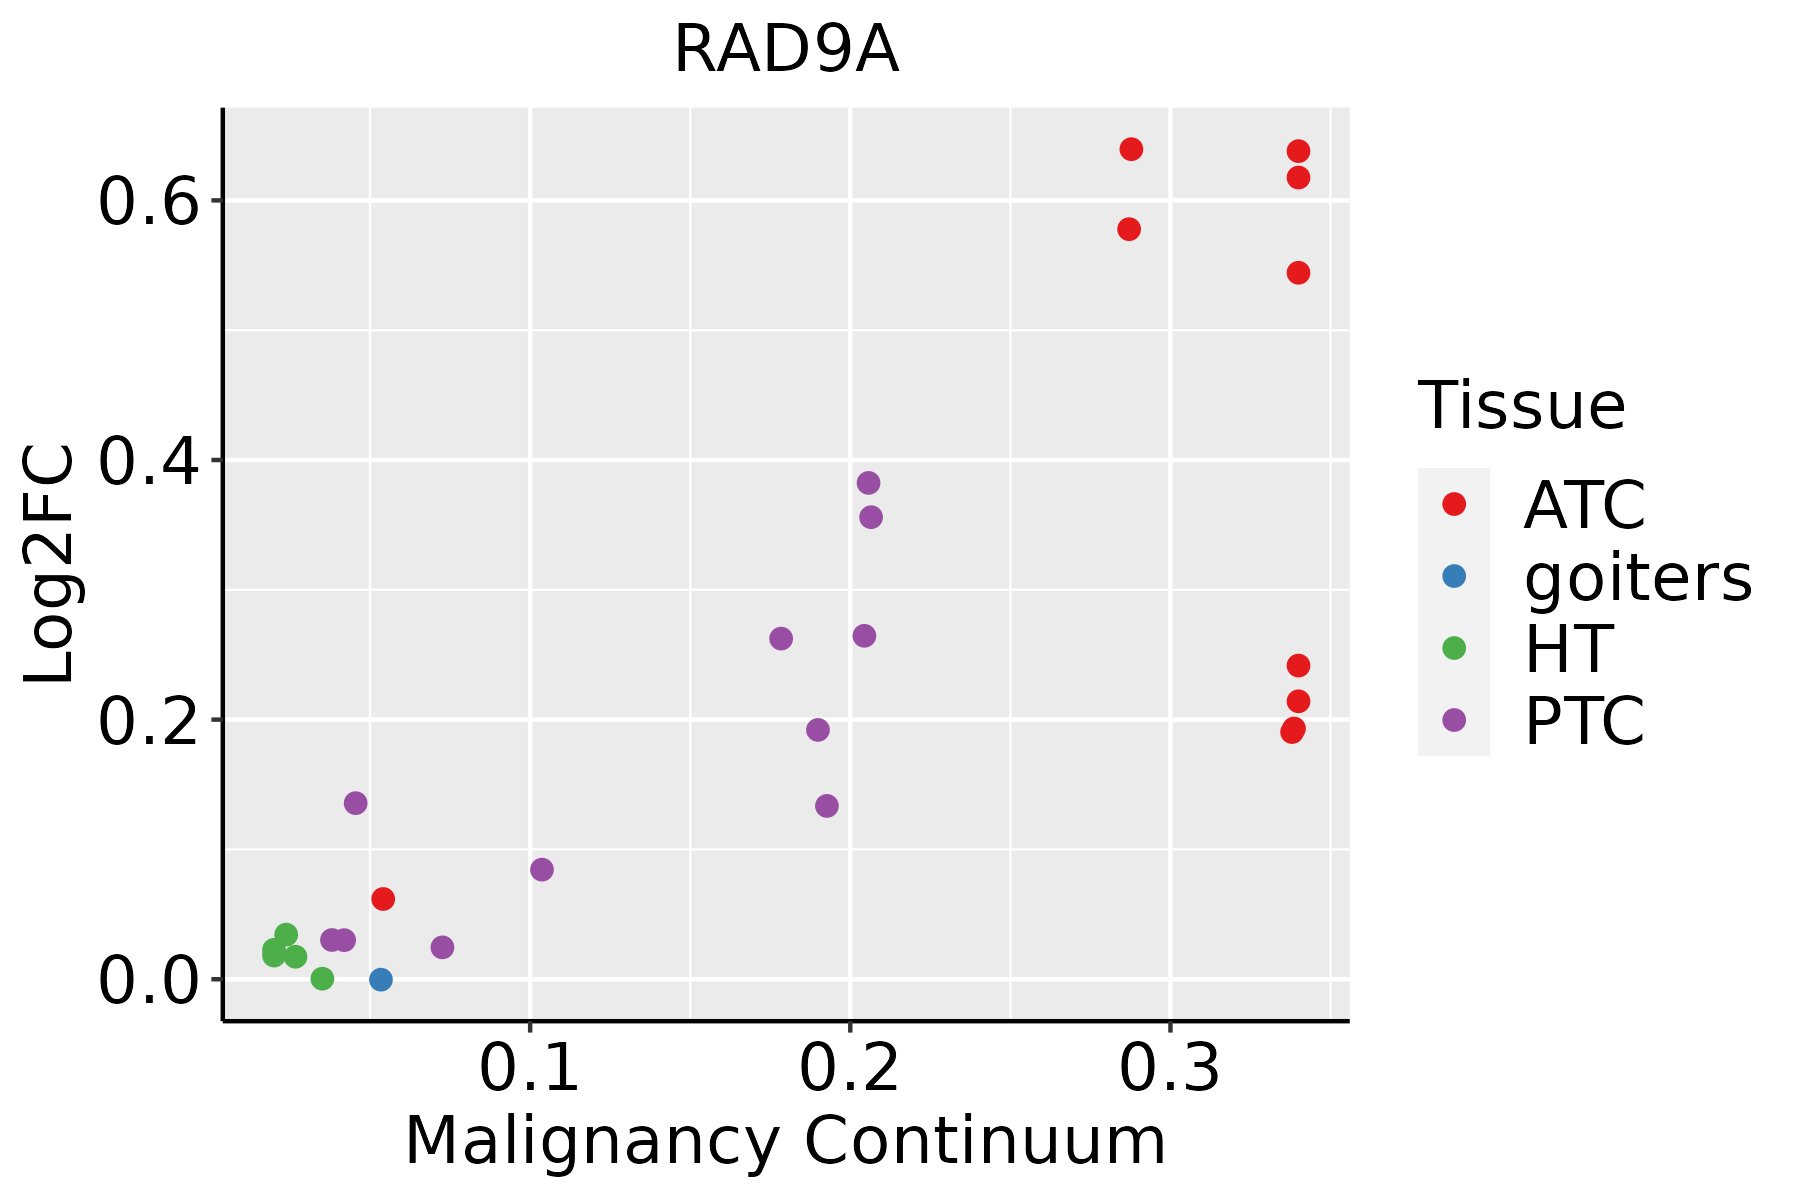 | ATC: Anaplastic thyroid cancer |
| HT: Hashimoto's thyroiditis | ||
| PTC: Papillary thyroid cancer |
| ∗log2FC in expression of this searched gene in stem-like cells from each diseased tissue sample relative to stem-like cells in normal samples in each tissue plotted against the malignancy continuum. Samples are colored based on if they are from different disease stage. |
Top |
Malignant transformation related pathway analysis |
| Find out the enriched GO biological processes and KEGG pathways involved in transition from healthy to precancer to cancer |
| Tissue | Disease Stage | Enriched GO biological Processes |
| Colorectum | AD |  |
| Colorectum | SER |  |
| Colorectum | MSS |  |
| Colorectum | MSI-H |  |
| Colorectum | FAP |  |
| ∗Top 15 enriched GO BP terms are showed in the bar plot of each disease state in each tissue. Each row represents a significant GO biological process which is colored according to the -log10(p.adjust). |
| Page: 1 2 3 4 5 6 7 8 9 |
| GO ID | Tissue | Disease Stage | Description | Gene Ratio | Bg Ratio | pvalue | p.adjust | Count |
| GO:00712148 | Cervix | CC | cellular response to abiotic stimulus | 69/2311 | 331/18723 | 7.36e-06 | 1.73e-04 | 69 |
| GO:01040048 | Cervix | CC | cellular response to environmental stimulus | 69/2311 | 331/18723 | 7.36e-06 | 1.73e-04 | 69 |
| GO:00073466 | Cervix | CC | regulation of mitotic cell cycle | 88/2311 | 457/18723 | 1.26e-05 | 2.60e-04 | 88 |
| GO:00714798 | Cervix | CC | cellular response to ionizing radiation | 22/2311 | 72/18723 | 3.47e-05 | 5.60e-04 | 22 |
| GO:00093149 | Cervix | CC | response to radiation | 86/2311 | 456/18723 | 3.50e-05 | 5.63e-04 | 86 |
| GO:19019873 | Cervix | CC | regulation of cell cycle phase transition | 74/2311 | 390/18723 | 9.80e-05 | 1.27e-03 | 74 |
| GO:00714786 | Cervix | CC | cellular response to radiation | 41/2311 | 186/18723 | 1.41e-04 | 1.71e-03 | 41 |
| GO:00102126 | Cervix | CC | response to ionizing radiation | 34/2311 | 148/18723 | 2.23e-04 | 2.53e-03 | 34 |
| GO:00457862 | Cervix | CC | negative regulation of cell cycle | 67/2311 | 385/18723 | 2.21e-03 | 1.59e-02 | 67 |
| GO:00459302 | Cervix | CC | negative regulation of mitotic cell cycle | 44/2311 | 235/18723 | 3.02e-03 | 1.99e-02 | 44 |
| GO:00427705 | Cervix | CC | signal transduction in response to DNA damage | 34/2311 | 172/18723 | 3.52e-03 | 2.27e-02 | 34 |
| GO:00109482 | Cervix | CC | negative regulation of cell cycle process | 51/2311 | 294/18723 | 7.35e-03 | 3.94e-02 | 51 |
| GO:000734610 | Esophagus | HGIN | regulation of mitotic cell cycle | 98/2587 | 457/18723 | 4.39e-06 | 1.42e-04 | 98 |
| GO:007147919 | Esophagus | HGIN | cellular response to ionizing radiation | 21/2587 | 72/18723 | 5.31e-04 | 7.59e-03 | 21 |
| GO:000931418 | Esophagus | HGIN | response to radiation | 88/2587 | 456/18723 | 6.26e-04 | 8.65e-03 | 88 |
| GO:00714789 | Esophagus | HGIN | cellular response to radiation | 42/2587 | 186/18723 | 7.66e-04 | 1.00e-02 | 42 |
| GO:00427708 | Esophagus | HGIN | signal transduction in response to DNA damage | 39/2587 | 172/18723 | 1.07e-03 | 1.32e-02 | 39 |
| GO:007121418 | Esophagus | HGIN | cellular response to abiotic stimulus | 66/2587 | 331/18723 | 1.21e-03 | 1.45e-02 | 66 |
| GO:010400418 | Esophagus | HGIN | cellular response to environmental stimulus | 66/2587 | 331/18723 | 1.21e-03 | 1.45e-02 | 66 |
| GO:00459305 | Esophagus | HGIN | negative regulation of mitotic cell cycle | 49/2587 | 235/18723 | 1.88e-03 | 2.01e-02 | 49 |
| Page: 1 2 3 4 5 6 7 8 |
| Pathway ID | Tissue | Disease Stage | Description | Gene Ratio | Bg Ratio | pvalue | p.adjust | qvalue | Count |
| hsa0421810 | Cervix | CC | Cellular senescence | 49/1267 | 156/8465 | 1.30e-07 | 1.63e-06 | 9.61e-07 | 49 |
| hsa0421815 | Cervix | CC | Cellular senescence | 49/1267 | 156/8465 | 1.30e-07 | 1.63e-06 | 9.61e-07 | 49 |
| hsa0421828 | Esophagus | HGIN | Cellular senescence | 42/1383 | 156/8465 | 4.94e-04 | 5.03e-03 | 4.00e-03 | 42 |
| hsa04218111 | Esophagus | HGIN | Cellular senescence | 42/1383 | 156/8465 | 4.94e-04 | 5.03e-03 | 4.00e-03 | 42 |
| hsa0421829 | Esophagus | ESCC | Cellular senescence | 119/4205 | 156/8465 | 5.89e-12 | 9.40e-11 | 4.81e-11 | 119 |
| hsa0421838 | Esophagus | ESCC | Cellular senescence | 119/4205 | 156/8465 | 5.89e-12 | 9.40e-11 | 4.81e-11 | 119 |
| hsa042188 | Lung | IAC | Cellular senescence | 40/1053 | 156/8465 | 4.44e-06 | 1.44e-04 | 9.59e-05 | 40 |
| hsa0421813 | Lung | IAC | Cellular senescence | 40/1053 | 156/8465 | 4.44e-06 | 1.44e-04 | 9.59e-05 | 40 |
| hsa0421843 | Lung | MIAC | Cellular senescence | 22/507 | 156/8465 | 1.43e-04 | 3.46e-03 | 2.50e-03 | 22 |
| hsa0421853 | Lung | MIAC | Cellular senescence | 22/507 | 156/8465 | 1.43e-04 | 3.46e-03 | 2.50e-03 | 22 |
| hsa0421820 | Oral cavity | OSCC | Cellular senescence | 112/3704 | 156/8465 | 8.04e-13 | 1.42e-11 | 7.21e-12 | 112 |
| hsa04218110 | Oral cavity | OSCC | Cellular senescence | 112/3704 | 156/8465 | 8.04e-13 | 1.42e-11 | 7.21e-12 | 112 |
| hsa0421827 | Oral cavity | LP | Cellular senescence | 71/2418 | 156/8465 | 4.17e-06 | 3.75e-05 | 2.42e-05 | 71 |
| hsa0421837 | Oral cavity | LP | Cellular senescence | 71/2418 | 156/8465 | 4.17e-06 | 3.75e-05 | 2.42e-05 | 71 |
| Page: 1 |
Top |
Cell-cell communication analysis |
| Identification of potential cell-cell interactions between two cell types and their ligand-receptor pairs for different disease states |
| Ligand | Receptor | LRpair | Pathway | Tissue | Disease Stage |
| Page: 1 |
Top |
Single-cell gene regulatory network inference analysis |
| Find out the significant the regulons (TFs) and the target genes of each regulon across cell types for different disease states |
| TF | Cell Type | Tissue | Disease Stage | Target Gene | RSS | Regulon Activity |
| ∗The dot plots of a searched regulon are shown for all cell subpopulations in each disease state of each tissue based on the regulon specific score inferred using pySCENIC and by calculating the average expression. |
| Page: 1 |
Top |
Somatic mutation of malignant transformation related genes |
| Annotation of somatic variants for genes involved in malignant transformation |
| Hugo Symbol | Variant Class | Variant Classification | dbSNP RS | HGVSc | HGVSp | HGVSp Short | SWISSPROT | BIOTYPE | SIFT | PolyPhen | Tumor Sample Barcode | Tissue | Histology | Sex | Age | Stage | Therapy Types | Drugs | Outcome |
| RAD9A | SNV | Missense_Mutation | novel | c.797C>T | p.Ser266Leu | p.S266L | Q99638 | protein_coding | tolerated(0.19) | benign(0.003) | TCGA-LD-A74U-01 | Breast | breast invasive carcinoma | Female | >=65 | III/IV | Chemotherapy | taxotere | SD |
| RAD9A | deletion | Frame_Shift_Del | novel | c.1083delN | p.Arg362AlafsTer35 | p.R362Afs*35 | Q99638 | protein_coding | TCGA-D8-A27V-01 | Breast | breast invasive carcinoma | Female | <65 | I/II | Hormone Therapy | tamoxiphen | SD | ||
| RAD9A | SNV | Missense_Mutation | novel | c.231N>A | p.Met77Ile | p.M77I | Q99638 | protein_coding | tolerated(0.36) | benign(0.015) | TCGA-MA-AA3Y-01 | Cervix | cervical & endocervical cancer | Female | <65 | I/II | Unknown | Unknown | SD |
| RAD9A | SNV | Missense_Mutation | c.677N>G | p.Leu226Arg | p.L226R | Q99638 | protein_coding | deleterious(0) | probably_damaging(0.994) | TCGA-AA-3511-01 | Colorectum | colon adenocarcinoma | Male | <65 | I/II | Unknown | Unknown | PD | |
| RAD9A | SNV | Missense_Mutation | novel | c.527N>C | p.Val176Ala | p.V176A | Q99638 | protein_coding | tolerated(0.06) | probably_damaging(0.969) | TCGA-G4-6304-01 | Colorectum | colon adenocarcinoma | Female | >=65 | I/II | Chemotherapy | fluorouracil | PD |
| RAD9A | deletion | Frame_Shift_Del | c.1124delN | p.Gln377ArgfsTer20 | p.Q377Rfs*20 | Q99638 | protein_coding | TCGA-A6-2672-01 | Colorectum | colon adenocarcinoma | Female | >=65 | III/IV | Unknown | Unknown | SD | |||
| RAD9A | SNV | Missense_Mutation | novel | c.793N>A | p.Leu265Ile | p.L265I | Q99638 | protein_coding | deleterious(0.01) | probably_damaging(0.996) | TCGA-A5-A0G2-01 | Endometrium | uterine corpus endometrioid carcinoma | Female | <65 | III/IV | Unknown | Unknown | SD |
| RAD9A | SNV | Missense_Mutation | rs377299831 | c.215N>A | p.Arg72His | p.R72H | Q99638 | protein_coding | tolerated(0.14) | benign(0.03) | TCGA-A5-A2K7-01 | Endometrium | uterine corpus endometrioid carcinoma | Female | <65 | I/II | Chemotherapy | taxol | SD |
| RAD9A | SNV | Missense_Mutation | rs569583450 | c.403N>A | p.Val135Ile | p.V135I | Q99638 | protein_coding | tolerated(0.13) | benign(0.123) | TCGA-AJ-A3BG-01 | Endometrium | uterine corpus endometrioid carcinoma | Female | >=65 | I/II | Chemotherapy | carboplatin | PD |
| RAD9A | SNV | Missense_Mutation | novel | c.778N>C | p.Phe260Leu | p.F260L | Q99638 | protein_coding | tolerated(0.28) | benign(0.057) | TCGA-AX-A3FT-01 | Endometrium | uterine corpus endometrioid carcinoma | Female | <65 | I/II | Unknown | Unknown | SD |
| Page: 1 2 3 |
Top |
Related drugs of malignant transformation related genes |
| Identification of chemicals and drugs interact with genes involved in malignant transfromation |
| (DGIdb 4.0) |
| Entrez ID | Symbol | Category | Interaction Types | Drug Claim Name | Drug Name | PMIDs |
| Page: 1 |

Copyright 2023-Present -The University of Texas Health Science Center at Houston |