Schematic overview of the cellular and molecular mechanisms involved in the cancer progression, including the proposed cellular and molecular mechanisms in cancer cells trajectory. AT1: alveolar type 1 cells; AT2: alveolar type 2 cells; AAH: atypical adenomatous hyperplasia; AIS: adenocarcinoma in situ; MIA: minimally invasive adenocarcinoma; IA: invasive adenocarcinoma; EMT: epithelial-mesenchymal transition

Home

Download

Statistics

Help

Contact

Center for Computational Systems Medicine
leaf

Gene summary

leaf

Malignant transformation analysis

leaf

Malignant transformation related pathway analysis

leaf

Cell-cell communication analysis

leaf

Single-cell gene regulatory network inference analysis

leaf

Somatic mutation of malignant transformation related genes

leaf

Related drugs of malignant transformation related genes

Gene: RAD51C

Gene summary for RAD51C

check button Gene summary.

Gene informationSpeciesHuman
Gene symbol

RAD51C

Gene ID

5889

Gene nameRAD51 paralog C
Gene AliasBROVCA3
Cytomap17q22
Gene Typeprotein-coding
GO ID

GO:0000003

UniProtAcc

O43502


Top

Malignant transformation analysis

check button Identification of the aberrant gene expression in precancerous and cancerous lesions by comparing the gene expression of stem-like cells in diseased tissues with normal stem cells
check button Malignant transformation involving gene list.
Entrez IDSymbolReplicatesSpeciesOrganTissueAdj P-valueLog2FCMalignancy
5889RAD51CLZE2THumanEsophagusESCC8.78e-045.56e-010.082
5889RAD51CLZE4THumanEsophagusESCC4.07e-092.83e-010.0811
5889RAD51CLZE5THumanEsophagusESCC1.64e-042.28e-010.0514
5889RAD51CLZE7THumanEsophagusESCC2.72e-065.81e-010.0667
5889RAD51CLZE8THumanEsophagusESCC4.75e-021.26e-010.067
5889RAD51CLZE22THumanEsophagusESCC8.74e-042.56e-010.068
5889RAD51CLZE24THumanEsophagusESCC1.30e-164.60e-010.0596
5889RAD51CLZE21THumanEsophagusESCC1.40e-034.76e-010.0655
5889RAD51CLZE6THumanEsophagusESCC3.80e-074.51e-010.0845
5889RAD51CP1T-EHumanEsophagusESCC1.21e-154.73e-010.0875
5889RAD51CP2T-EHumanEsophagusESCC3.41e-365.06e-010.1177
5889RAD51CP4T-EHumanEsophagusESCC3.64e-213.29e-010.1323
5889RAD51CP5T-EHumanEsophagusESCC8.05e-131.48e-010.1327
5889RAD51CP8T-EHumanEsophagusESCC5.95e-294.83e-010.0889
5889RAD51CP9T-EHumanEsophagusESCC8.61e-122.56e-010.1131
5889RAD51CP10T-EHumanEsophagusESCC1.59e-305.01e-010.116
5889RAD51CP11T-EHumanEsophagusESCC5.50e-042.83e-010.1426
5889RAD51CP12T-EHumanEsophagusESCC2.43e-365.63e-010.1122
5889RAD51CP15T-EHumanEsophagusESCC2.67e-183.87e-010.1149
5889RAD51CP16T-EHumanEsophagusESCC1.32e-314.88e-010.1153
Page: 1 2 3 4 5 

check button Transcriptomic changes along malignancy continuum.
TissueExpression DynamicsAbbreviation
EsophagusThe image shows the transcriptomic changes along malignancy continuum.log2FC in expression of this searched gene in stem-like cells from each diseased tissue sample relative to stem-like cells in normal samples in each tissue plotted against the malignancy continuum. Samples are colored based on if they are from different disease stage.
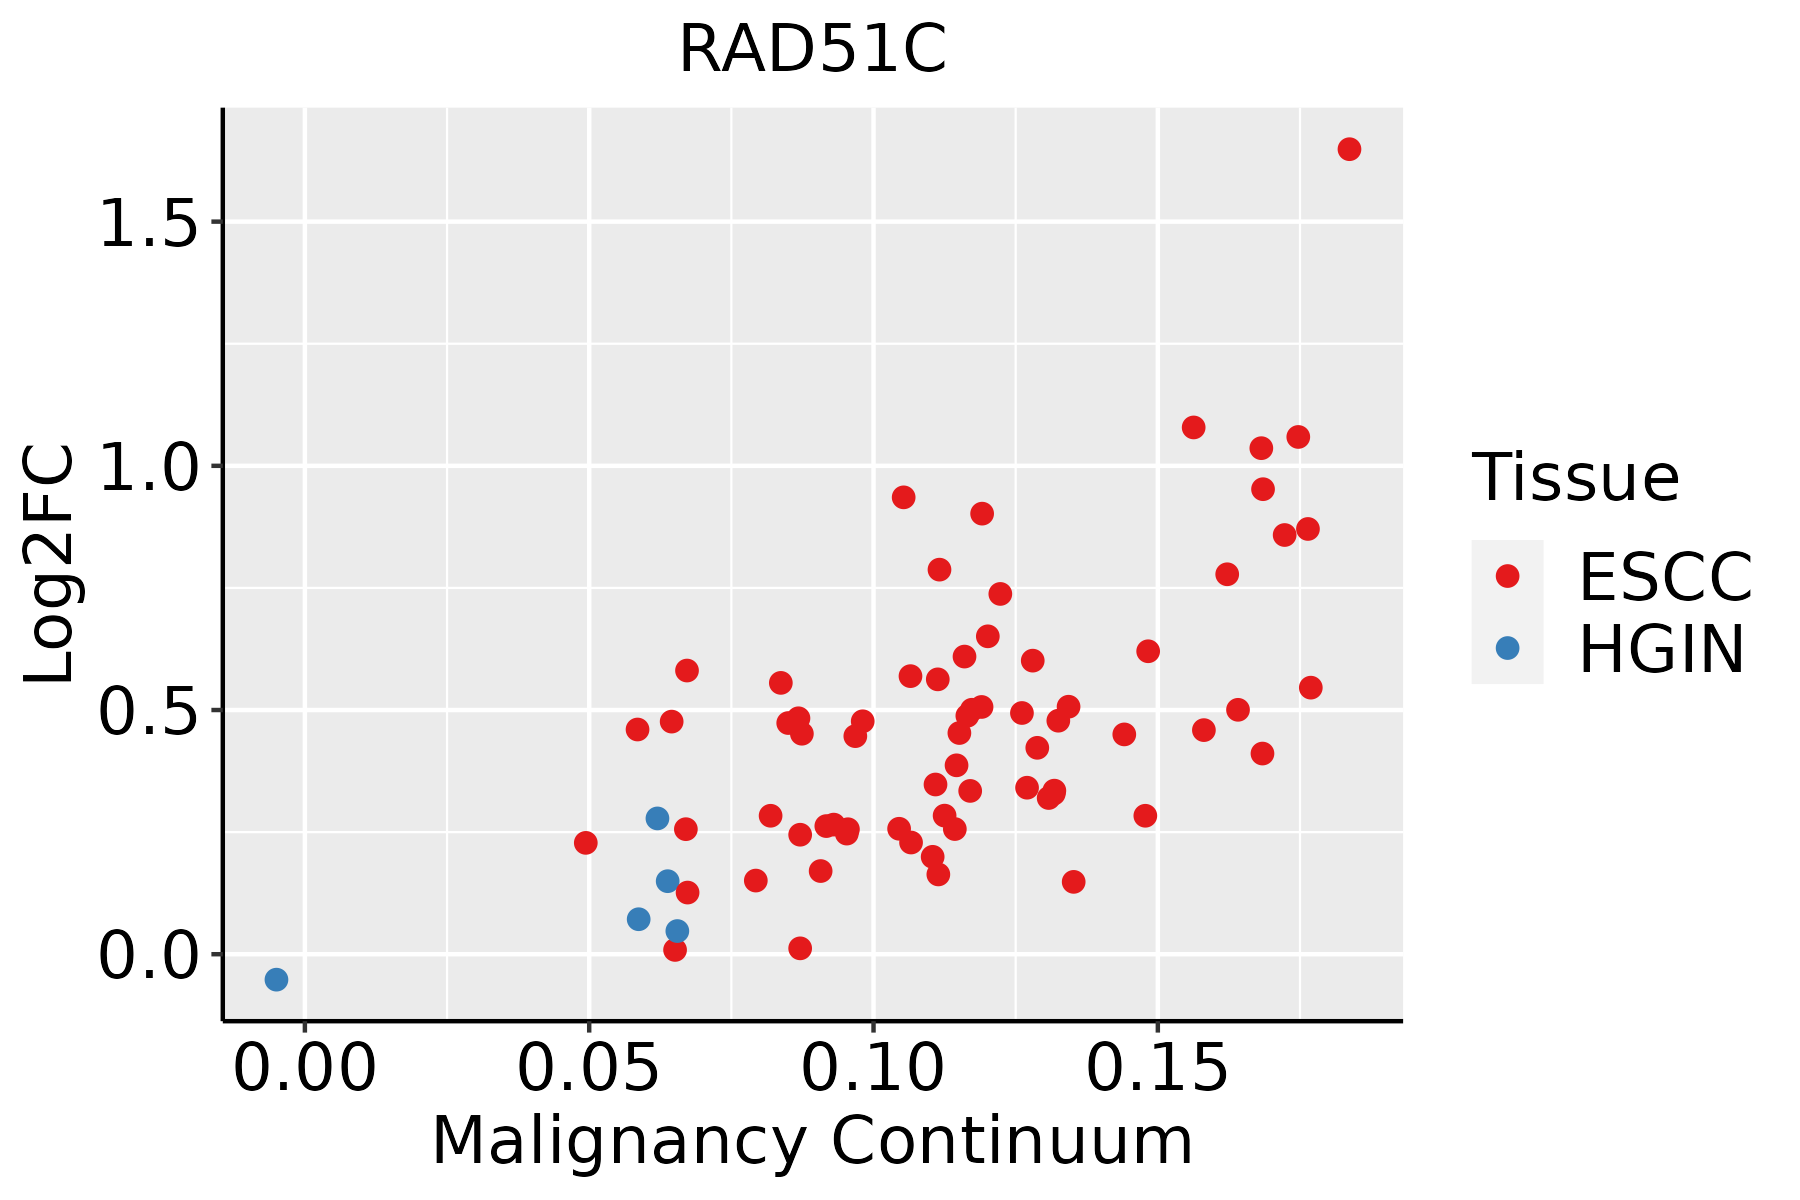
ESCC: Esophageal squamous cell carcinoma
HGIN: High-grade intraepithelial neoplasias
LGIN: Low-grade intraepithelial neoplasias
LiverThe image shows the transcriptomic changes along malignancy continuum.log2FC in expression of this searched gene in stem-like cells from each diseased tissue sample relative to stem-like cells in normal samples in each tissue plotted against the malignancy continuum. Samples are colored based on if they are from different disease stage.
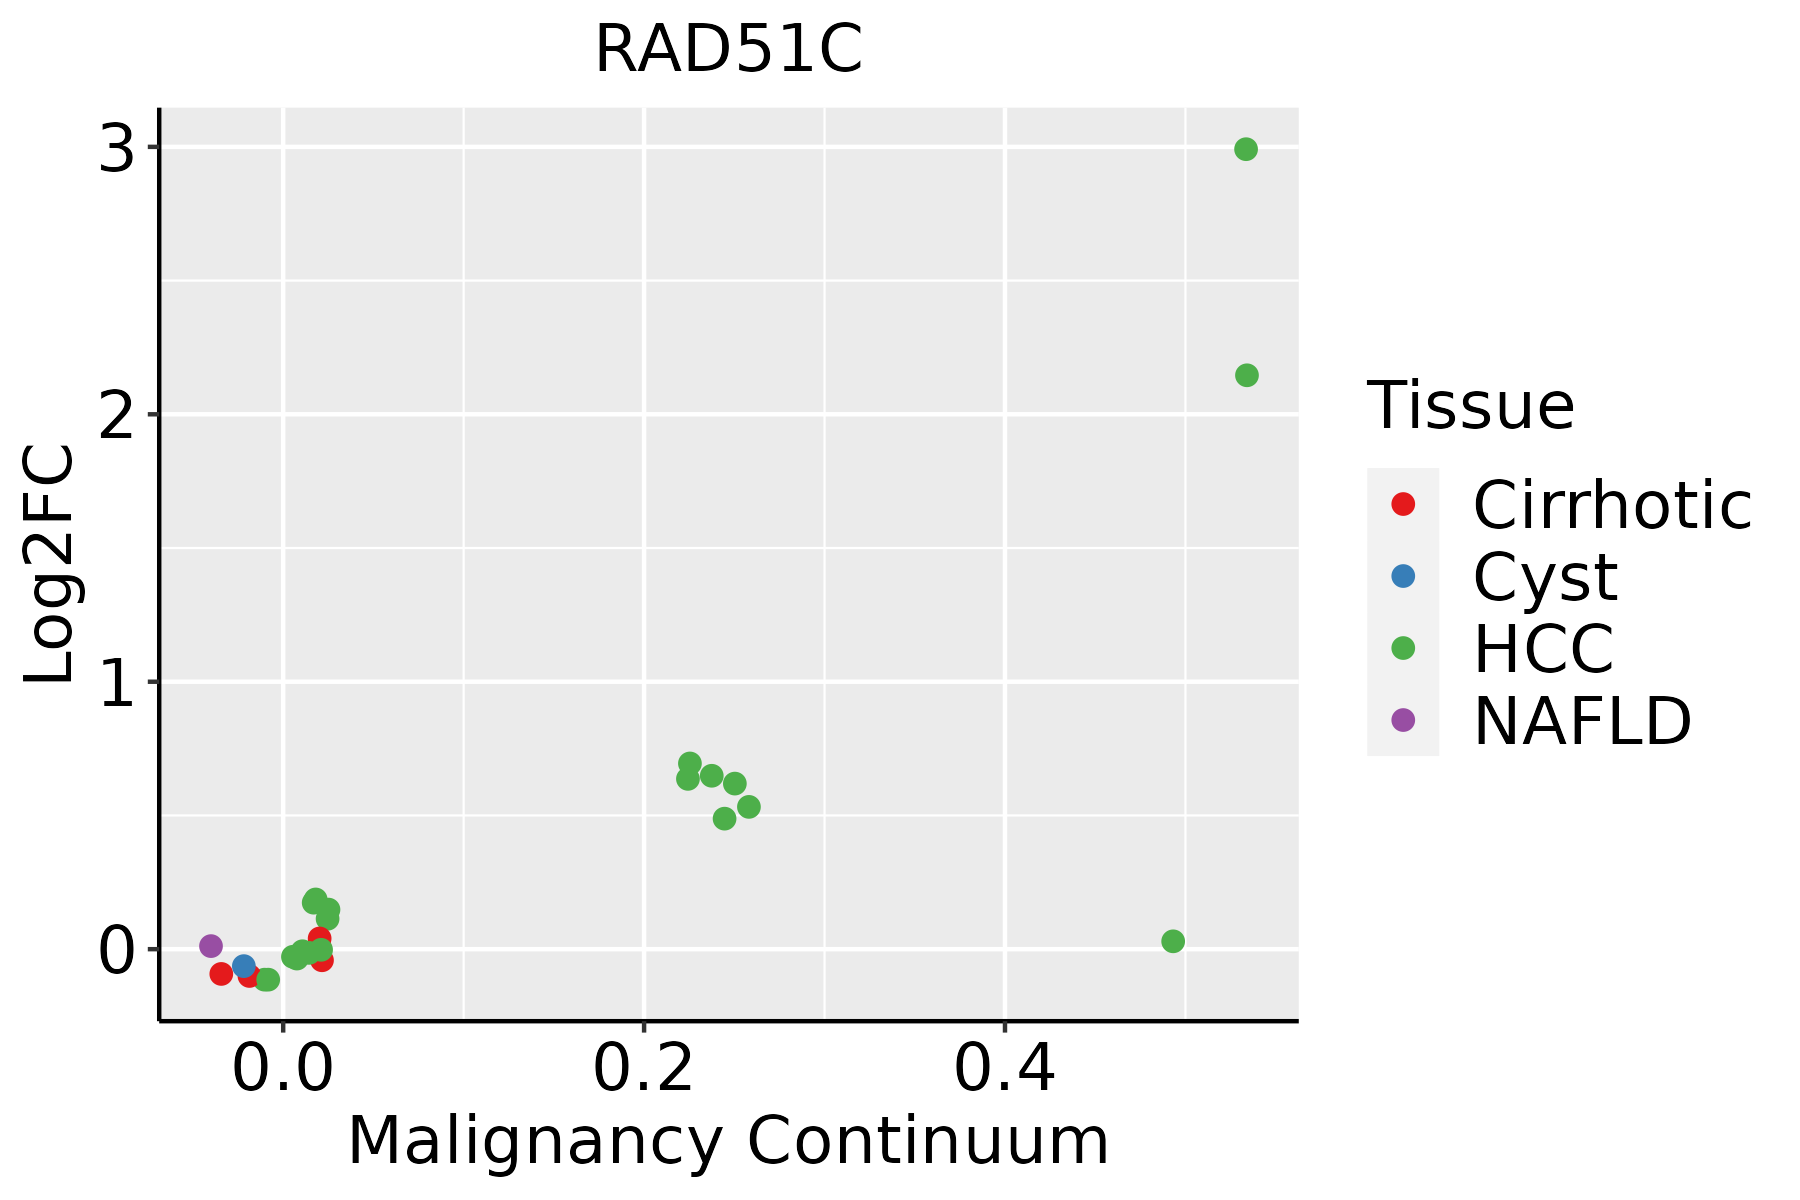
HCC: Hepatocellular carcinoma
NAFLD: Non-alcoholic fatty liver disease
Oral CavityThe image shows the transcriptomic changes along malignancy continuum.log2FC in expression of this searched gene in stem-like cells from each diseased tissue sample relative to stem-like cells in normal samples in each tissue plotted against the malignancy continuum. Samples are colored based on if they are from different disease stage.EOLP: Erosive Oral lichen planus
LP: leukoplakia
NEOLP: Non-erosive oral lichen planus
OSCC: Oral squamous cell carcinoma
SkinThe image shows the transcriptomic changes along malignancy continuum.log2FC in expression of this searched gene in stem-like cells from each diseased tissue sample relative to stem-like cells in normal samples in each tissue plotted against the malignancy continuum. Samples are colored based on if they are from different disease stage.AK: Actinic keratosis
cSCC: Cutaneous squamous cell carcinoma
SCCIS:squamous cell carcinoma in situ
∗log2FC in expression of this searched gene in stem-like cells from each diseased tissue sample relative to stem-like cells in normal samples in each tissue plotted against the malignancy continuum. Samples are colored based on if they are from different disease stage.

Top

Malignant transformation related pathway analysis

check buttonFind out the enriched GO biological processes and KEGG pathways involved in transition from healthy to precancer to cancer
check button Figure of enriched GO biological processes.
TissueDisease StageEnriched GO biological Processes
ColorectumADGO analysis - Figure of enriched GO biological processes: Top 15 enriched GO BP terms are showed in the bar plot of each disease state in each tissue. Each row represents a significant GO biological process which is colored according to the -log10(p.adjust).
ColorectumSERGO analysis - Figure of enriched GO biological processes: Top 15 enriched GO BP terms are showed in the bar plot of each disease state in each tissue. Each row represents a significant GO biological process which is colored according to the -log10(p.adjust).
ColorectumMSSGO analysis - Figure of enriched GO biological processes: Top 15 enriched GO BP terms are showed in the bar plot of each disease state in each tissue. Each row represents a significant GO biological process which is colored according to the -log10(p.adjust).
ColorectumMSI-HGO analysis - Figure of enriched GO biological processes: Top 15 enriched GO BP terms are showed in the bar plot of each disease state in each tissue. Each row represents a significant GO biological process which is colored according to the -log10(p.adjust).
ColorectumFAPGO analysis - Figure of enriched GO biological processes: Top 15 enriched GO BP terms are showed in the bar plot of each disease state in each tissue. Each row represents a significant GO biological process which is colored according to the -log10(p.adjust).
∗Top 15 enriched GO BP terms are showed in the bar plot of each disease state in each tissue. Each row represents a significant GO biological process which is colored according to the -log10(p.adjust).
Page: 1 2 3 4 5 6 7 8 9 

check button Enriched GO biological processes.
GO IDTissueDisease StageDescriptionGene RatioBg Ratiopvaluep.adjustCount
GO:00008194EsophagusESCCsister chromatid segregation157/8552202/187238.41e-211.33e-18157
GO:000705911EsophagusESCCchromosome segregation238/8552346/187231.72e-181.82e-16238
GO:004477216EsophagusESCCmitotic cell cycle phase transition281/8552424/187234.63e-184.45e-16281
GO:000734615EsophagusESCCregulation of mitotic cell cycle293/8552457/187238.00e-165.64e-14293
GO:00482853EsophagusESCCorganelle fission301/8552488/187234.64e-132.12e-11301
GO:00988133EsophagusESCCnuclear chromosome segregation187/8552281/187231.00e-124.36e-11187
GO:000072319EsophagusESCCtelomere maintenance99/8552131/187232.68e-121.08e-1099
GO:00002802EsophagusESCCnuclear division270/8552439/187231.17e-114.24e-10270
GO:190198713EsophagusESCCregulation of cell cycle phase transition242/8552390/187233.86e-111.26e-09242
GO:190199013EsophagusESCCregulation of mitotic cell cycle phase transition191/8552299/187231.35e-103.94e-09191
GO:004578710EsophagusESCCpositive regulation of cell cycle196/8552313/187239.27e-102.24e-08196
GO:00448394EsophagusESCCcell cycle G2/M phase transition103/8552148/187233.09e-096.67e-08103
GO:00000864EsophagusESCCG2/M transition of mitotic cell cycle96/8552137/187236.00e-091.23e-0796
GO:004593116EsophagusESCCpositive regulation of mitotic cell cycle83/8552121/187232.78e-074.08e-0683
GO:00063024EsophagusESCCdouble-strand break repair152/8552251/187231.33e-061.62e-05152
GO:19019896EsophagusESCCpositive regulation of cell cycle phase transition77/8552115/187233.20e-063.58e-0577
GO:00900689EsophagusESCCpositive regulation of cell cycle process142/8552236/187234.79e-065.08e-05142
GO:00103891EsophagusESCCregulation of G2/M transition of mitotic cell cycle64/855294/187239.21e-068.82e-0564
GO:19027491EsophagusESCCregulation of cell cycle G2/M phase transition68/8552102/187231.48e-051.33e-0468
GO:003220014EsophagusESCCtelomere organization99/8552159/187231.77e-051.57e-0499
Page: 1 2 3 4 5 

check button Enriched KEGG pathways.
Pathway IDTissueDisease StageDescriptionGene RatioBg Ratiopvaluep.adjustqvalueCount
Page: 1 

Top

Cell-cell communication analysis

check buttonIdentification of potential cell-cell interactions between two cell types and their ligand-receptor pairs for different disease states
LigandReceptorLRpairPathwayTissueDisease Stage
Page: 1 

Top

Single-cell gene regulatory network inference analysis

check buttonFind out the significant the regulons (TFs) and the target genes of each regulon across cell types for different disease states
TFCell TypeTissueDisease StageTarget GeneRSSRegulon Activity
∗The dot plots of a searched regulon are shown for all cell subpopulations in each disease state of each tissue based on the regulon specific score inferred using pySCENIC and by calculating the average expression.
Page: 1 

Top

Somatic mutation of malignant transformation related genes

check buttonAnnotation of somatic variants for genes involved in malignant transformation
Hugo SymbolVariant ClassVariant ClassificationdbSNP RSHGVScHGVSpHGVSp ShortSWISSPROTBIOTYPESIFTPolyPhenTumor Sample BarcodeTissueHistologySexAgeStageTherapy TypesDrugsOutcome
RAD51CSNVMissense_Mutationc.1078N>Cp.Glu360Glnp.E360QO43502protein_codingtolerated_low_confidence(0.13)benign(0.143)TCGA-A8-A09I-01Breastbreast invasive carcinomaFemale>=65I/IIHormone TherapyanastrozoleSD
RAD51CSNVMissense_Mutationc.421N>Cp.Asp141Hisp.D141HO43502protein_codingdeleterious(0)probably_damaging(0.928)TCGA-AC-A23H-01Breastbreast invasive carcinomaFemale>=65I/IIUnknownUnknownPD
RAD51CSNVMissense_Mutationc.61N>Tp.Pro21Serp.P21SO43502protein_codingtolerated(0.16)benign(0.043)TCGA-BH-A209-01Breastbreast invasive carcinomaFemale>=65I/IIUnknownUnknownSD
RAD51CSNVMissense_Mutationrs752608224c.61N>Gp.Pro21Alap.P21AO43502protein_codingtolerated(0.32)benign(0.031)TCGA-D8-A1JD-01Breastbreast invasive carcinomaFemale<65I/IIChemotherapyadriamycinSD
RAD51CSNVMissense_Mutationc.954N>Ap.Asp318Glup.D318EO43502protein_codingtolerated(0.93)benign(0.003)TCGA-D8-A1Y0-01Breastbreast invasive carcinomaFemale>=65III/IVChemotherapycyclophosphamide+methotrexatum+fluorouracillumSD
RAD51CSNVMissense_Mutationrs773998134c.106N>Ap.Glu36Lysp.E36KO43502protein_codingtolerated(0.24)benign(0.044)TCGA-C5-A1BQ-01Cervixcervical & endocervical cancerFemale>=65III/IVChemotherapycisplatinCR
RAD51CSNVMissense_Mutationc.238G>Cp.Glu80Glnp.E80QO43502protein_codingtolerated(0.56)benign(0.02)TCGA-EK-A3GK-01Cervixcervical & endocervical cancerFemale<65I/IIUnknownUnknownSD
RAD51CSNVMissense_Mutationc.175N>Ap.Glu59Lysp.E59KO43502protein_codingdeleterious(0)possibly_damaging(0.688)TCGA-IR-A3LA-01Cervixcervical & endocervical cancerFemale<65I/IIChemotherapycisplatinCR
RAD51CSNVMissense_Mutationnovelc.1023N>Gp.Ile341Metp.I341MO43502protein_codingdeleterious(0)probably_damaging(0.999)TCGA-VS-A8QF-01Cervixcervical & endocervical cancerFemale<65I/IIChemotherapycisplatinCR
RAD51CSNVMissense_Mutationc.760N>Tp.Asp254Tyrp.D254YO43502protein_codingdeleterious(0)probably_damaging(0.981)TCGA-A6-6141-01Colorectumcolon adenocarcinomaMale<65I/IIChemotherapy5-fuSD
Page: 1 2 3 4 

Top

Related drugs of malignant transformation related genes

check buttonIdentification of chemicals and drugs interact with genes involved in malignant transfromation
(DGIdb 4.0)
Entrez IDSymbolCategoryInteraction TypesDrug Claim NameDrug NamePMIDs
Page: 1