| Tissue | Expression Dynamics | Abbreviation |
| Cervix | 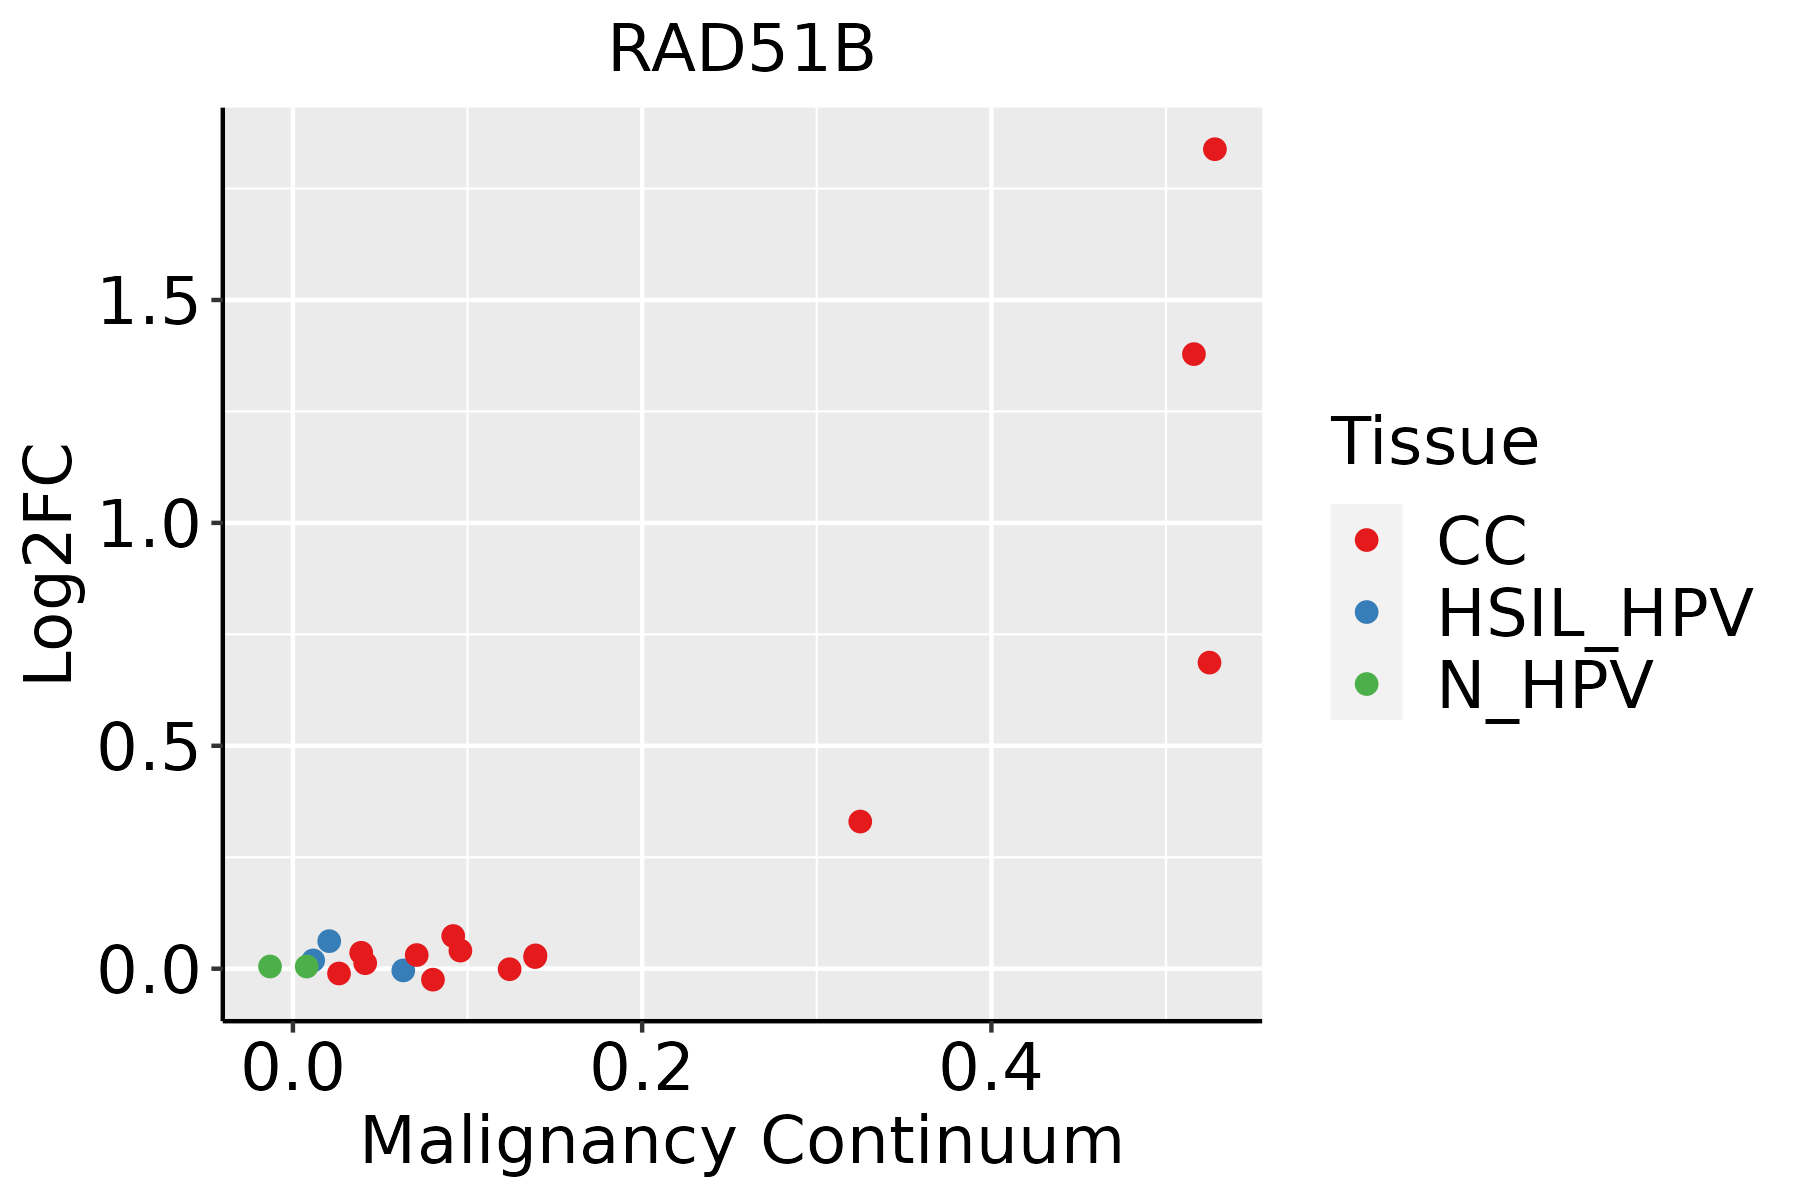 | CC: Cervix cancer |
| HSIL_HPV: HPV-infected high-grade squamous intraepithelial lesions |
| N_HPV: HPV-infected normal cervix |
| Colorectum (GSE201348) |  | FAP: Familial adenomatous polyposis |
| CRC: Colorectal cancer |
| Colorectum (HTA11) |  | AD: Adenomas |
| SER: Sessile serrated lesions |
| MSI-H: Microsatellite-high colorectal cancer |
| MSS: Microsatellite stable colorectal cancer |
| Endometrium |  | AEH: Atypical endometrial hyperplasia |
| EEC: Endometrioid Cancer |
| Lung | 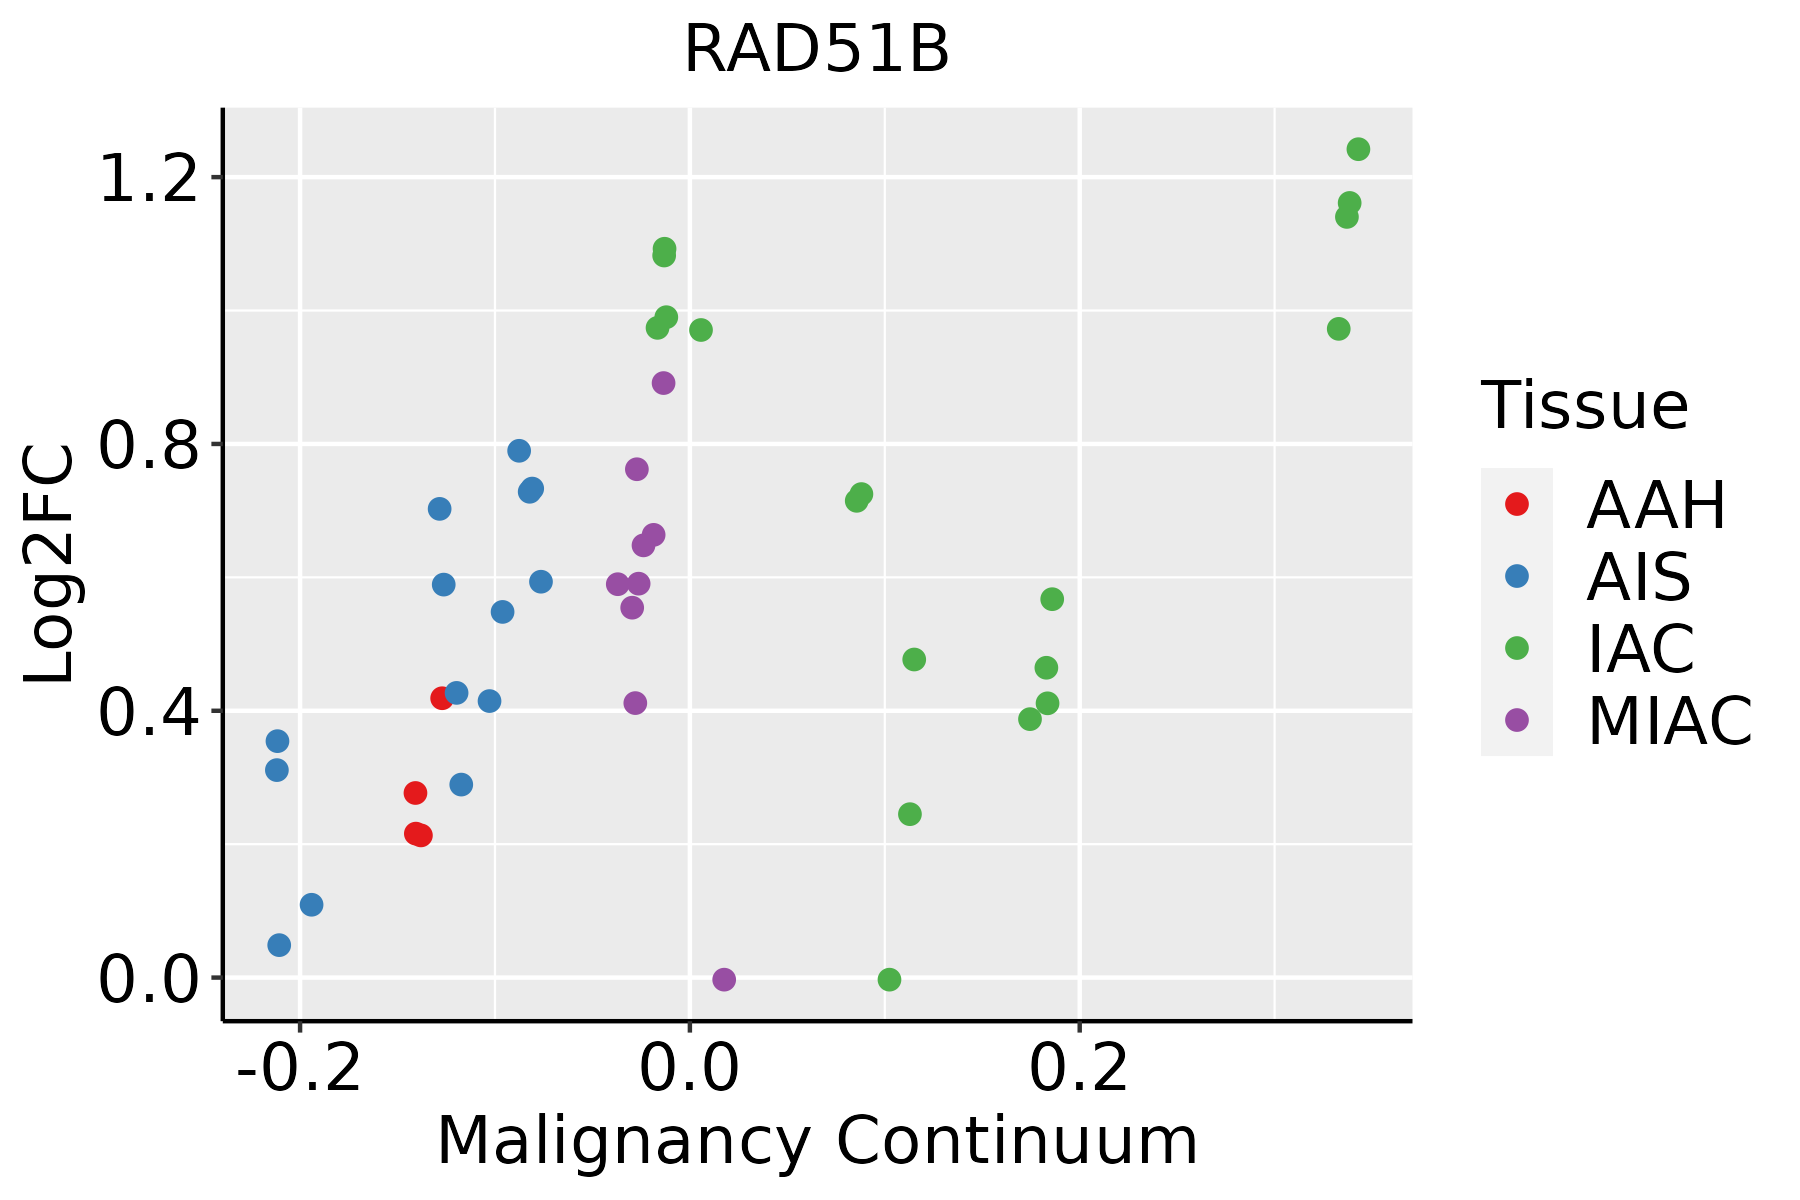 | AAH: Atypical adenomatous hyperplasia |
| AIS: Adenocarcinoma in situ |
| IAC: Invasive lung adenocarcinoma |
| MIA: Minimally invasive adenocarcinoma |
| Prostate | 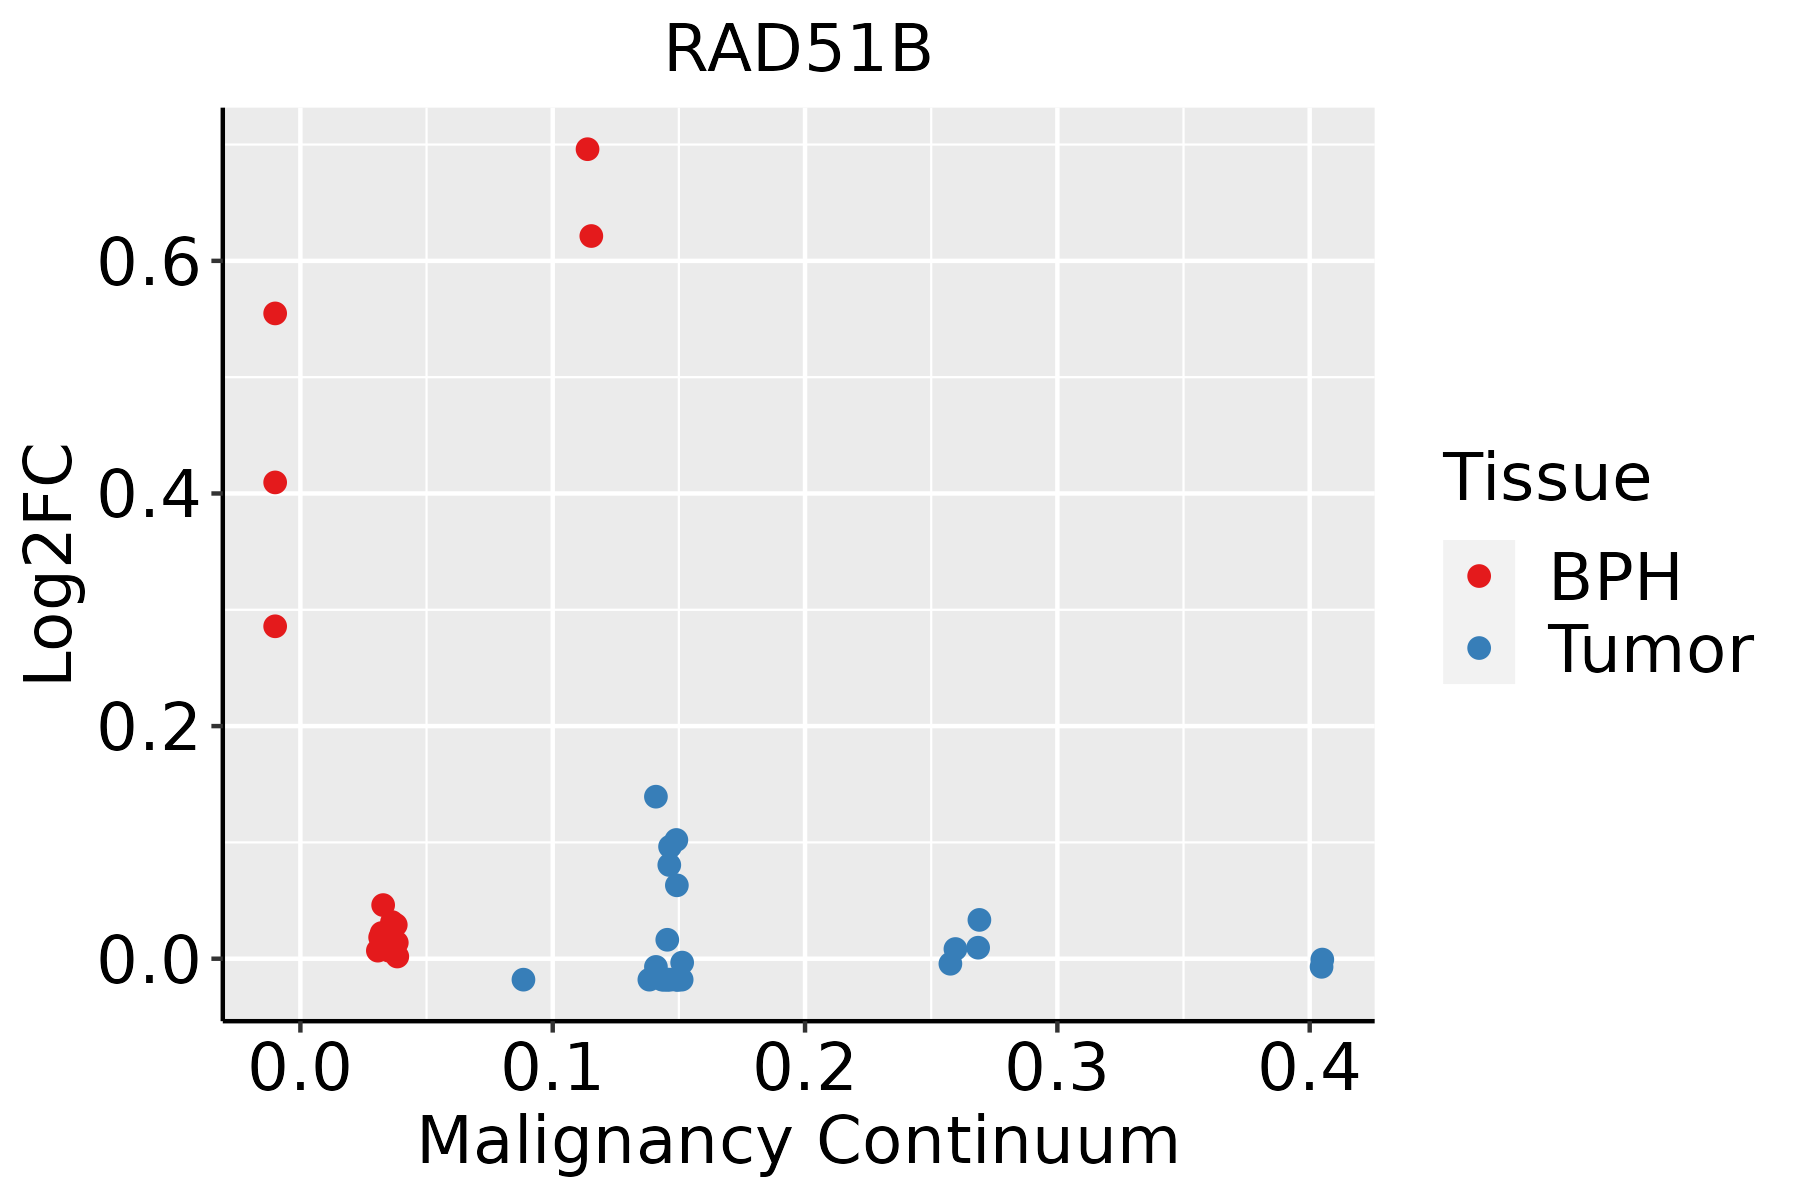 | BPH: Benign Prostatic Hyperplasia |
| Skin | 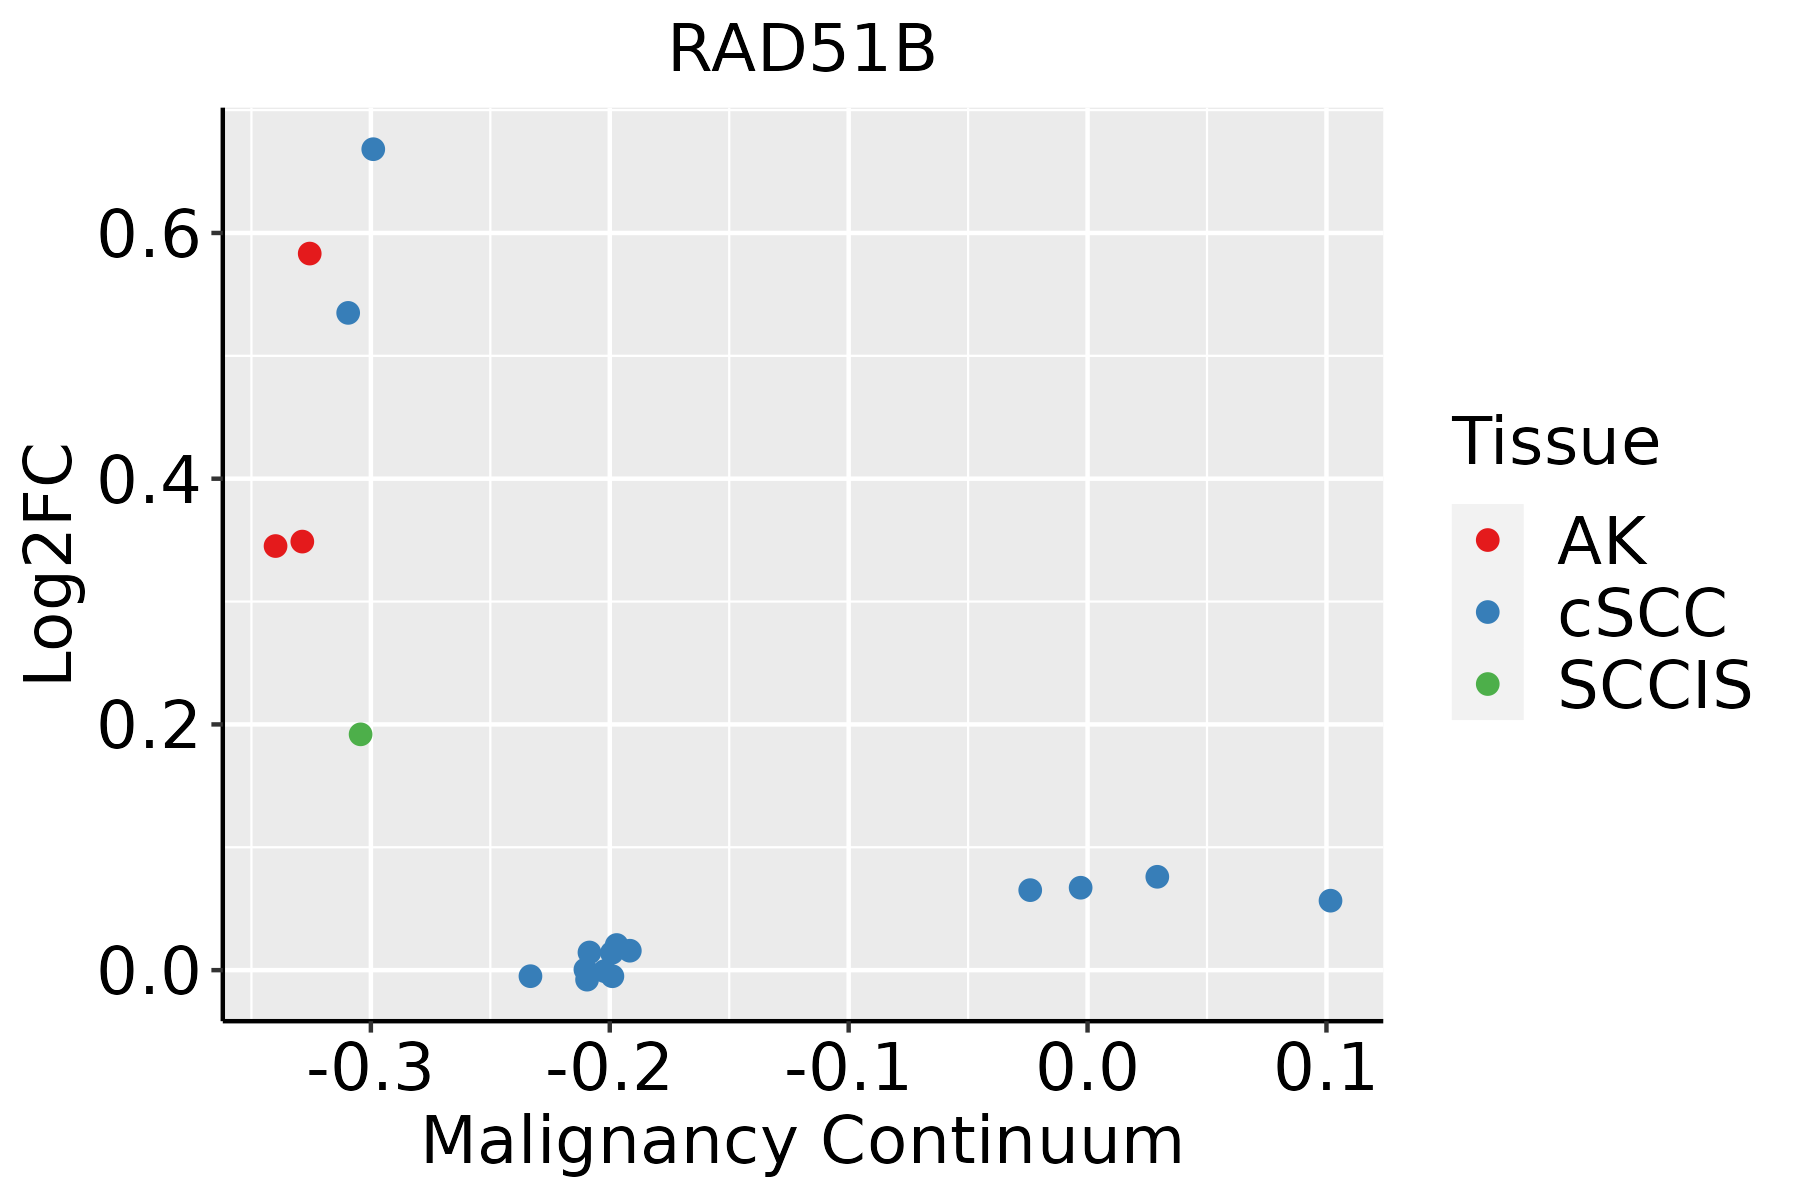 | AK: Actinic keratosis |
| cSCC: Cutaneous squamous cell carcinoma |
| SCCIS:squamous cell carcinoma in situ |
| GO ID | Tissue | Disease Stage | Description | Gene Ratio | Bg Ratio | pvalue | p.adjust | Count |
| GO:00447725 | Cervix | CC | mitotic cell cycle phase transition | 89/2311 | 424/18723 | 2.70e-07 | 1.12e-05 | 89 |
| GO:00457876 | Cervix | CC | positive regulation of cell cycle | 66/2311 | 313/18723 | 7.78e-06 | 1.81e-04 | 66 |
| GO:00073466 | Cervix | CC | regulation of mitotic cell cycle | 88/2311 | 457/18723 | 1.26e-05 | 2.60e-04 | 88 |
| GO:19019903 | Cervix | CC | regulation of mitotic cell cycle phase transition | 63/2311 | 299/18723 | 1.27e-05 | 2.60e-04 | 63 |
| GO:00459316 | Cervix | CC | positive regulation of mitotic cell cycle | 32/2311 | 121/18723 | 1.88e-05 | 3.47e-04 | 32 |
| GO:19019922 | Cervix | CC | positive regulation of mitotic cell cycle phase transition | 26/2311 | 93/18723 | 3.97e-05 | 6.18e-04 | 26 |
| GO:00017018 | Cervix | CC | in utero embryonic development | 71/2311 | 367/18723 | 7.21e-05 | 1.00e-03 | 71 |
| GO:00900685 | Cervix | CC | positive regulation of cell cycle process | 50/2311 | 236/18723 | 8.25e-05 | 1.11e-03 | 50 |
| GO:19019873 | Cervix | CC | regulation of cell cycle phase transition | 74/2311 | 390/18723 | 9.80e-05 | 1.27e-03 | 74 |
| GO:19019892 | Cervix | CC | positive regulation of cell cycle phase transition | 28/2311 | 115/18723 | 2.82e-04 | 3.07e-03 | 28 |
| GO:1902751 | Cervix | CC | positive regulation of cell cycle G2/M phase transition | 11/2311 | 30/18723 | 5.71e-04 | 5.45e-03 | 11 |
| GO:0010971 | Cervix | CC | positive regulation of G2/M transition of mitotic cell cycle | 10/2311 | 27/18723 | 9.25e-04 | 7.84e-03 | 10 |
| GO:00448392 | Cervix | CC | cell cycle G2/M phase transition | 31/2311 | 148/18723 | 2.07e-03 | 1.51e-02 | 31 |
| GO:00000862 | Cervix | CC | G2/M transition of mitotic cell cycle | 29/2311 | 137/18723 | 2.40e-03 | 1.70e-02 | 29 |
| GO:00482851 | Cervix | CC | organelle fission | 78/2311 | 488/18723 | 9.70e-03 | 4.79e-02 | 78 |
| GO:0001701 | Colorectum | AD | in utero embryonic development | 110/3918 | 367/18723 | 2.36e-05 | 4.62e-04 | 110 |
| GO:0007346 | Colorectum | AD | regulation of mitotic cell cycle | 119/3918 | 457/18723 | 4.60e-03 | 3.14e-02 | 119 |
| GO:0045787 | Colorectum | AD | positive regulation of cell cycle | 85/3918 | 313/18723 | 4.76e-03 | 3.22e-02 | 85 |
| GO:0045931 | Colorectum | AD | positive regulation of mitotic cell cycle | 37/3918 | 121/18723 | 7.88e-03 | 4.73e-02 | 37 |
| GO:00017011 | Colorectum | SER | in utero embryonic development | 77/2897 | 367/18723 | 2.77e-03 | 2.48e-02 | 77 |
| Hugo Symbol | Variant Class | Variant Classification | dbSNP RS | HGVSc | HGVSp | HGVSp Short | SWISSPROT | BIOTYPE | SIFT | PolyPhen | Tumor Sample Barcode | Tissue | Histology | Sex | Age | Stage | Therapy Types | Drugs | Outcome |
| RAD51B | SNV | Missense_Mutation | | c.751N>G | p.Ile251Val | p.I251V | | protein_coding | tolerated(0.05) | benign(0.207) | TCGA-AN-A0AK-01 | Breast | breast invasive carcinoma | Female | >=65 | I/II | Unknown | Unknown | SD |
| RAD51B | SNV | Missense_Mutation | | c.189N>T | p.Lys63Asn | p.K63N | | protein_coding | tolerated(0.11) | benign(0.422) | TCGA-EW-A1IX-01 | Breast | breast invasive carcinoma | Female | <65 | I/II | Hormone Therapy | femara | SD |
| RAD51B | deletion | Frame_Shift_Del | novel | c.1197_1200delAACT | p.Thr400SerfsTer29 | p.T400Sfs*29 | | protein_coding | | | TCGA-DG-A2KJ-01 | Cervix | cervical & endocervical cancer | Female | <65 | III/IV | Chemotherapy | cisplatin | SD |
| RAD51B | SNV | Missense_Mutation | | c.982G>T | p.Ala328Ser | p.A328S | | protein_coding | tolerated(0.45) | possibly_damaging(0.451) | TCGA-AA-A02J-01 | Colorectum | colon adenocarcinoma | Female | >=65 | III/IV | Unknown | Unknown | PD |
| RAD51B | SNV | Missense_Mutation | novel | c.120G>T | p.Lys40Asn | p.K40N | | protein_coding | deleterious(0.03) | benign(0.316) | TCGA-A5-A0G2-01 | Endometrium | uterine corpus endometrioid carcinoma | Female | <65 | III/IV | Unknown | Unknown | SD |
| RAD51B | SNV | Missense_Mutation | | c.111N>T | p.Glu37Asp | p.E37D | | protein_coding | tolerated(0.17) | benign(0.263) | TCGA-AP-A0LM-01 | Endometrium | uterine corpus endometrioid carcinoma | Female | <65 | III/IV | Chemotherapy | cisplatin | SD |
| RAD51B | SNV | Missense_Mutation | novel | c.653A>C | p.Lys218Thr | p.K218T | | protein_coding | tolerated(0.11) | benign(0.285) | TCGA-AP-A1DK-01 | Endometrium | uterine corpus endometrioid carcinoma | Female | <65 | I/II | Unknown | Unknown | SD |
| RAD51B | SNV | Missense_Mutation | novel | c.521N>T | p.Ser174Ile | p.S174I | | protein_coding | deleterious(0.01) | benign(0.029) | TCGA-AX-A05Z-01 | Endometrium | uterine corpus endometrioid carcinoma | Female | <65 | III/IV | Chemotherapy | adriamycin | SD |
| RAD51B | SNV | Missense_Mutation | novel | c.578A>C | p.Glu193Ala | p.E193A | | protein_coding | deleterious(0.02) | benign(0.238) | TCGA-AX-A1CE-01 | Endometrium | uterine corpus endometrioid carcinoma | Female | <65 | I/II | Unspecific | Paclitaxel | SD |
| RAD51B | SNV | Missense_Mutation | novel | c.398N>A | p.Gly133Glu | p.G133E | | protein_coding | deleterious(0) | probably_damaging(0.999) | TCGA-AX-A2HC-01 | Endometrium | uterine corpus endometrioid carcinoma | Female | <65 | III/IV | Chemotherapy | paclitaxel | PD |


