
|
|||||
|
 | |
| |
| |
| |
| |
| |
|
Gene: RAD23B |
Gene summary for RAD23B |
| Gene information | Species | Human | Gene symbol | RAD23B | Gene ID | 5887 |
| Gene name | RAD23 homolog B, nucleotide excision repair protein | |
| Gene Alias | HHR23B | |
| Cytomap | 9q31.2 | |
| Gene Type | protein-coding | GO ID | GO:0000003 | UniProtAcc | B7Z4W4 |
Top |
Malignant transformation analysis |
| Identification of the aberrant gene expression in precancerous and cancerous lesions by comparing the gene expression of stem-like cells in diseased tissues with normal stem cells |
| Entrez ID | Symbol | Replicates | Species | Organ | Tissue | Adj P-value | Log2FC | Malignancy |
| 5887 | RAD23B | CA_HPV_1 | Human | Cervix | CC | 1.02e-02 | -5.32e-02 | 0.0264 |
| 5887 | RAD23B | CCI_1 | Human | Cervix | CC | 1.36e-03 | 5.63e-01 | 0.528 |
| 5887 | RAD23B | CCI_2 | Human | Cervix | CC | 8.08e-03 | 6.70e-01 | 0.5249 |
| 5887 | RAD23B | CCI_3 | Human | Cervix | CC | 5.96e-06 | 6.05e-01 | 0.516 |
| 5887 | RAD23B | T3 | Human | Cervix | CC | 2.43e-03 | 2.70e-01 | 0.1389 |
| 5887 | RAD23B | LZE4T | Human | Esophagus | ESCC | 1.13e-15 | 4.53e-02 | 0.0811 |
| 5887 | RAD23B | LZE8T | Human | Esophagus | ESCC | 4.11e-02 | -4.98e-02 | 0.067 |
| 5887 | RAD23B | LZE20T | Human | Esophagus | ESCC | 3.97e-03 | 1.98e-01 | 0.0662 |
| 5887 | RAD23B | LZE22D1 | Human | Esophagus | HGIN | 1.27e-07 | -1.31e-01 | 0.0595 |
| 5887 | RAD23B | LZE24T | Human | Esophagus | ESCC | 4.30e-17 | 6.37e-01 | 0.0596 |
| 5887 | RAD23B | LZE6T | Human | Esophagus | ESCC | 3.58e-02 | -4.10e-03 | 0.0845 |
| 5887 | RAD23B | P1T-E | Human | Esophagus | ESCC | 1.08e-03 | 6.46e-01 | 0.0875 |
| 5887 | RAD23B | P2T-E | Human | Esophagus | ESCC | 6.55e-59 | 1.39e+00 | 0.1177 |
| 5887 | RAD23B | P4T-E | Human | Esophagus | ESCC | 5.11e-43 | 1.29e+00 | 0.1323 |
| 5887 | RAD23B | P5T-E | Human | Esophagus | ESCC | 2.01e-60 | 1.56e+00 | 0.1327 |
| 5887 | RAD23B | P8T-E | Human | Esophagus | ESCC | 1.84e-17 | 4.30e-01 | 0.0889 |
| 5887 | RAD23B | P9T-E | Human | Esophagus | ESCC | 1.96e-16 | 5.83e-01 | 0.1131 |
| 5887 | RAD23B | P10T-E | Human | Esophagus | ESCC | 4.76e-29 | 7.28e-01 | 0.116 |
| 5887 | RAD23B | P11T-E | Human | Esophagus | ESCC | 2.75e-15 | 1.10e+00 | 0.1426 |
| 5887 | RAD23B | P12T-E | Human | Esophagus | ESCC | 5.83e-24 | 6.68e-01 | 0.1122 |
| Page: 1 2 3 4 5 6 7 |
| Tissue | Expression Dynamics | Abbreviation |
| Cervix |  | CC: Cervix cancer |
| HSIL_HPV: HPV-infected high-grade squamous intraepithelial lesions | ||
| N_HPV: HPV-infected normal cervix | ||
| Esophagus |  | ESCC: Esophageal squamous cell carcinoma |
| HGIN: High-grade intraepithelial neoplasias | ||
| LGIN: Low-grade intraepithelial neoplasias | ||
| Liver |  | HCC: Hepatocellular carcinoma |
| NAFLD: Non-alcoholic fatty liver disease | ||
| Oral Cavity | 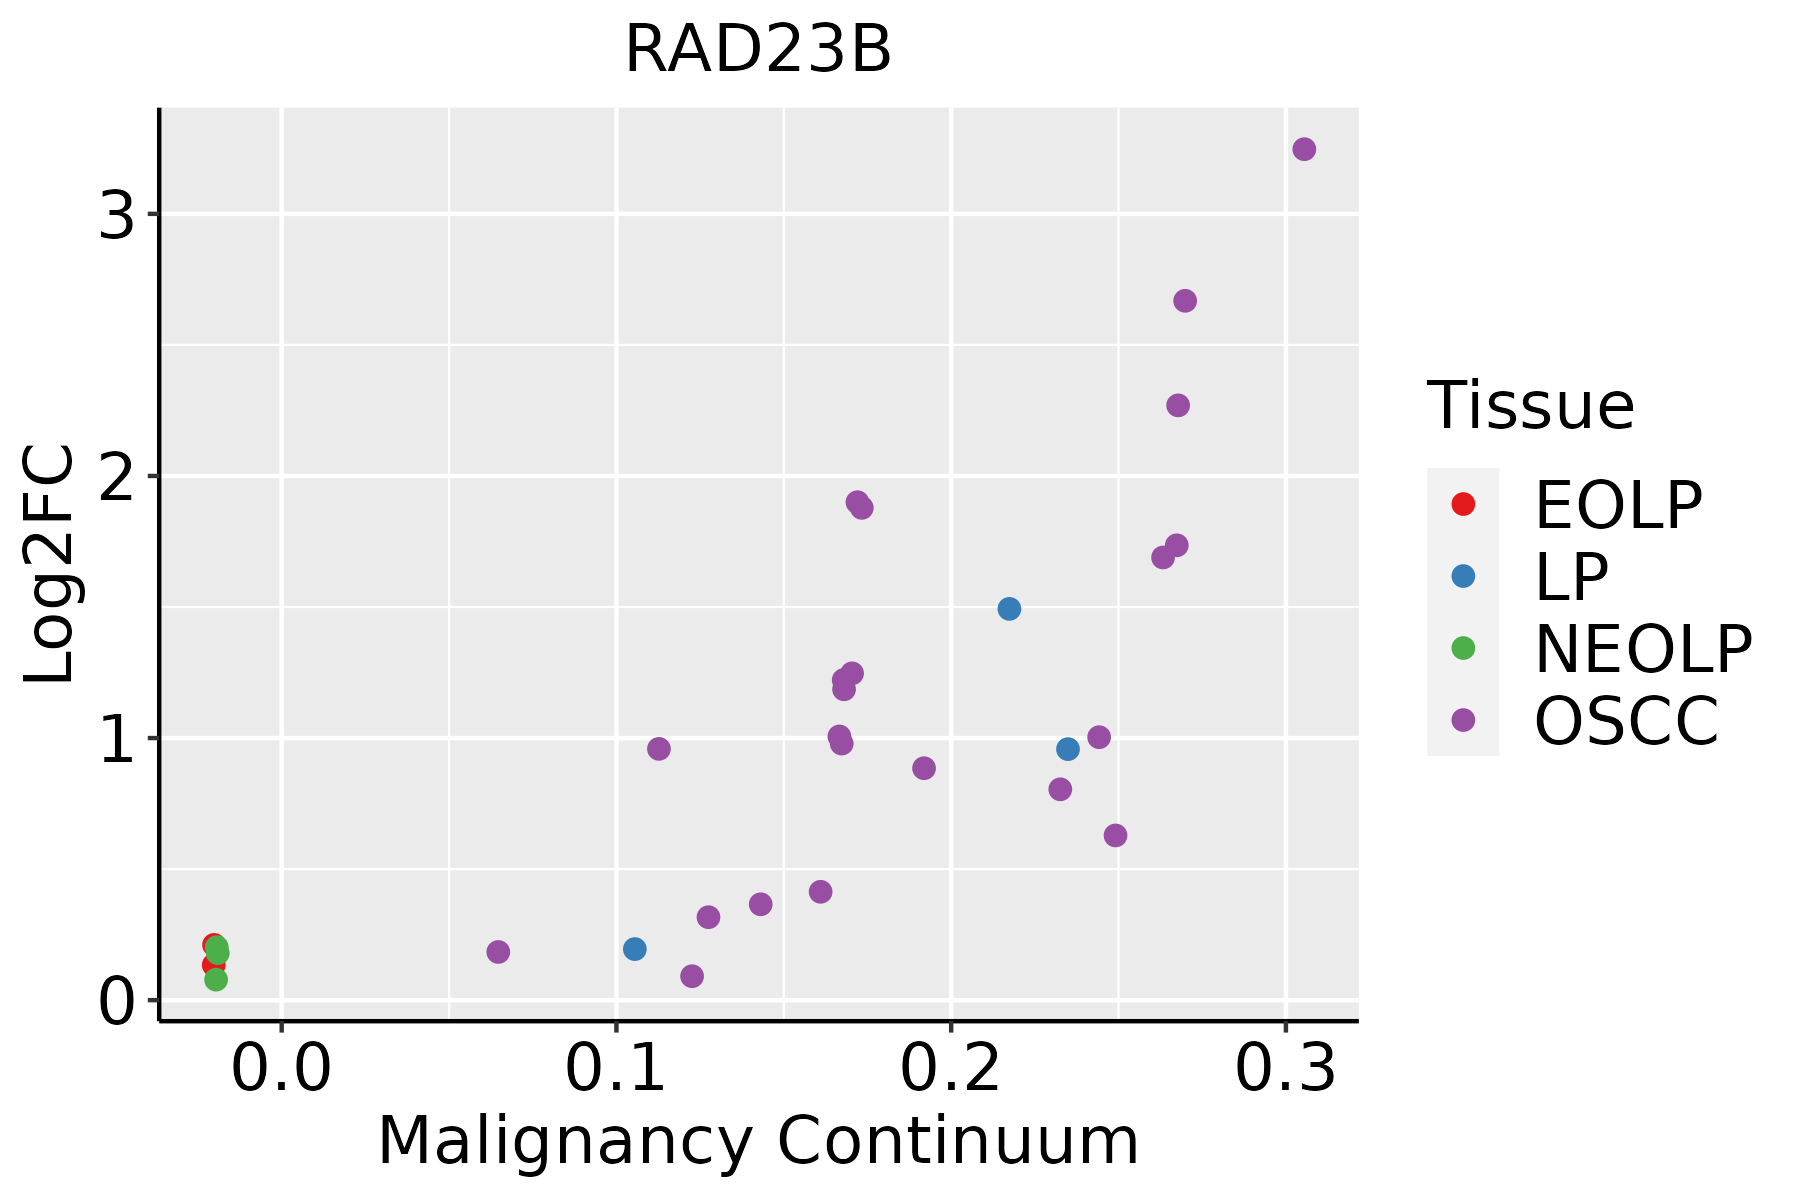 | EOLP: Erosive Oral lichen planus |
| LP: leukoplakia | ||
| NEOLP: Non-erosive oral lichen planus | ||
| OSCC: Oral squamous cell carcinoma | ||
| Prostate |  | BPH: Benign Prostatic Hyperplasia |
| Skin | 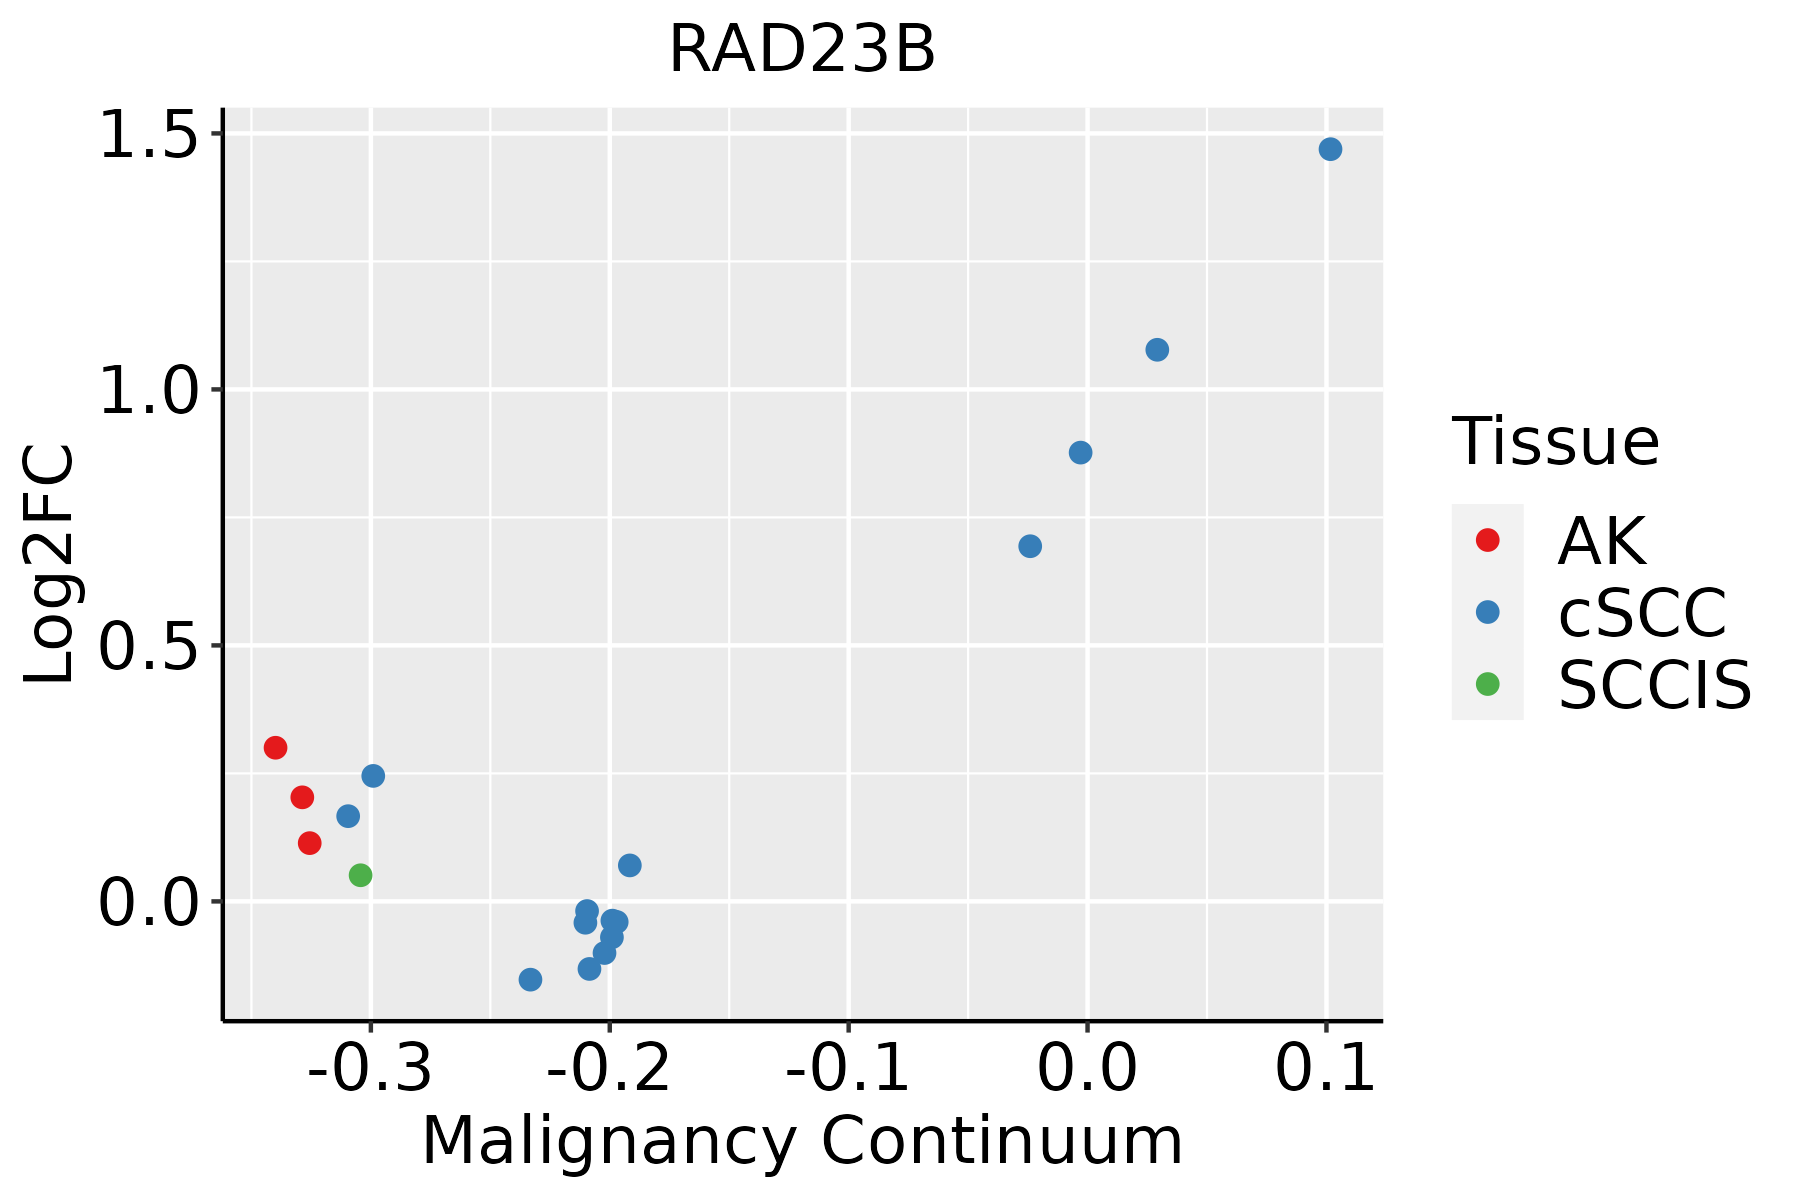 | AK: Actinic keratosis |
| cSCC: Cutaneous squamous cell carcinoma | ||
| SCCIS:squamous cell carcinoma in situ | ||
| Thyroid |  | ATC: Anaplastic thyroid cancer |
| HT: Hashimoto's thyroiditis | ||
| PTC: Papillary thyroid cancer |
| ∗log2FC in expression of this searched gene in stem-like cells from each diseased tissue sample relative to stem-like cells in normal samples in each tissue plotted against the malignancy continuum. Samples are colored based on if they are from different disease stage. |
Top |
Malignant transformation related pathway analysis |
| Find out the enriched GO biological processes and KEGG pathways involved in transition from healthy to precancer to cancer |
| Tissue | Disease Stage | Enriched GO biological Processes |
| Colorectum | AD |  |
| Colorectum | SER |  |
| Colorectum | MSS |  |
| Colorectum | MSI-H |  |
| Colorectum | FAP |  |
| ∗Top 15 enriched GO BP terms are showed in the bar plot of each disease state in each tissue. Each row represents a significant GO biological process which is colored according to the -log10(p.adjust). |
| Page: 1 2 3 4 5 6 7 8 9 |
| GO ID | Tissue | Disease Stage | Description | Gene Ratio | Bg Ratio | pvalue | p.adjust | Count |
| GO:004217610 | Cervix | CC | regulation of protein catabolic process | 104/2311 | 391/18723 | 9.39e-15 | 9.36e-12 | 104 |
| GO:190336210 | Cervix | CC | regulation of cellular protein catabolic process | 72/2311 | 255/18723 | 5.98e-12 | 2.10e-09 | 72 |
| GO:001049810 | Cervix | CC | proteasomal protein catabolic process | 111/2311 | 490/18723 | 8.98e-11 | 1.58e-08 | 111 |
| GO:190305010 | Cervix | CC | regulation of proteolysis involved in cellular protein catabolic process | 60/2311 | 221/18723 | 1.82e-09 | 1.98e-07 | 60 |
| GO:200005810 | Cervix | CC | regulation of ubiquitin-dependent protein catabolic process | 47/2311 | 164/18723 | 1.63e-08 | 1.25e-06 | 47 |
| GO:004316110 | Cervix | CC | proteasome-mediated ubiquitin-dependent protein catabolic process | 91/2311 | 412/18723 | 1.65e-08 | 1.25e-06 | 91 |
| GO:006113610 | Cervix | CC | regulation of proteasomal protein catabolic process | 48/2311 | 187/18723 | 4.63e-07 | 1.77e-05 | 48 |
| GO:003243410 | Cervix | CC | regulation of proteasomal ubiquitin-dependent protein catabolic process | 38/2311 | 134/18723 | 4.99e-07 | 1.88e-05 | 38 |
| GO:00987609 | Cervix | CC | response to interleukin-7 | 7/2311 | 15/18723 | 1.13e-03 | 9.29e-03 | 7 |
| GO:00987619 | Cervix | CC | cellular response to interleukin-7 | 7/2311 | 15/18723 | 1.13e-03 | 9.29e-03 | 7 |
| GO:004217627 | Esophagus | HGIN | regulation of protein catabolic process | 119/2587 | 391/18723 | 8.09e-18 | 2.43e-15 | 119 |
| GO:001049826 | Esophagus | HGIN | proteasomal protein catabolic process | 139/2587 | 490/18723 | 1.20e-17 | 3.41e-15 | 139 |
| GO:004316126 | Esophagus | HGIN | proteasome-mediated ubiquitin-dependent protein catabolic process | 114/2587 | 412/18723 | 7.00e-14 | 1.20e-11 | 114 |
| GO:190336227 | Esophagus | HGIN | regulation of cellular protein catabolic process | 81/2587 | 255/18723 | 1.16e-13 | 1.93e-11 | 81 |
| GO:190305027 | Esophagus | HGIN | regulation of proteolysis involved in cellular protein catabolic process | 70/2587 | 221/18723 | 6.21e-12 | 7.76e-10 | 70 |
| GO:006113627 | Esophagus | HGIN | regulation of proteasomal protein catabolic process | 60/2587 | 187/18723 | 1.10e-10 | 1.12e-08 | 60 |
| GO:200005827 | Esophagus | HGIN | regulation of ubiquitin-dependent protein catabolic process | 53/2587 | 164/18723 | 9.89e-10 | 8.13e-08 | 53 |
| GO:003243427 | Esophagus | HGIN | regulation of proteasomal ubiquitin-dependent protein catabolic process | 45/2587 | 134/18723 | 4.64e-09 | 3.12e-07 | 45 |
| GO:009876019 | Esophagus | HGIN | response to interleukin-7 | 8/2587 | 15/18723 | 3.41e-04 | 5.55e-03 | 8 |
| GO:009876119 | Esophagus | HGIN | cellular response to interleukin-7 | 8/2587 | 15/18723 | 3.41e-04 | 5.55e-03 | 8 |
| Page: 1 2 3 4 5 6 7 8 |
| Pathway ID | Tissue | Disease Stage | Description | Gene Ratio | Bg Ratio | pvalue | p.adjust | qvalue | Count |
| hsa0414120 | Cervix | CC | Protein processing in endoplasmic reticulum | 55/1267 | 174/8465 | 1.74e-08 | 2.68e-07 | 1.58e-07 | 55 |
| hsa04141110 | Cervix | CC | Protein processing in endoplasmic reticulum | 55/1267 | 174/8465 | 1.74e-08 | 2.68e-07 | 1.58e-07 | 55 |
| hsa0414139 | Esophagus | HGIN | Protein processing in endoplasmic reticulum | 67/1383 | 174/8465 | 1.06e-12 | 2.16e-11 | 1.72e-11 | 67 |
| hsa034205 | Esophagus | HGIN | Nucleotide excision repair | 29/1383 | 63/8465 | 2.96e-08 | 5.36e-07 | 4.26e-07 | 29 |
| hsa04141114 | Esophagus | HGIN | Protein processing in endoplasmic reticulum | 67/1383 | 174/8465 | 1.06e-12 | 2.16e-11 | 1.72e-11 | 67 |
| hsa0342012 | Esophagus | HGIN | Nucleotide excision repair | 29/1383 | 63/8465 | 2.96e-08 | 5.36e-07 | 4.26e-07 | 29 |
| hsa04141211 | Esophagus | ESCC | Protein processing in endoplasmic reticulum | 147/4205 | 174/8465 | 3.29e-22 | 1.10e-19 | 5.64e-20 | 147 |
| hsa0342022 | Esophagus | ESCC | Nucleotide excision repair | 54/4205 | 63/8465 | 2.01e-09 | 2.17e-08 | 1.11e-08 | 54 |
| hsa04141310 | Esophagus | ESCC | Protein processing in endoplasmic reticulum | 147/4205 | 174/8465 | 3.29e-22 | 1.10e-19 | 5.64e-20 | 147 |
| hsa0342032 | Esophagus | ESCC | Nucleotide excision repair | 54/4205 | 63/8465 | 2.01e-09 | 2.17e-08 | 1.11e-08 | 54 |
| hsa0414114 | Liver | Cirrhotic | Protein processing in endoplasmic reticulum | 114/2530 | 174/8465 | 1.16e-22 | 9.67e-21 | 5.96e-21 | 114 |
| hsa03420 | Liver | Cirrhotic | Nucleotide excision repair | 29/2530 | 63/8465 | 4.81e-03 | 1.74e-02 | 1.07e-02 | 29 |
| hsa0414115 | Liver | Cirrhotic | Protein processing in endoplasmic reticulum | 114/2530 | 174/8465 | 1.16e-22 | 9.67e-21 | 5.96e-21 | 114 |
| hsa034201 | Liver | Cirrhotic | Nucleotide excision repair | 29/2530 | 63/8465 | 4.81e-03 | 1.74e-02 | 1.07e-02 | 29 |
| hsa0414122 | Liver | HCC | Protein processing in endoplasmic reticulum | 146/4020 | 174/8465 | 7.34e-24 | 2.46e-21 | 1.37e-21 | 146 |
| hsa034202 | Liver | HCC | Nucleotide excision repair | 41/4020 | 63/8465 | 3.59e-03 | 1.12e-02 | 6.22e-03 | 41 |
| hsa0414132 | Liver | HCC | Protein processing in endoplasmic reticulum | 146/4020 | 174/8465 | 7.34e-24 | 2.46e-21 | 1.37e-21 | 146 |
| hsa034203 | Liver | HCC | Nucleotide excision repair | 41/4020 | 63/8465 | 3.59e-03 | 1.12e-02 | 6.22e-03 | 41 |
| hsa0414130 | Oral cavity | OSCC | Protein processing in endoplasmic reticulum | 143/3704 | 174/8465 | 6.82e-26 | 2.28e-23 | 1.16e-23 | 143 |
| hsa034204 | Oral cavity | OSCC | Nucleotide excision repair | 49/3704 | 63/8465 | 3.48e-08 | 2.91e-07 | 1.48e-07 | 49 |
| Page: 1 2 |
Top |
Cell-cell communication analysis |
| Identification of potential cell-cell interactions between two cell types and their ligand-receptor pairs for different disease states |
| Ligand | Receptor | LRpair | Pathway | Tissue | Disease Stage |
| Page: 1 |
Top |
Single-cell gene regulatory network inference analysis |
| Find out the significant the regulons (TFs) and the target genes of each regulon across cell types for different disease states |
| TF | Cell Type | Tissue | Disease Stage | Target Gene | RSS | Regulon Activity |
| ∗The dot plots of a searched regulon are shown for all cell subpopulations in each disease state of each tissue based on the regulon specific score inferred using pySCENIC and by calculating the average expression. |
| Page: 1 |
Top |
Somatic mutation of malignant transformation related genes |
| Annotation of somatic variants for genes involved in malignant transformation |
| Hugo Symbol | Variant Class | Variant Classification | dbSNP RS | HGVSc | HGVSp | HGVSp Short | SWISSPROT | BIOTYPE | SIFT | PolyPhen | Tumor Sample Barcode | Tissue | Histology | Sex | Age | Stage | Therapy Types | Drugs | Outcome |
| RAD23B | SNV | Missense_Mutation | c.1180N>A | p.Glu394Lys | p.E394K | P54727 | protein_coding | deleterious(0.02) | probably_damaging(0.951) | TCGA-AC-A23H-01 | Breast | breast invasive carcinoma | Female | >=65 | I/II | Unknown | Unknown | PD | |
| RAD23B | SNV | Missense_Mutation | novel | c.586G>A | p.Glu196Lys | p.E196K | P54727 | protein_coding | deleterious(0.01) | probably_damaging(0.96) | TCGA-AR-A2LE-01 | Breast | breast invasive carcinoma | Female | >=65 | I/II | Hormone Therapy | tamoxiphen | PD |
| RAD23B | SNV | Missense_Mutation | c.866N>A | p.Arg289Lys | p.R289K | P54727 | protein_coding | deleterious(0.01) | probably_damaging(0.966) | TCGA-BH-A0WA-01 | Breast | breast invasive carcinoma | Female | >=65 | I/II | Unknown | Unknown | SD | |
| RAD23B | SNV | Missense_Mutation | c.448N>A | p.Glu150Lys | p.E150K | P54727 | protein_coding | deleterious(0.02) | probably_damaging(0.971) | TCGA-C5-A1BL-01 | Cervix | cervical & endocervical cancer | Female | <65 | I/II | Unknown | Unknown | SD | |
| RAD23B | SNV | Missense_Mutation | c.1016N>C | p.Gly339Ala | p.G339A | P54727 | protein_coding | tolerated(0.6) | benign(0.267) | TCGA-EK-A2R8-01 | Cervix | cervical & endocervical cancer | Female | <65 | I/II | Unknown | Unknown | SD | |
| RAD23B | SNV | Missense_Mutation | rs140228782 | c.923G>A | p.Arg308Gln | p.R308Q | P54727 | protein_coding | tolerated(0.71) | benign(0.203) | TCGA-MU-A51Y-01 | Cervix | cervical & endocervical cancer | Female | <65 | I/II | Unknown | Unknown | SD |
| RAD23B | SNV | Missense_Mutation | novel | c.1111N>C | p.Glu371Gln | p.E371Q | P54727 | protein_coding | deleterious(0) | probably_damaging(0.999) | TCGA-MY-A5BF-01 | Cervix | cervical & endocervical cancer | Female | >=65 | I/II | Chemotherapy | cisplatin | CR |
| RAD23B | SNV | Missense_Mutation | c.629N>T | p.Ala210Val | p.A210V | P54727 | protein_coding | deleterious(0) | probably_damaging(0.999) | TCGA-AA-3672-01 | Colorectum | colon adenocarcinoma | Female | >=65 | III/IV | Unknown | Unknown | SD | |
| RAD23B | SNV | Missense_Mutation | c.1157N>T | p.Ala386Val | p.A386V | P54727 | protein_coding | deleterious(0.03) | probably_damaging(0.954) | TCGA-AA-3684-01 | Colorectum | colon adenocarcinoma | Female | >=65 | III/IV | Unknown | Unknown | SD | |
| RAD23B | SNV | Missense_Mutation | c.557C>T | p.Thr186Met | p.T186M | P54727 | protein_coding | tolerated(0.21) | benign(0.195) | TCGA-AA-A010-01 | Colorectum | colon adenocarcinoma | Female | <65 | I/II | Chemotherapy | folinic | CR |
| Page: 1 2 3 4 |
Top |
Related drugs of malignant transformation related genes |
| Identification of chemicals and drugs interact with genes involved in malignant transfromation |
| (DGIdb 4.0) |
| Entrez ID | Symbol | Category | Interaction Types | Drug Claim Name | Drug Name | PMIDs |
| Page: 1 |

Copyright 2023-Present -The University of Texas Health Science Center at Houston |