
|
|||||
|
 | |
| |
| |
| |
| |
| |
|
Gene: RAD23A |
Gene summary for RAD23A |
| Gene information | Species | Human | Gene symbol | RAD23A | Gene ID | 5886 |
| Gene name | RAD23 homolog A, nucleotide excision repair protein | |
| Gene Alias | HHR23A | |
| Cytomap | 19p13.13 | |
| Gene Type | protein-coding | GO ID | GO:0006139 | UniProtAcc | A8K1J3 |
Top |
Malignant transformation analysis |
| Identification of the aberrant gene expression in precancerous and cancerous lesions by comparing the gene expression of stem-like cells in diseased tissues with normal stem cells |
| Entrez ID | Symbol | Replicates | Species | Organ | Tissue | Adj P-value | Log2FC | Malignancy |
| 5886 | RAD23A | AEH-subject2 | Human | Endometrium | AEH | 2.60e-05 | -1.75e-01 | -0.2525 |
| 5886 | RAD23A | AEH-subject3 | Human | Endometrium | AEH | 1.64e-02 | -1.02e-01 | -0.2576 |
| 5886 | RAD23A | AEH-subject4 | Human | Endometrium | AEH | 2.54e-03 | -2.08e-01 | -0.2657 |
| 5886 | RAD23A | EEC-subject1 | Human | Endometrium | EEC | 1.15e-10 | -2.09e-01 | -0.2682 |
| 5886 | RAD23A | EEC-subject2 | Human | Endometrium | EEC | 9.55e-07 | -2.09e-01 | -0.2607 |
| 5886 | RAD23A | EEC-subject3 | Human | Endometrium | EEC | 2.29e-24 | -3.31e-01 | -0.2525 |
| 5886 | RAD23A | EEC-subject4 | Human | Endometrium | EEC | 1.64e-03 | -1.17e-01 | -0.2571 |
| 5886 | RAD23A | GSM5276934 | Human | Endometrium | EEC | 2.83e-04 | 1.10e-01 | -0.0913 |
| 5886 | RAD23A | GSM6177620_NYU_UCEC1_lib1_lib1 | Human | Endometrium | EEC | 3.38e-23 | -1.52e-01 | -0.1869 |
| 5886 | RAD23A | GSM6177620_NYU_UCEC1_lib2_lib2 | Human | Endometrium | EEC | 1.48e-20 | -1.85e-01 | -0.1875 |
| 5886 | RAD23A | GSM6177620_NYU_UCEC1_lib3_lib3 | Human | Endometrium | EEC | 6.25e-31 | -1.43e-01 | -0.1883 |
| 5886 | RAD23A | GSM6177621_NYU_UCEC2_lib1_lib1 | Human | Endometrium | EEC | 5.30e-18 | -1.84e-01 | -0.1934 |
| 5886 | RAD23A | GSM6177622_NYU_UCEC3_lib1_lib1 | Human | Endometrium | EEC | 4.40e-31 | -2.81e-01 | -0.1917 |
| 5886 | RAD23A | GSM6177622_NYU_UCEC3_lib2_lib2 | Human | Endometrium | EEC | 2.06e-30 | -1.47e-01 | -0.1916 |
| 5886 | RAD23A | GSM6177623_NYU_UCEC3_Vis | Human | Endometrium | EEC | 3.53e-05 | -1.84e-02 | -0.1269 |
| 5886 | RAD23A | LZE2T | Human | Esophagus | ESCC | 1.34e-03 | 9.18e-01 | 0.082 |
| 5886 | RAD23A | LZE4T | Human | Esophagus | ESCC | 6.83e-26 | 1.02e+00 | 0.0811 |
| 5886 | RAD23A | LZE5T | Human | Esophagus | ESCC | 2.54e-03 | 8.41e-01 | 0.0514 |
| 5886 | RAD23A | LZE7T | Human | Esophagus | ESCC | 6.61e-27 | 1.87e+00 | 0.0667 |
| 5886 | RAD23A | LZE8T | Human | Esophagus | ESCC | 8.21e-14 | 6.54e-01 | 0.067 |
| Page: 1 2 3 4 5 6 7 8 9 |
| Tissue | Expression Dynamics | Abbreviation |
| Endometrium | 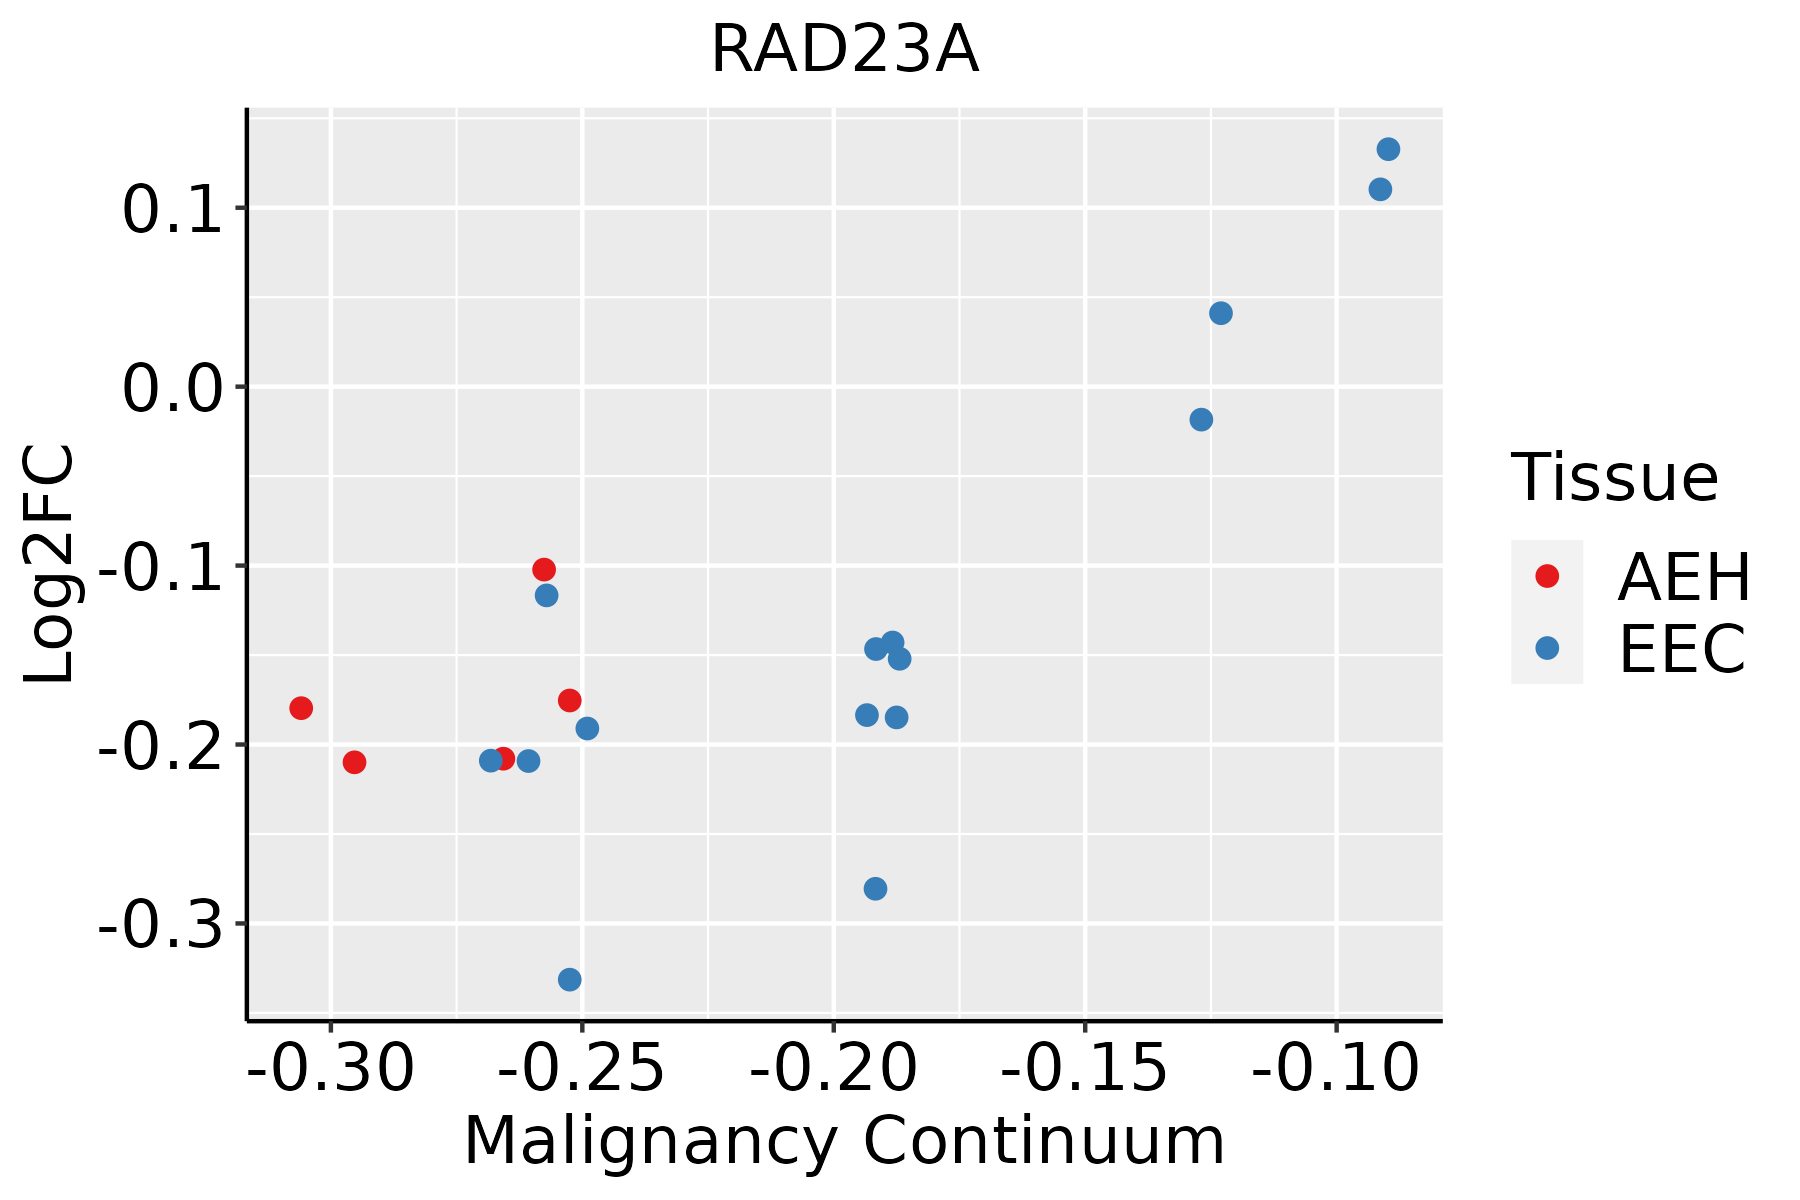 | AEH: Atypical endometrial hyperplasia |
| EEC: Endometrioid Cancer | ||
| Esophagus | 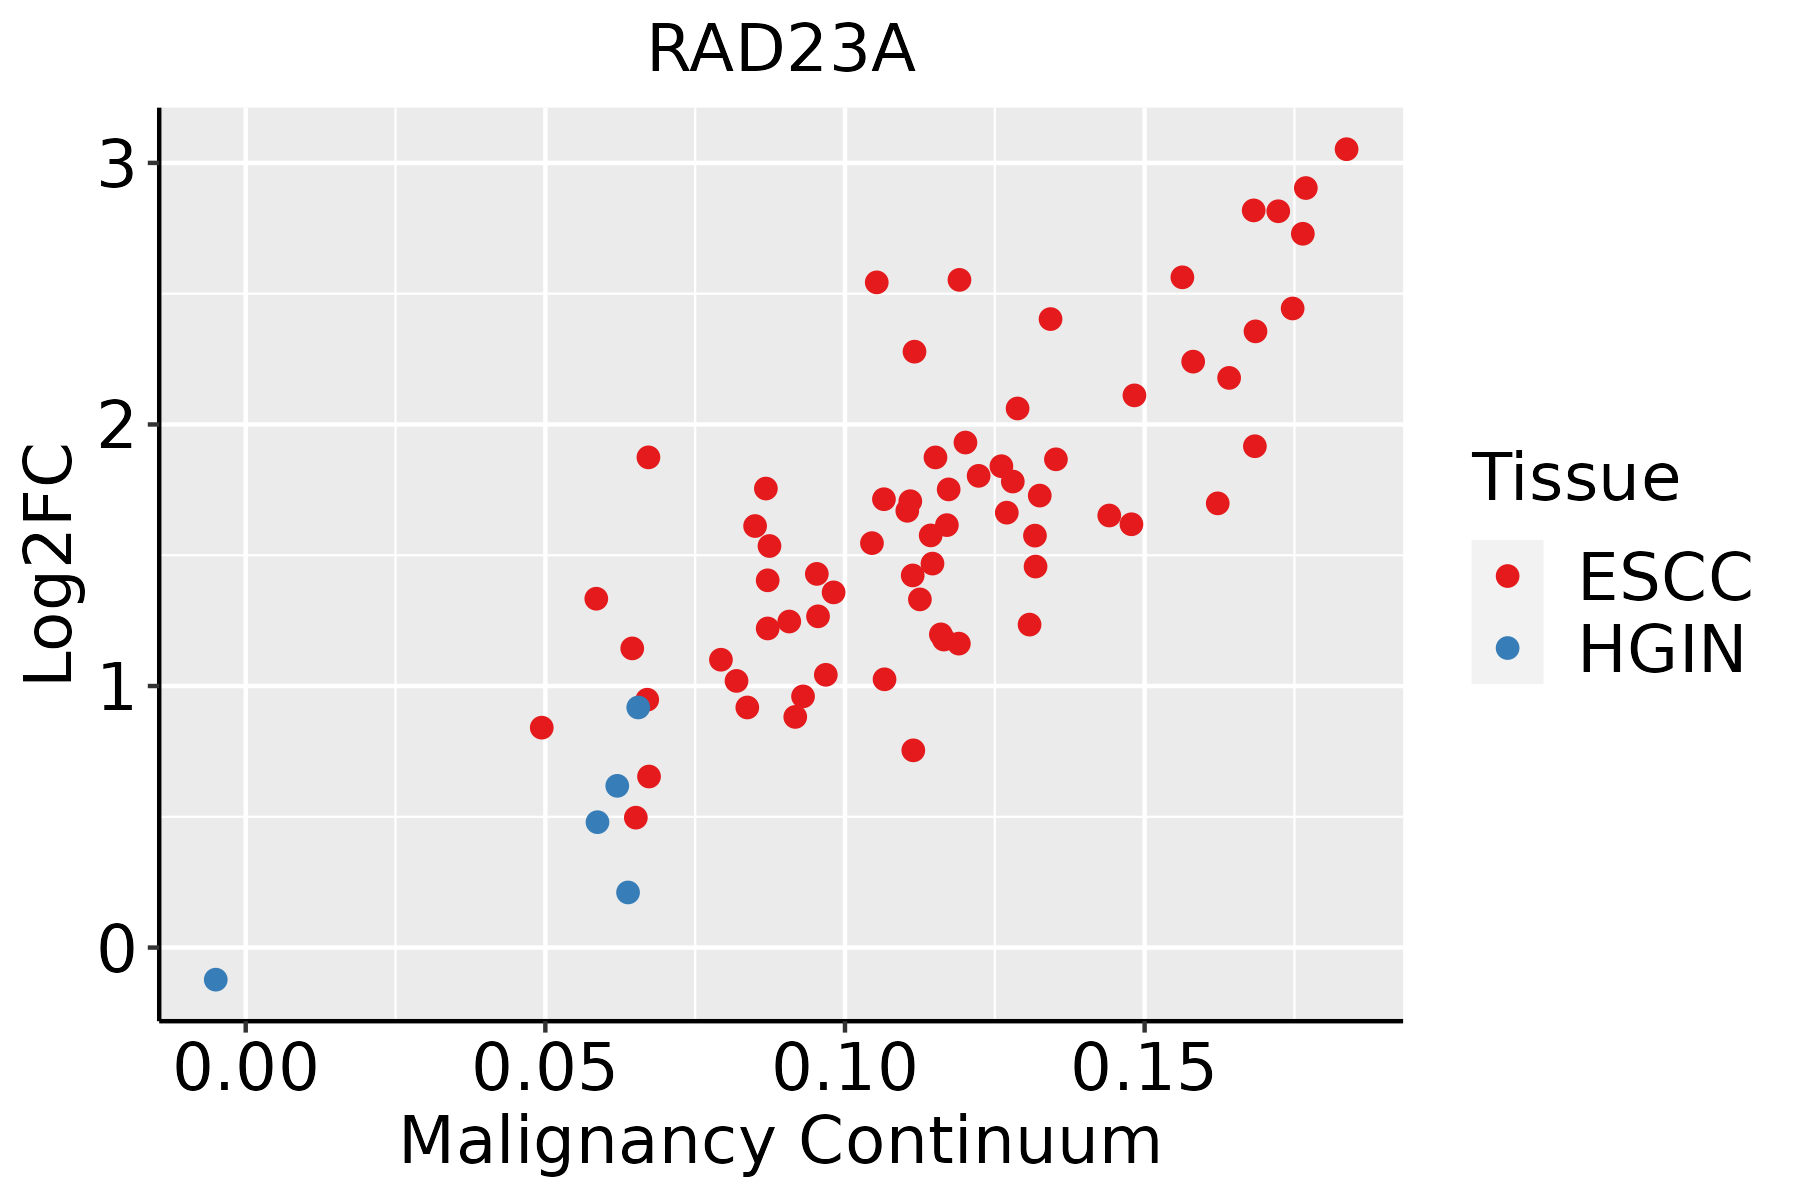 | ESCC: Esophageal squamous cell carcinoma |
| HGIN: High-grade intraepithelial neoplasias | ||
| LGIN: Low-grade intraepithelial neoplasias | ||
| Liver | 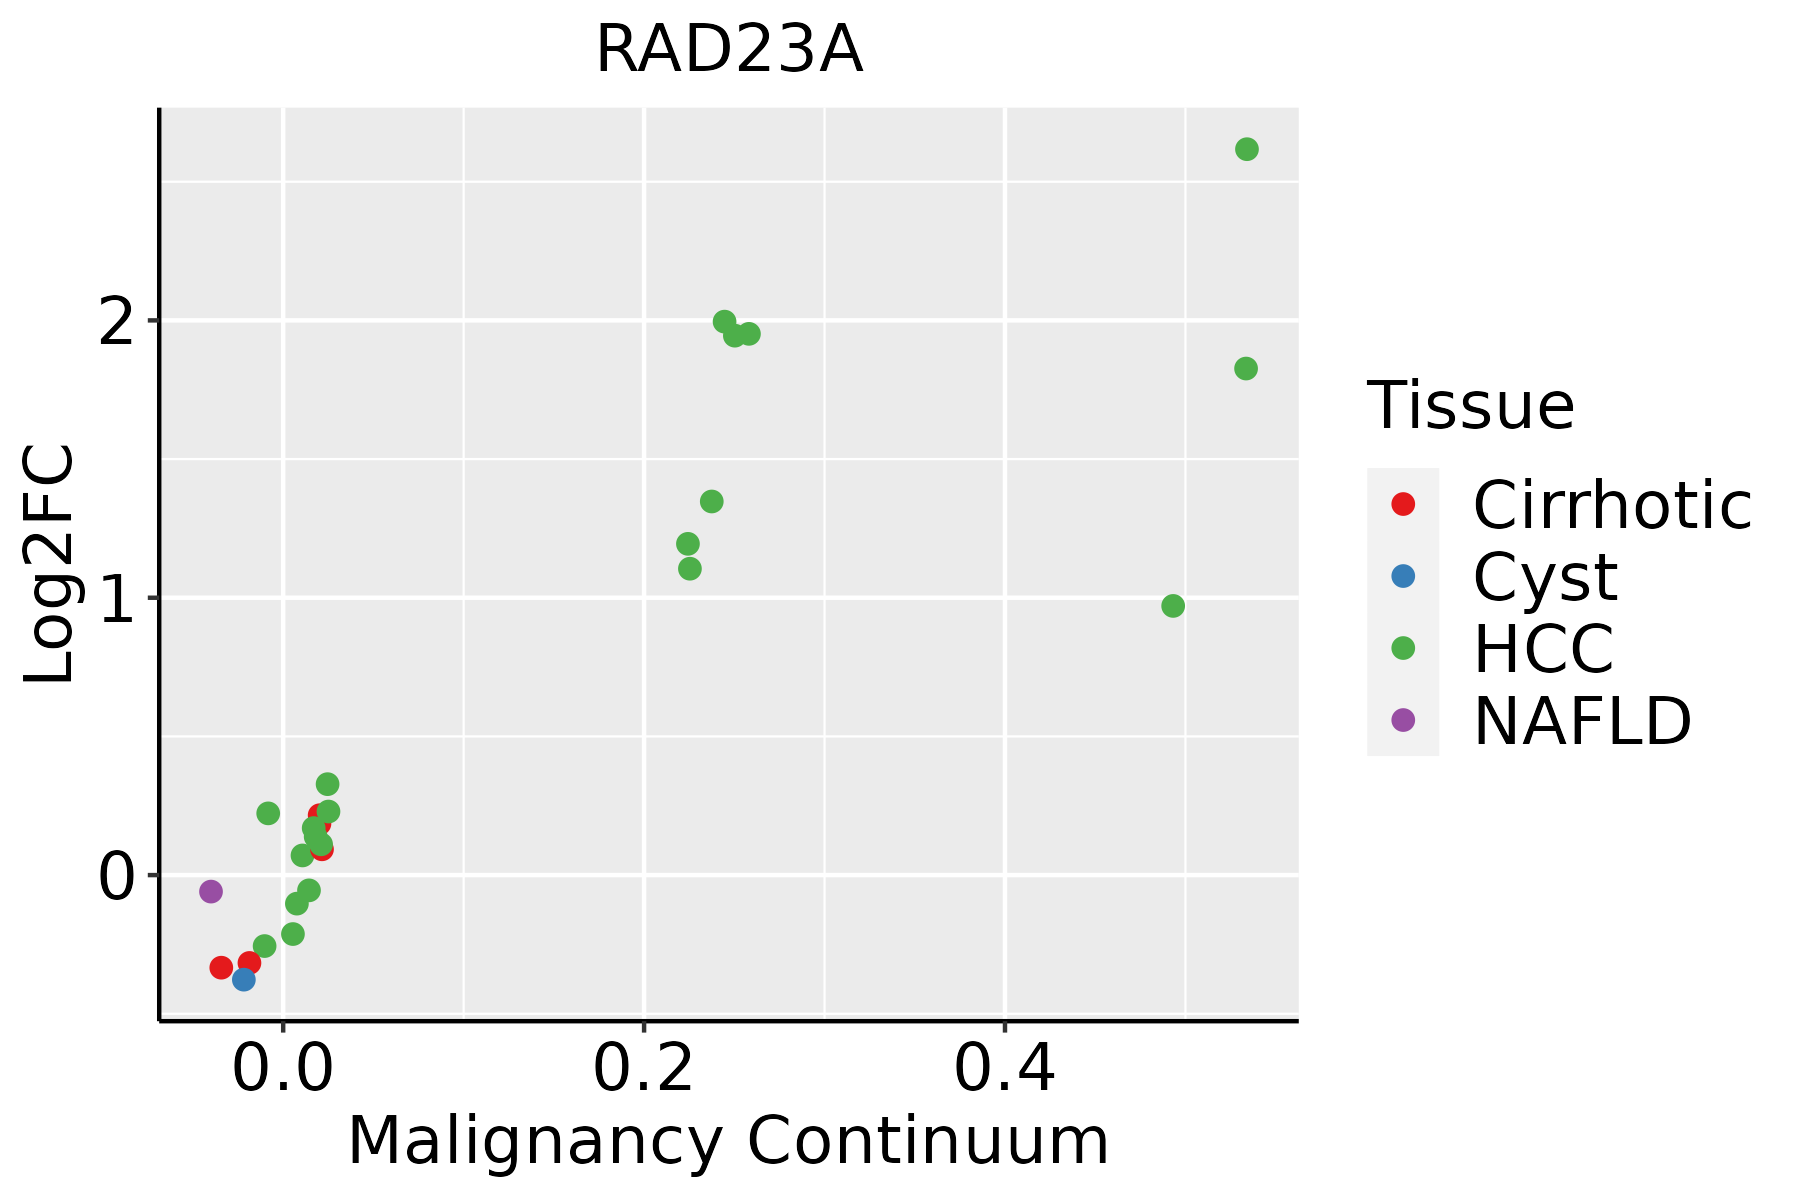 | HCC: Hepatocellular carcinoma |
| NAFLD: Non-alcoholic fatty liver disease | ||
| Oral Cavity |  | EOLP: Erosive Oral lichen planus |
| LP: leukoplakia | ||
| NEOLP: Non-erosive oral lichen planus | ||
| OSCC: Oral squamous cell carcinoma | ||
| Prostate |  | BPH: Benign Prostatic Hyperplasia |
| Skin | 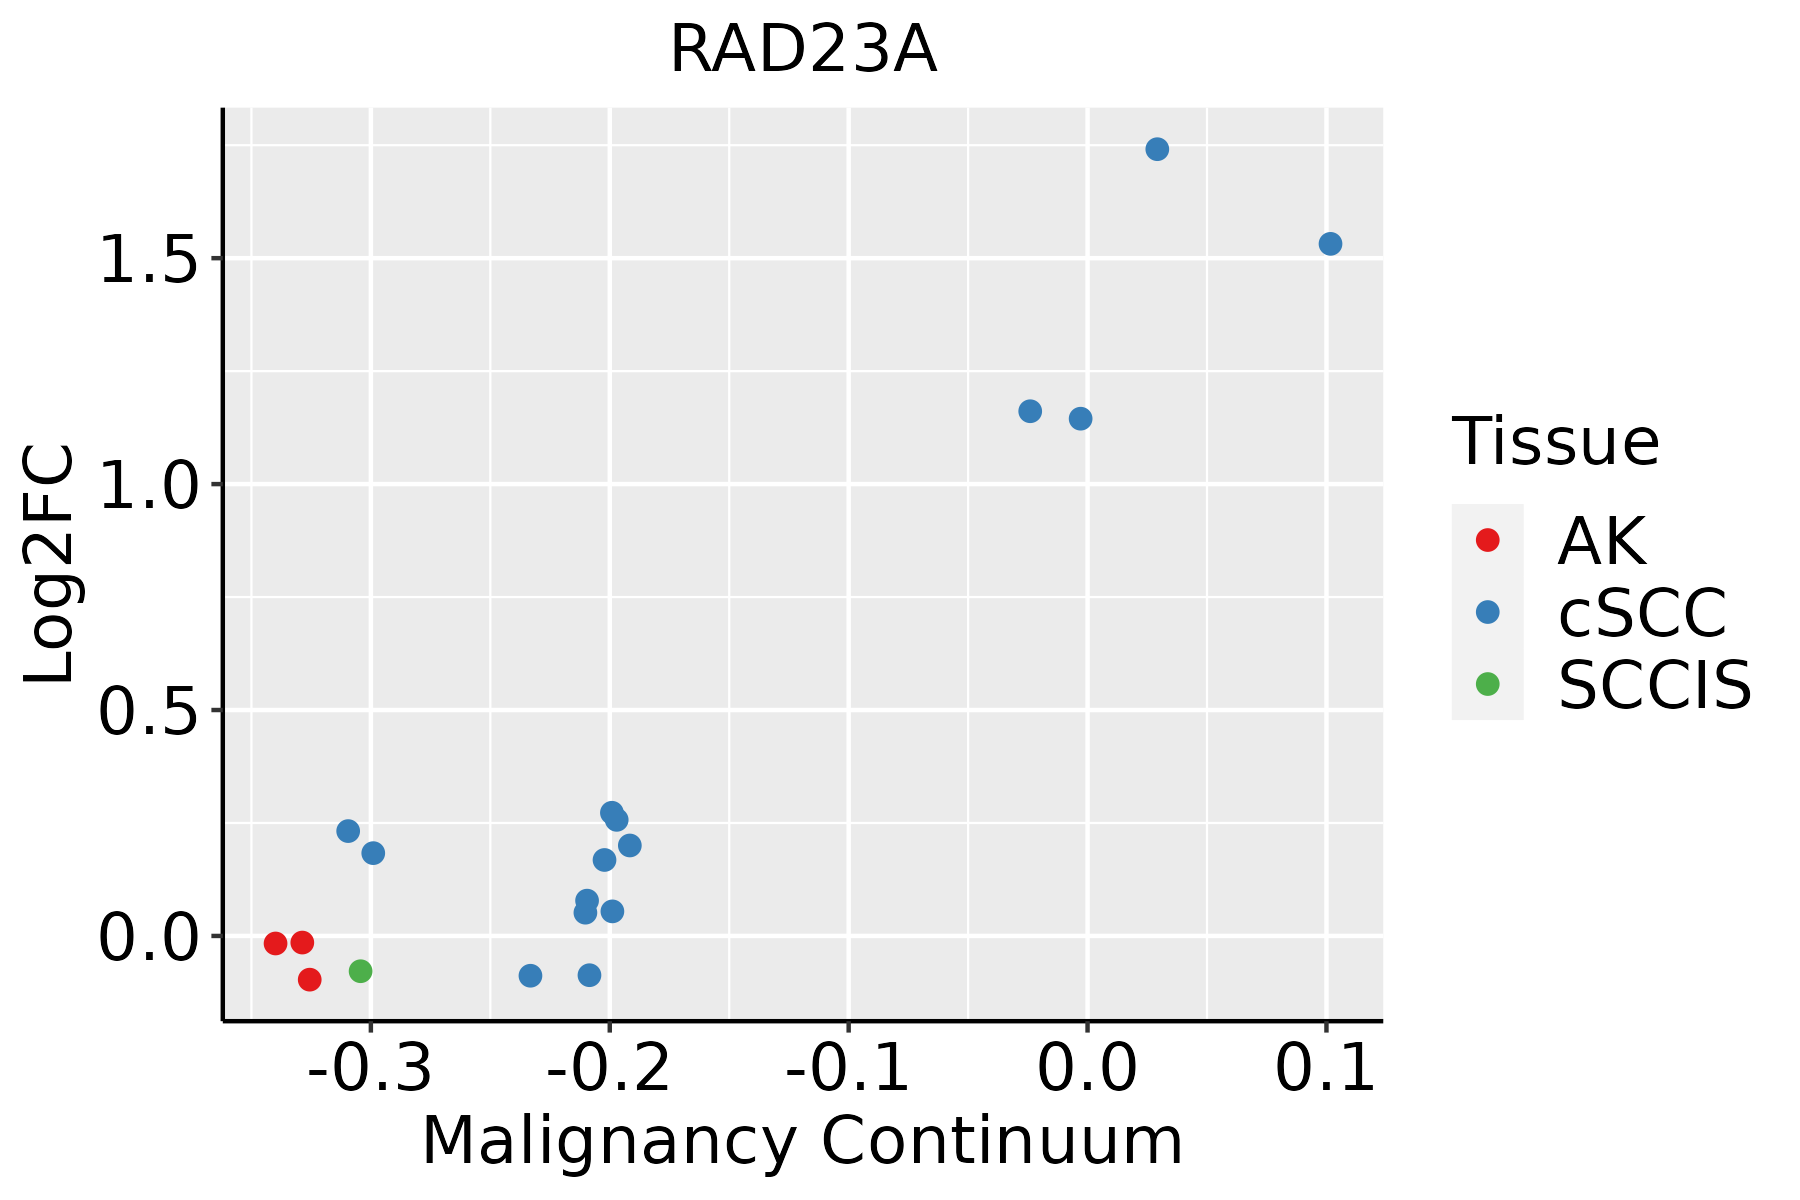 | AK: Actinic keratosis |
| cSCC: Cutaneous squamous cell carcinoma | ||
| SCCIS:squamous cell carcinoma in situ | ||
| Thyroid | 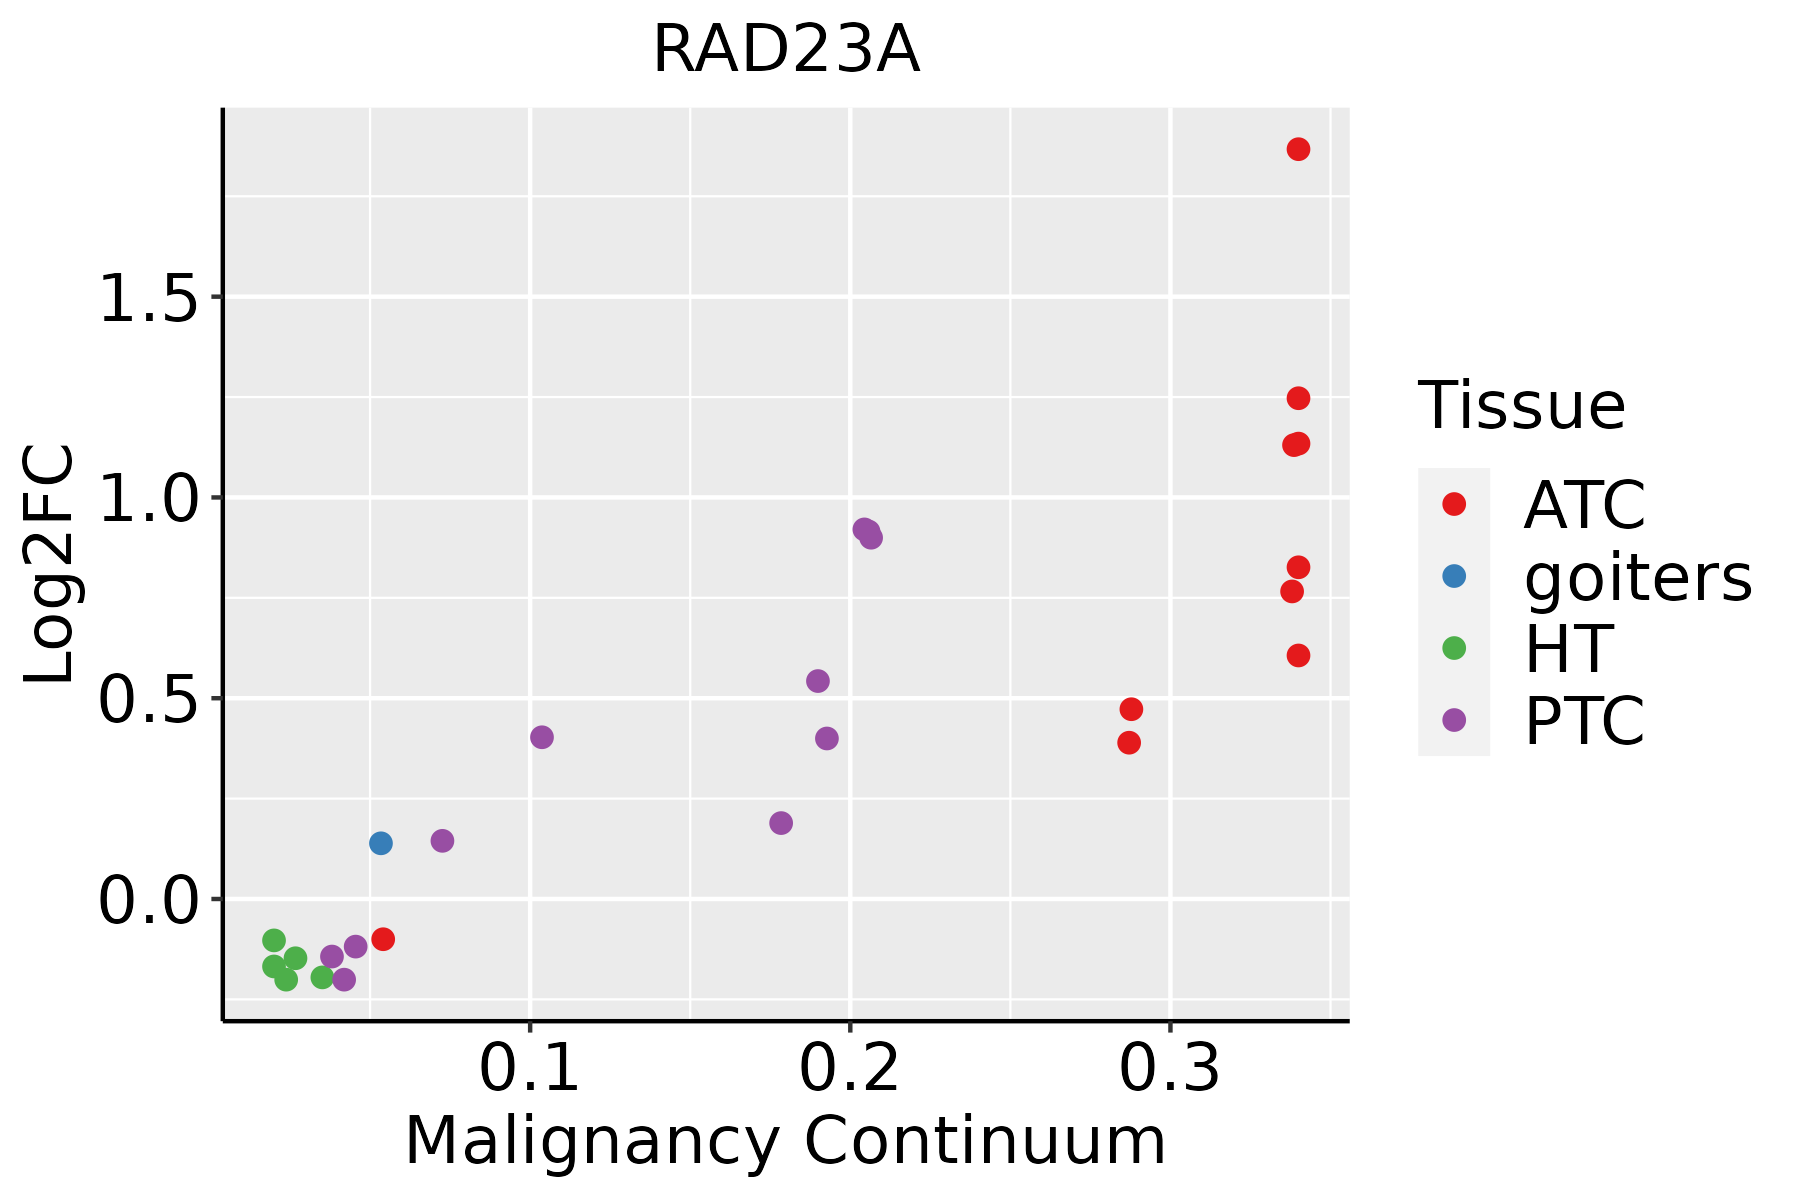 | ATC: Anaplastic thyroid cancer |
| HT: Hashimoto's thyroiditis | ||
| PTC: Papillary thyroid cancer |
| ∗log2FC in expression of this searched gene in stem-like cells from each diseased tissue sample relative to stem-like cells in normal samples in each tissue plotted against the malignancy continuum. Samples are colored based on if they are from different disease stage. |
Top |
Malignant transformation related pathway analysis |
| Find out the enriched GO biological processes and KEGG pathways involved in transition from healthy to precancer to cancer |
| Tissue | Disease Stage | Enriched GO biological Processes |
| Colorectum | AD |  |
| Colorectum | SER |  |
| Colorectum | MSS |  |
| Colorectum | MSI-H |  |
| Colorectum | FAP |  |
| ∗Top 15 enriched GO BP terms are showed in the bar plot of each disease state in each tissue. Each row represents a significant GO biological process which is colored according to the -log10(p.adjust). |
| Page: 1 2 3 4 5 6 7 8 9 |
| GO ID | Tissue | Disease Stage | Description | Gene Ratio | Bg Ratio | pvalue | p.adjust | Count |
| GO:001603216 | Endometrium | AEH | viral process | 110/2100 | 415/18723 | 1.99e-18 | 1.09e-15 | 110 |
| GO:004217616 | Endometrium | AEH | regulation of protein catabolic process | 100/2100 | 391/18723 | 9.58e-16 | 3.59e-13 | 100 |
| GO:001905816 | Endometrium | AEH | viral life cycle | 86/2100 | 317/18723 | 2.53e-15 | 7.58e-13 | 86 |
| GO:190336216 | Endometrium | AEH | regulation of cellular protein catabolic process | 70/2100 | 255/18723 | 5.40e-13 | 1.25e-10 | 70 |
| GO:003164716 | Endometrium | AEH | regulation of protein stability | 77/2100 | 298/18723 | 1.13e-12 | 2.26e-10 | 77 |
| GO:001049816 | Endometrium | AEH | proteasomal protein catabolic process | 108/2100 | 490/18723 | 2.73e-12 | 4.67e-10 | 108 |
| GO:001907916 | Endometrium | AEH | viral genome replication | 43/2100 | 131/18723 | 3.22e-11 | 4.60e-09 | 43 |
| GO:000989616 | Endometrium | AEH | positive regulation of catabolic process | 104/2100 | 492/18723 | 9.38e-11 | 1.10e-08 | 104 |
| GO:190305016 | Endometrium | AEH | regulation of proteolysis involved in cellular protein catabolic process | 58/2100 | 221/18723 | 3.58e-10 | 3.77e-08 | 58 |
| GO:003133116 | Endometrium | AEH | positive regulation of cellular catabolic process | 91/2100 | 427/18723 | 9.15e-10 | 8.31e-08 | 91 |
| GO:004316116 | Endometrium | AEH | proteasome-mediated ubiquitin-dependent protein catabolic process | 88/2100 | 412/18723 | 1.54e-09 | 1.36e-07 | 88 |
| GO:004586216 | Endometrium | AEH | positive regulation of proteolysis | 81/2100 | 372/18723 | 2.72e-09 | 2.06e-07 | 81 |
| GO:200005816 | Endometrium | AEH | regulation of ubiquitin-dependent protein catabolic process | 45/2100 | 164/18723 | 7.49e-09 | 5.22e-07 | 45 |
| GO:006113616 | Endometrium | AEH | regulation of proteasomal protein catabolic process | 49/2100 | 187/18723 | 8.64e-09 | 5.96e-07 | 49 |
| GO:004573216 | Endometrium | AEH | positive regulation of protein catabolic process | 56/2100 | 231/18723 | 1.60e-08 | 9.99e-07 | 56 |
| GO:003243416 | Endometrium | AEH | regulation of proteasomal ubiquitin-dependent protein catabolic process | 37/2100 | 134/18723 | 1.32e-07 | 6.04e-06 | 37 |
| GO:190336416 | Endometrium | AEH | positive regulation of cellular protein catabolic process | 40/2100 | 155/18723 | 3.03e-07 | 1.31e-05 | 40 |
| GO:005079216 | Endometrium | AEH | regulation of viral process | 40/2100 | 164/18723 | 1.46e-06 | 4.66e-05 | 40 |
| GO:190390016 | Endometrium | AEH | regulation of viral life cycle | 36/2100 | 148/18723 | 5.13e-06 | 1.32e-04 | 36 |
| GO:19030529 | Endometrium | AEH | positive regulation of proteolysis involved in cellular protein catabolic process | 32/2100 | 133/18723 | 2.12e-05 | 4.15e-04 | 32 |
| Page: 1 2 3 4 5 6 7 8 9 10 11 12 13 14 15 16 17 18 19 20 |
| Pathway ID | Tissue | Disease Stage | Description | Gene Ratio | Bg Ratio | pvalue | p.adjust | qvalue | Count |
| hsa0414126 | Endometrium | AEH | Protein processing in endoplasmic reticulum | 62/1197 | 174/8465 | 5.97e-13 | 1.39e-11 | 1.01e-11 | 62 |
| hsa04141111 | Endometrium | AEH | Protein processing in endoplasmic reticulum | 62/1197 | 174/8465 | 5.97e-13 | 1.39e-11 | 1.01e-11 | 62 |
| hsa0414127 | Endometrium | EEC | Protein processing in endoplasmic reticulum | 64/1237 | 174/8465 | 2.17e-13 | 5.09e-12 | 3.80e-12 | 64 |
| hsa0414136 | Endometrium | EEC | Protein processing in endoplasmic reticulum | 64/1237 | 174/8465 | 2.17e-13 | 5.09e-12 | 3.80e-12 | 64 |
| hsa0414139 | Esophagus | HGIN | Protein processing in endoplasmic reticulum | 67/1383 | 174/8465 | 1.06e-12 | 2.16e-11 | 1.72e-11 | 67 |
| hsa034205 | Esophagus | HGIN | Nucleotide excision repair | 29/1383 | 63/8465 | 2.96e-08 | 5.36e-07 | 4.26e-07 | 29 |
| hsa04141114 | Esophagus | HGIN | Protein processing in endoplasmic reticulum | 67/1383 | 174/8465 | 1.06e-12 | 2.16e-11 | 1.72e-11 | 67 |
| hsa0342012 | Esophagus | HGIN | Nucleotide excision repair | 29/1383 | 63/8465 | 2.96e-08 | 5.36e-07 | 4.26e-07 | 29 |
| hsa04141211 | Esophagus | ESCC | Protein processing in endoplasmic reticulum | 147/4205 | 174/8465 | 3.29e-22 | 1.10e-19 | 5.64e-20 | 147 |
| hsa0342022 | Esophagus | ESCC | Nucleotide excision repair | 54/4205 | 63/8465 | 2.01e-09 | 2.17e-08 | 1.11e-08 | 54 |
| hsa04141310 | Esophagus | ESCC | Protein processing in endoplasmic reticulum | 147/4205 | 174/8465 | 3.29e-22 | 1.10e-19 | 5.64e-20 | 147 |
| hsa0342032 | Esophagus | ESCC | Nucleotide excision repair | 54/4205 | 63/8465 | 2.01e-09 | 2.17e-08 | 1.11e-08 | 54 |
| hsa0414114 | Liver | Cirrhotic | Protein processing in endoplasmic reticulum | 114/2530 | 174/8465 | 1.16e-22 | 9.67e-21 | 5.96e-21 | 114 |
| hsa03420 | Liver | Cirrhotic | Nucleotide excision repair | 29/2530 | 63/8465 | 4.81e-03 | 1.74e-02 | 1.07e-02 | 29 |
| hsa0414115 | Liver | Cirrhotic | Protein processing in endoplasmic reticulum | 114/2530 | 174/8465 | 1.16e-22 | 9.67e-21 | 5.96e-21 | 114 |
| hsa034201 | Liver | Cirrhotic | Nucleotide excision repair | 29/2530 | 63/8465 | 4.81e-03 | 1.74e-02 | 1.07e-02 | 29 |
| hsa0414122 | Liver | HCC | Protein processing in endoplasmic reticulum | 146/4020 | 174/8465 | 7.34e-24 | 2.46e-21 | 1.37e-21 | 146 |
| hsa034202 | Liver | HCC | Nucleotide excision repair | 41/4020 | 63/8465 | 3.59e-03 | 1.12e-02 | 6.22e-03 | 41 |
| hsa0414132 | Liver | HCC | Protein processing in endoplasmic reticulum | 146/4020 | 174/8465 | 7.34e-24 | 2.46e-21 | 1.37e-21 | 146 |
| hsa034203 | Liver | HCC | Nucleotide excision repair | 41/4020 | 63/8465 | 3.59e-03 | 1.12e-02 | 6.22e-03 | 41 |
| Page: 1 2 |
Top |
Cell-cell communication analysis |
| Identification of potential cell-cell interactions between two cell types and their ligand-receptor pairs for different disease states |
| Ligand | Receptor | LRpair | Pathway | Tissue | Disease Stage |
| Page: 1 |
Top |
Single-cell gene regulatory network inference analysis |
| Find out the significant the regulons (TFs) and the target genes of each regulon across cell types for different disease states |
| TF | Cell Type | Tissue | Disease Stage | Target Gene | RSS | Regulon Activity |
| ∗The dot plots of a searched regulon are shown for all cell subpopulations in each disease state of each tissue based on the regulon specific score inferred using pySCENIC and by calculating the average expression. |
| Page: 1 |
Top |
Somatic mutation of malignant transformation related genes |
| Annotation of somatic variants for genes involved in malignant transformation |
| Hugo Symbol | Variant Class | Variant Classification | dbSNP RS | HGVSc | HGVSp | HGVSp Short | SWISSPROT | BIOTYPE | SIFT | PolyPhen | Tumor Sample Barcode | Tissue | Histology | Sex | Age | Stage | Therapy Types | Drugs | Outcome |
| RAD23A | deletion | Frame_Shift_Del | c.894delN | p.Glu300ArgfsTer5 | p.E300Rfs*5 | P54725 | protein_coding | TCGA-A8-A09Z-01 | Breast | breast invasive carcinoma | Female | >=65 | I/II | Unknown | Unknown | SD | |||
| RAD23A | deletion | Frame_Shift_Del | c.1000_1072delNNNNNNNNNNNNNNNNNNNNNNNNNNNNNNNNNNNNNNNNNNNNNNNNNNNNNNNNNNNNNNNNNNNNNNNNN | p.Glu334ArgfsTer23 | p.E334Rfs*23 | P54725 | protein_coding | TCGA-D8-A13Z-01 | Breast | breast invasive carcinoma | Female | <65 | I/II | Chemotherapy | doxorubicine | SD | |||
| RAD23A | SNV | Missense_Mutation | c.428N>G | p.Ser143Cys | p.S143C | P54725 | protein_coding | tolerated(0.07) | possibly_damaging(0.45) | TCGA-IR-A3LA-01 | Cervix | cervical & endocervical cancer | Female | <65 | I/II | Chemotherapy | cisplatin | CR | |
| RAD23A | insertion | Frame_Shift_Ins | novel | c.195_199dupCATCG | p.Asp67AlafsTer12 | p.D67Afs*12 | P54725 | protein_coding | TCGA-JW-A5VJ-01 | Cervix | cervical & endocervical cancer | Female | <65 | I/II | Unknown | Unknown | PD | ||
| RAD23A | SNV | Missense_Mutation | novel | c.230N>T | p.Thr77Ile | p.T77I | P54725 | protein_coding | deleterious(0) | probably_damaging(0.935) | TCGA-A6-2678-01 | Colorectum | colon adenocarcinoma | Female | <65 | III/IV | Chemotherapy | 5-fluorouracil | SD |
| RAD23A | SNV | Missense_Mutation | c.738N>T | p.Gln246His | p.Q246H | P54725 | protein_coding | deleterious(0) | probably_damaging(0.953) | TCGA-A6-5665-01 | Colorectum | colon adenocarcinoma | Female | >=65 | I/II | Unknown | Unknown | PD | |
| RAD23A | SNV | Missense_Mutation | c.845N>T | p.Gln282Leu | p.Q282L | P54725 | protein_coding | deleterious(0.02) | possibly_damaging(0.904) | TCGA-AA-3848-01 | Colorectum | colon adenocarcinoma | Female | >=65 | III/IV | Unknown | Unknown | PD | |
| RAD23A | SNV | Missense_Mutation | c.521N>A | p.Gly174Asp | p.G174D | P54725 | protein_coding | deleterious(0) | probably_damaging(1) | TCGA-CM-5341-01 | Colorectum | colon adenocarcinoma | Female | >=65 | III/IV | Chemotherapy | fluorouracil | SD | |
| RAD23A | SNV | Missense_Mutation | c.856N>A | p.Glu286Lys | p.E286K | P54725 | protein_coding | deleterious(0) | possibly_damaging(0.79) | TCGA-CM-6162-01 | Colorectum | colon adenocarcinoma | Female | <65 | III/IV | Chemotherapy | oxaliplatin | SD | |
| RAD23A | SNV | Missense_Mutation | rs754368275 | c.220G>A | p.Val74Ile | p.V74I | P54725 | protein_coding | tolerated(0.16) | probably_damaging(0.983) | TCGA-A5-A0G2-01 | Endometrium | uterine corpus endometrioid carcinoma | Female | <65 | III/IV | Unknown | Unknown | SD |
| Page: 1 2 3 4 |
Top |
Related drugs of malignant transformation related genes |
| Identification of chemicals and drugs interact with genes involved in malignant transfromation |
| (DGIdb 4.0) |
| Entrez ID | Symbol | Category | Interaction Types | Drug Claim Name | Drug Name | PMIDs |
| Page: 1 |

Copyright 2023-Present -The University of Texas Health Science Center at Houston |