
|
|||||
|
 | |
| |
| |
| |
| |
| |
|
Gene: RAD21 |
Gene summary for RAD21 |
| Gene information | Species | Human | Gene symbol | RAD21 | Gene ID | 5885 |
| Gene name | RAD21 cohesin complex component | |
| Gene Alias | CDLS4 | |
| Cytomap | 8q24.11 | |
| Gene Type | protein-coding | GO ID | GO:0000003 | UniProtAcc | A0A024R9J0 |
Top |
Malignant transformation analysis |
| Identification of the aberrant gene expression in precancerous and cancerous lesions by comparing the gene expression of stem-like cells in diseased tissues with normal stem cells |
| Entrez ID | Symbol | Replicates | Species | Organ | Tissue | Adj P-value | Log2FC | Malignancy |
| 5885 | RAD21 | GSM4909281 | Human | Breast | IDC | 1.21e-43 | 9.00e-01 | 0.21 |
| 5885 | RAD21 | GSM4909282 | Human | Breast | IDC | 3.09e-09 | 4.66e-01 | -0.0288 |
| 5885 | RAD21 | GSM4909285 | Human | Breast | IDC | 5.62e-05 | 2.99e-01 | 0.21 |
| 5885 | RAD21 | GSM4909286 | Human | Breast | IDC | 1.46e-03 | 1.85e-01 | 0.1081 |
| 5885 | RAD21 | GSM4909287 | Human | Breast | IDC | 4.80e-08 | 4.47e-01 | 0.2057 |
| 5885 | RAD21 | GSM4909288 | Human | Breast | IDC | 2.26e-03 | 1.61e-01 | 0.0988 |
| 5885 | RAD21 | GSM4909290 | Human | Breast | IDC | 8.74e-33 | 8.70e-01 | 0.2096 |
| 5885 | RAD21 | GSM4909291 | Human | Breast | IDC | 2.73e-07 | 4.83e-01 | 0.1753 |
| 5885 | RAD21 | GSM4909293 | Human | Breast | IDC | 9.04e-03 | 3.20e-01 | 0.1581 |
| 5885 | RAD21 | GSM4909295 | Human | Breast | IDC | 8.84e-08 | 5.38e-01 | 0.0898 |
| 5885 | RAD21 | GSM4909296 | Human | Breast | IDC | 1.75e-05 | -2.05e-01 | 0.1524 |
| 5885 | RAD21 | GSM4909297 | Human | Breast | IDC | 1.84e-05 | -1.34e-01 | 0.1517 |
| 5885 | RAD21 | GSM4909301 | Human | Breast | IDC | 5.44e-03 | 2.65e-01 | 0.1577 |
| 5885 | RAD21 | GSM4909304 | Human | Breast | IDC | 1.53e-05 | 2.98e-01 | 0.1636 |
| 5885 | RAD21 | GSM4909311 | Human | Breast | IDC | 9.89e-19 | -1.62e-01 | 0.1534 |
| 5885 | RAD21 | GSM4909312 | Human | Breast | IDC | 6.22e-06 | 3.07e-02 | 0.1552 |
| 5885 | RAD21 | GSM4909315 | Human | Breast | IDC | 4.45e-25 | 6.70e-01 | 0.21 |
| 5885 | RAD21 | GSM4909316 | Human | Breast | IDC | 4.29e-06 | 3.92e-01 | 0.21 |
| 5885 | RAD21 | GSM4909317 | Human | Breast | IDC | 1.82e-10 | 4.66e-01 | 0.1355 |
| 5885 | RAD21 | GSM4909318 | Human | Breast | IDC | 2.98e-03 | 5.37e-01 | 0.2031 |
| Page: 1 2 3 4 5 6 7 8 9 10 |
| Tissue | Expression Dynamics | Abbreviation |
| Breast |  | IDC: Invasive ductal carcinoma |
| DCIS: Ductal carcinoma in situ | ||
| Precancer(BRCA1-mut): Precancerous lesion from BRCA1 mutation carriers | ||
| Colorectum (GSE201348) |  | FAP: Familial adenomatous polyposis |
| CRC: Colorectal cancer | ||
| Colorectum (HTA11) |  | AD: Adenomas |
| SER: Sessile serrated lesions | ||
| MSI-H: Microsatellite-high colorectal cancer | ||
| MSS: Microsatellite stable colorectal cancer | ||
| Esophagus | 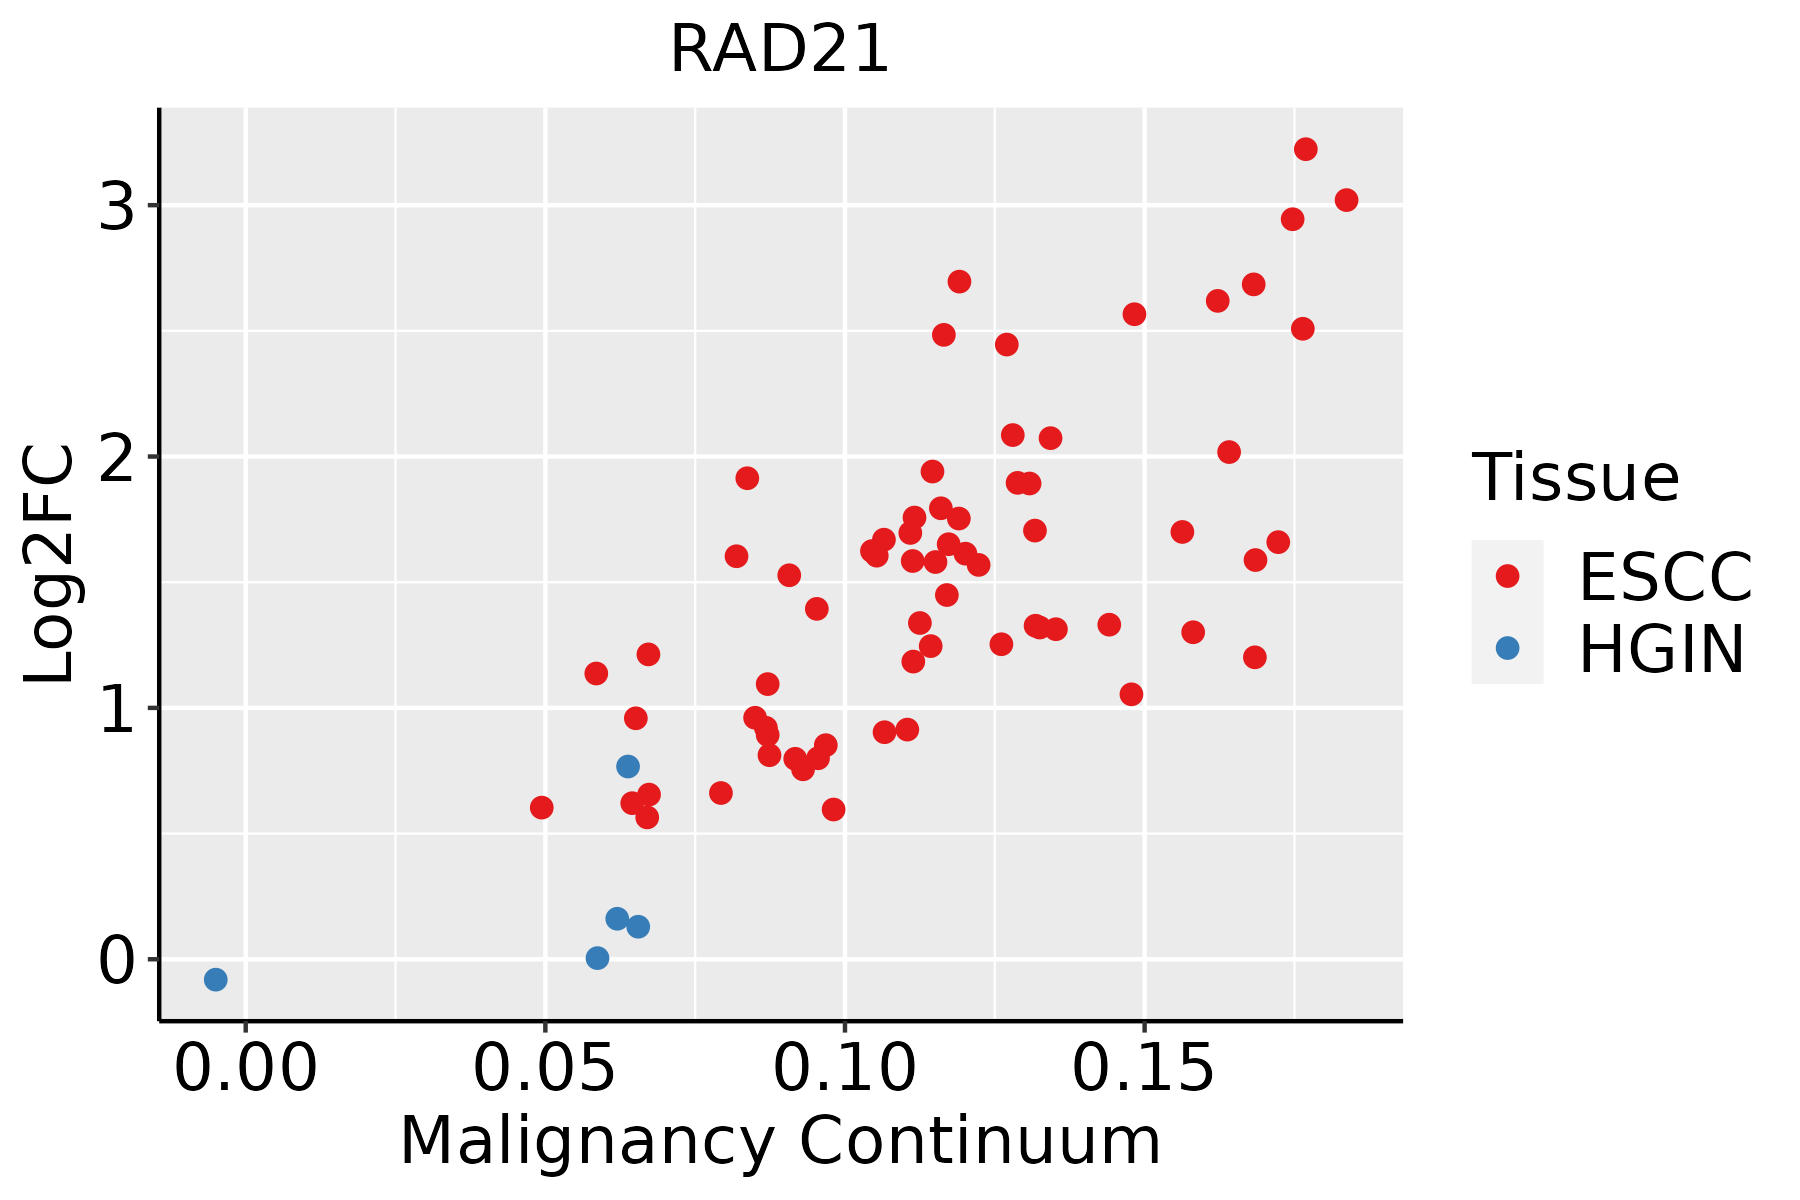 | ESCC: Esophageal squamous cell carcinoma |
| HGIN: High-grade intraepithelial neoplasias | ||
| LGIN: Low-grade intraepithelial neoplasias | ||
| Liver | 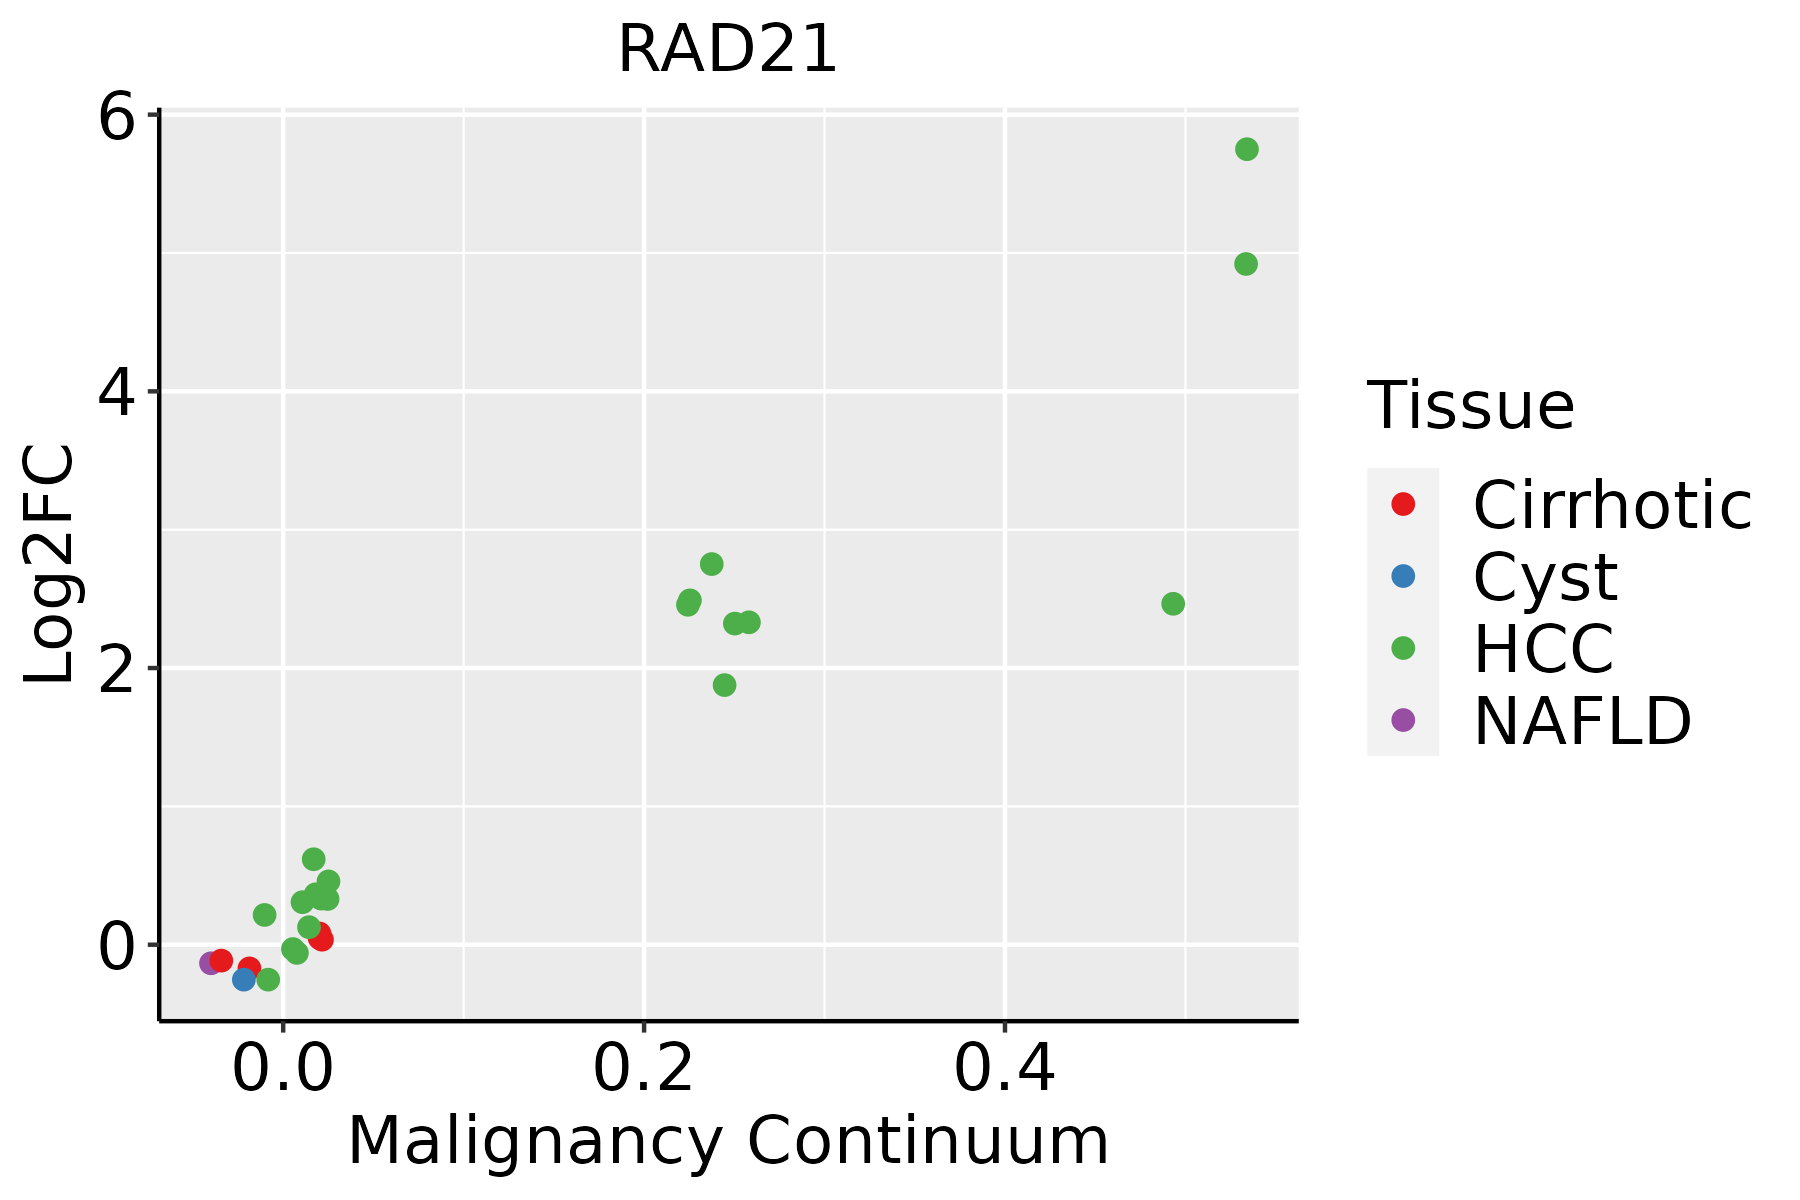 | HCC: Hepatocellular carcinoma |
| NAFLD: Non-alcoholic fatty liver disease | ||
| Oral Cavity |  | EOLP: Erosive Oral lichen planus |
| LP: leukoplakia | ||
| NEOLP: Non-erosive oral lichen planus | ||
| OSCC: Oral squamous cell carcinoma | ||
| Prostate | 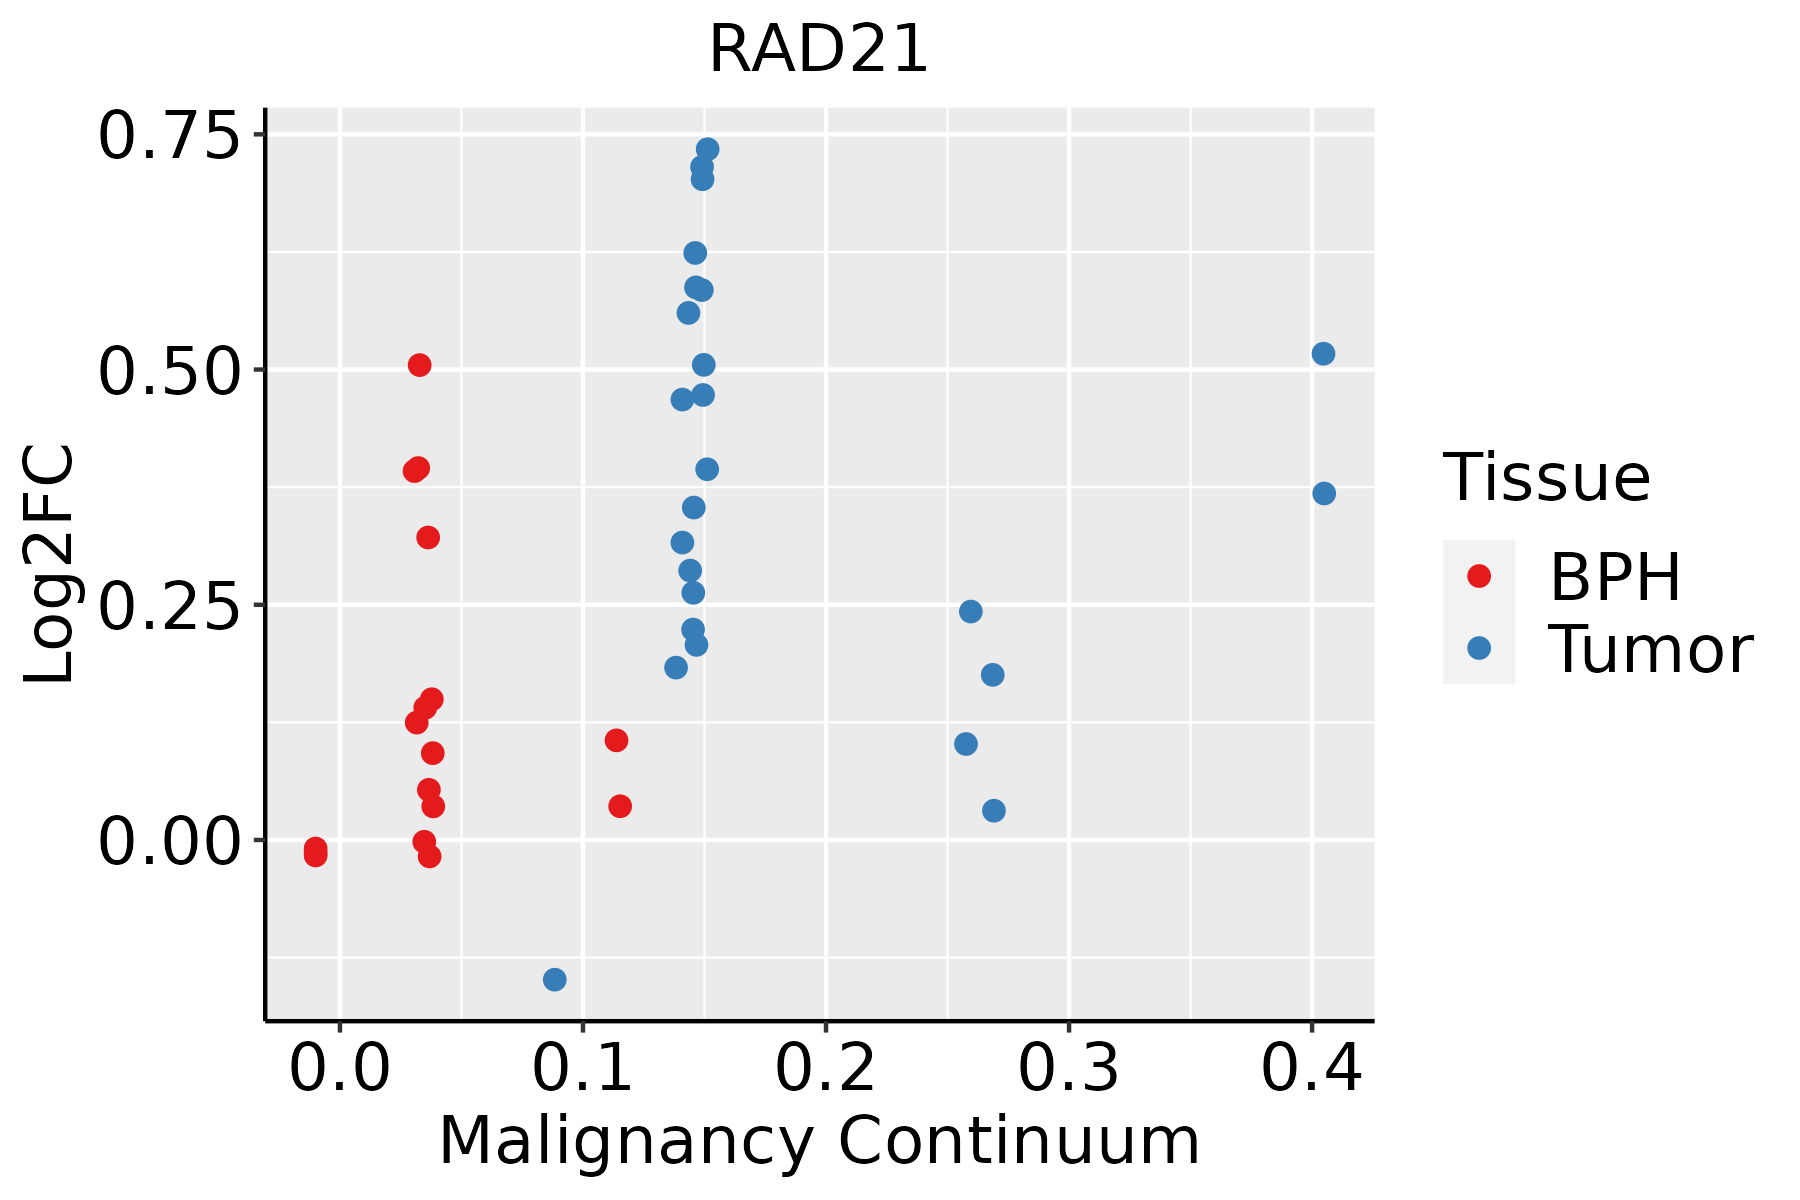 | BPH: Benign Prostatic Hyperplasia |
| Skin |  | AK: Actinic keratosis |
| cSCC: Cutaneous squamous cell carcinoma | ||
| SCCIS:squamous cell carcinoma in situ | ||
| Thyroid | 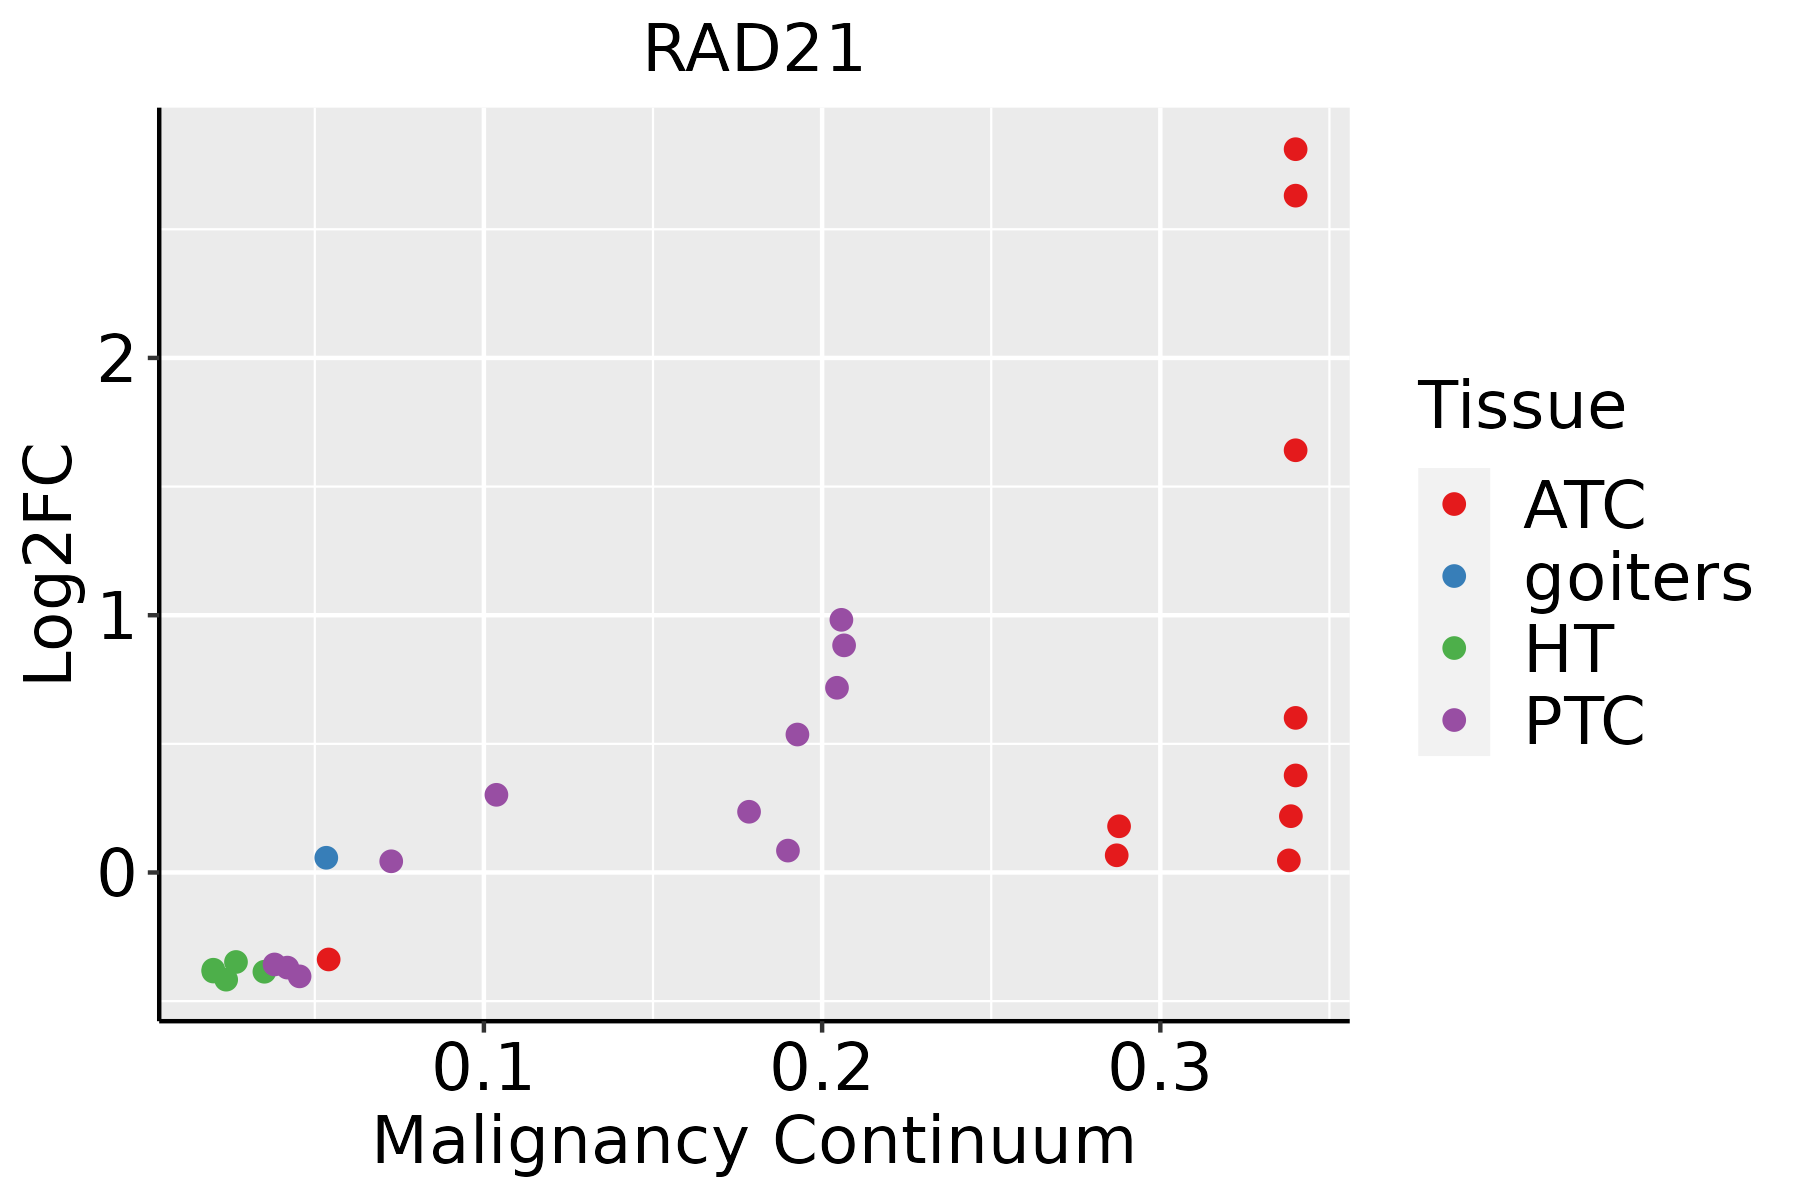 | ATC: Anaplastic thyroid cancer |
| HT: Hashimoto's thyroiditis | ||
| PTC: Papillary thyroid cancer |
| ∗log2FC in expression of this searched gene in stem-like cells from each diseased tissue sample relative to stem-like cells in normal samples in each tissue plotted against the malignancy continuum. Samples are colored based on if they are from different disease stage. |
Top |
Malignant transformation related pathway analysis |
| Find out the enriched GO biological processes and KEGG pathways involved in transition from healthy to precancer to cancer |
| Tissue | Disease Stage | Enriched GO biological Processes |
| Colorectum | AD |  |
| Colorectum | SER |  |
| Colorectum | MSS |  |
| Colorectum | MSI-H |  |
| Colorectum | FAP |  |
| ∗Top 15 enriched GO BP terms are showed in the bar plot of each disease state in each tissue. Each row represents a significant GO biological process which is colored according to the -log10(p.adjust). |
| Page: 1 2 3 4 5 6 7 8 9 |
| GO ID | Tissue | Disease Stage | Description | Gene Ratio | Bg Ratio | pvalue | p.adjust | Count |
| GO:200125212 | Breast | IDC | positive regulation of chromosome organization | 15/1434 | 82/18723 | 1.28e-03 | 1.35e-02 | 15 |
| GO:00330445 | Breast | IDC | regulation of chromosome organization | 26/1434 | 187/18723 | 2.22e-03 | 2.06e-02 | 26 |
| GO:00073465 | Breast | IDC | regulation of mitotic cell cycle | 51/1434 | 457/18723 | 4.30e-03 | 3.35e-02 | 51 |
| GO:200125221 | Breast | DCIS | positive regulation of chromosome organization | 15/1390 | 82/18723 | 9.37e-04 | 1.06e-02 | 15 |
| GO:000734612 | Breast | DCIS | regulation of mitotic cell cycle | 52/1390 | 457/18723 | 1.38e-03 | 1.43e-02 | 52 |
| GO:003304412 | Breast | DCIS | regulation of chromosome organization | 26/1390 | 187/18723 | 1.44e-03 | 1.47e-02 | 26 |
| GO:00447724 | Breast | DCIS | mitotic cell cycle phase transition | 46/1390 | 424/18723 | 6.16e-03 | 4.39e-02 | 46 |
| GO:0010639 | Colorectum | AD | negative regulation of organelle organization | 114/3918 | 348/18723 | 1.41e-07 | 6.49e-06 | 114 |
| GO:2001252 | Colorectum | AD | positive regulation of chromosome organization | 35/3918 | 82/18723 | 6.90e-06 | 1.72e-04 | 35 |
| GO:0033044 | Colorectum | AD | regulation of chromosome organization | 60/3918 | 187/18723 | 2.25e-04 | 2.94e-03 | 60 |
| GO:0007063 | Colorectum | AD | regulation of sister chromatid cohesion | 12/3918 | 21/18723 | 3.02e-04 | 3.62e-03 | 12 |
| GO:0007064 | Colorectum | AD | mitotic sister chromatid cohesion | 13/3918 | 28/18723 | 2.22e-03 | 1.75e-02 | 13 |
| GO:0007062 | Colorectum | AD | sister chromatid cohesion | 23/3918 | 62/18723 | 2.51e-03 | 1.92e-02 | 23 |
| GO:0007346 | Colorectum | AD | regulation of mitotic cell cycle | 119/3918 | 457/18723 | 4.60e-03 | 3.14e-02 | 119 |
| GO:0045787 | Colorectum | AD | positive regulation of cell cycle | 85/3918 | 313/18723 | 4.76e-03 | 3.22e-02 | 85 |
| GO:0140014 | Colorectum | AD | mitotic nuclear division | 78/3918 | 287/18723 | 6.48e-03 | 4.05e-02 | 78 |
| GO:00106392 | Colorectum | MSS | negative regulation of organelle organization | 102/3467 | 348/18723 | 5.36e-07 | 2.05e-05 | 102 |
| GO:20012522 | Colorectum | MSS | positive regulation of chromosome organization | 33/3467 | 82/18723 | 3.72e-06 | 1.07e-04 | 33 |
| GO:00330441 | Colorectum | MSS | regulation of chromosome organization | 55/3467 | 187/18723 | 1.86e-04 | 2.63e-03 | 55 |
| GO:00070631 | Colorectum | MSS | regulation of sister chromatid cohesion | 11/3467 | 21/18723 | 4.85e-04 | 5.65e-03 | 11 |
| Page: 1 2 3 4 5 6 7 8 9 10 11 12 13 14 15 16 17 18 19 20 21 22 |
| Pathway ID | Tissue | Disease Stage | Description | Gene Ratio | Bg Ratio | pvalue | p.adjust | qvalue | Count |
| hsa04110 | Colorectum | FAP | Cell cycle | 37/1404 | 157/8465 | 1.44e-02 | 4.77e-02 | 2.90e-02 | 37 |
| hsa041101 | Colorectum | FAP | Cell cycle | 37/1404 | 157/8465 | 1.44e-02 | 4.77e-02 | 2.90e-02 | 37 |
| hsa0411023 | Esophagus | ESCC | Cell cycle | 126/4205 | 157/8465 | 1.34e-15 | 5.60e-14 | 2.87e-14 | 126 |
| hsa0411033 | Esophagus | ESCC | Cell cycle | 126/4205 | 157/8465 | 1.34e-15 | 5.60e-14 | 2.87e-14 | 126 |
| hsa041104 | Liver | Cirrhotic | Cell cycle | 61/2530 | 157/8465 | 9.53e-03 | 3.21e-02 | 1.98e-02 | 61 |
| hsa0411011 | Liver | Cirrhotic | Cell cycle | 61/2530 | 157/8465 | 9.53e-03 | 3.21e-02 | 1.98e-02 | 61 |
| hsa041102 | Liver | HCC | Cell cycle | 106/4020 | 157/8465 | 2.54e-07 | 3.04e-06 | 1.69e-06 | 106 |
| hsa041103 | Liver | HCC | Cell cycle | 106/4020 | 157/8465 | 2.54e-07 | 3.04e-06 | 1.69e-06 | 106 |
| hsa041108 | Oral cavity | OSCC | Cell cycle | 118/3704 | 157/8465 | 7.15e-16 | 2.66e-14 | 1.35e-14 | 118 |
| hsa0411015 | Oral cavity | OSCC | Cell cycle | 118/3704 | 157/8465 | 7.15e-16 | 2.66e-14 | 1.35e-14 | 118 |
| hsa0411022 | Oral cavity | LP | Cell cycle | 70/2418 | 157/8465 | 1.17e-05 | 8.27e-05 | 5.33e-05 | 70 |
| hsa0411032 | Oral cavity | LP | Cell cycle | 70/2418 | 157/8465 | 1.17e-05 | 8.27e-05 | 5.33e-05 | 70 |
| hsa0411041 | Oral cavity | EOLP | Cell cycle | 42/1218 | 157/8465 | 3.20e-05 | 1.61e-04 | 9.52e-05 | 42 |
| hsa0411051 | Oral cavity | EOLP | Cell cycle | 42/1218 | 157/8465 | 3.20e-05 | 1.61e-04 | 9.52e-05 | 42 |
| hsa041107 | Prostate | BPH | Cell cycle | 49/1718 | 157/8465 | 7.39e-04 | 3.59e-03 | 2.22e-03 | 49 |
| hsa0411014 | Prostate | BPH | Cell cycle | 49/1718 | 157/8465 | 7.39e-04 | 3.59e-03 | 2.22e-03 | 49 |
| hsa0411021 | Prostate | Tumor | Cell cycle | 51/1791 | 157/8465 | 5.67e-04 | 2.89e-03 | 1.79e-03 | 51 |
| hsa0411031 | Prostate | Tumor | Cell cycle | 51/1791 | 157/8465 | 5.67e-04 | 2.89e-03 | 1.79e-03 | 51 |
| Page: 1 |
Top |
Cell-cell communication analysis |
| Identification of potential cell-cell interactions between two cell types and their ligand-receptor pairs for different disease states |
| Ligand | Receptor | LRpair | Pathway | Tissue | Disease Stage |
| Page: 1 |
Top |
Single-cell gene regulatory network inference analysis |
| Find out the significant the regulons (TFs) and the target genes of each regulon across cell types for different disease states |
| TF | Cell Type | Tissue | Disease Stage | Target Gene | RSS | Regulon Activity |
| RAD21 | MES | Cervix | ADJ | CENPF,TOP2A,CCNB1, etc. | 6.27e-01 |  |
| RAD21 | BAS | Oral cavity | Healthy | PTTG1,CCNB1,FAM98B, etc. | 1.96e-01 |  |
| ∗The dot plots of a searched regulon are shown for all cell subpopulations in each disease state of each tissue based on the regulon specific score inferred using pySCENIC and by calculating the average expression. |
| Page: 1 |
Top |
Somatic mutation of malignant transformation related genes |
| Annotation of somatic variants for genes involved in malignant transformation |
| Hugo Symbol | Variant Class | Variant Classification | dbSNP RS | HGVSc | HGVSp | HGVSp Short | SWISSPROT | BIOTYPE | SIFT | PolyPhen | Tumor Sample Barcode | Tissue | Histology | Sex | Age | Stage | Therapy Types | Drugs | Outcome |
| RAD21 | SNV | Missense_Mutation | c.1522G>C | p.Glu508Gln | p.E508Q | O60216 | protein_coding | tolerated(0.18) | probably_damaging(0.932) | TCGA-A2-A0EW-01 | Breast | breast invasive carcinoma | Female | <65 | III/IV | Chemotherapy | adriamycin | PD | |
| RAD21 | SNV | Missense_Mutation | novel | c.1627N>T | p.Asp543Tyr | p.D543Y | O60216 | protein_coding | tolerated(0.06) | possibly_damaging(0.67) | TCGA-A7-A6VV-01 | Breast | breast invasive carcinoma | Female | <65 | I/II | Chemotherapy | cyclophosphamide | CR |
| RAD21 | SNV | Missense_Mutation | c.121N>C | p.Val41Leu | p.V41L | O60216 | protein_coding | deleterious(0.01) | probably_damaging(0.996) | TCGA-A8-A08F-01 | Breast | breast invasive carcinoma | Female | <65 | III/IV | Chemotherapy | 5-fluorouracil | CR | |
| RAD21 | SNV | Missense_Mutation | c.268N>T | p.Arg90Trp | p.R90W | O60216 | protein_coding | deleterious(0) | benign(0.167) | TCGA-AN-A046-01 | Breast | breast invasive carcinoma | Female | >=65 | I/II | Unknown | Unknown | SD | |
| RAD21 | SNV | Missense_Mutation | c.1485N>T | p.Glu495Asp | p.E495D | O60216 | protein_coding | tolerated(0.4) | benign(0.005) | TCGA-C8-A134-01 | Breast | breast invasive carcinoma | Female | <65 | I/II | Chemotherapy | 5-fluorouracil | CR | |
| RAD21 | SNV | Missense_Mutation | c.1130N>G | p.Ala377Gly | p.A377G | O60216 | protein_coding | tolerated(0.25) | probably_damaging(0.978) | TCGA-D8-A1Y1-01 | Breast | breast invasive carcinoma | Female | >=65 | III/IV | Hormone Therapy | tamoxiphen | PD | |
| RAD21 | insertion | Nonsense_Mutation | novel | c.1641_1642insAGAAGAATAAATTCTAAGTCTTAAACAACAACCTCAAT | p.Asp548ArgfsTer8 | p.D548Rfs*8 | O60216 | protein_coding | TCGA-AR-A0U0-01 | Breast | breast invasive carcinoma | Female | >=65 | I/II | Unknown | Unknown | SD | ||
| RAD21 | SNV | Missense_Mutation | novel | c.185N>A | p.Gly62Glu | p.G62E | O60216 | protein_coding | deleterious(0) | probably_damaging(1) | TCGA-EA-A3Y4-01 | Cervix | cervical & endocervical cancer | Female | <65 | I/II | Unknown | Unknown | SD |
| RAD21 | SNV | Missense_Mutation | c.1450N>C | p.Asp484His | p.D484H | O60216 | protein_coding | deleterious(0.04) | benign(0.157) | TCGA-EK-A2RN-01 | Cervix | cervical & endocervical cancer | Female | <65 | I/II | Unknown | Unknown | SD | |
| RAD21 | SNV | Missense_Mutation | novel | c.426N>C | p.Glu142Asp | p.E142D | O60216 | protein_coding | tolerated(0.15) | probably_damaging(0.956) | TCGA-JW-AAVH-01 | Cervix | cervical & endocervical cancer | Female | <65 | I/II | Unknown | Unknown | SD |
| Page: 1 2 3 4 5 6 7 8 9 |
Top |
Related drugs of malignant transformation related genes |
| Identification of chemicals and drugs interact with genes involved in malignant transfromation |
| (DGIdb 4.0) |
| Entrez ID | Symbol | Category | Interaction Types | Drug Claim Name | Drug Name | PMIDs |
| 5885 | RAD21 | CLINICALLY ACTIONABLE | N/A | 15767545 |
| Page: 1 |

Copyright 2023-Present -The University of Texas Health Science Center at Houston |