
|
|||||
|
 | |
| |
| |
| |
| |
| |
|
Gene: RAD1 |
Gene summary for RAD1 |
| Gene information | Species | Human | Gene symbol | RAD1 | Gene ID | 5810 |
| Gene name | RAD1 checkpoint DNA exonuclease | |
| Gene Alias | HRAD1 | |
| Cytomap | 5p13.2 | |
| Gene Type | protein-coding | GO ID | GO:0000003 | UniProtAcc | A0A024R045 |
Top |
Malignant transformation analysis |
| Identification of the aberrant gene expression in precancerous and cancerous lesions by comparing the gene expression of stem-like cells in diseased tissues with normal stem cells |
| Entrez ID | Symbol | Replicates | Species | Organ | Tissue | Adj P-value | Log2FC | Malignancy |
| 5810 | RAD1 | LZE2T | Human | Esophagus | ESCC | 3.65e-02 | 4.39e-01 | 0.082 |
| 5810 | RAD1 | LZE4T | Human | Esophagus | ESCC | 1.25e-03 | 1.48e-01 | 0.0811 |
| 5810 | RAD1 | LZE7T | Human | Esophagus | ESCC | 2.54e-05 | 2.77e-01 | 0.0667 |
| 5810 | RAD1 | LZE8T | Human | Esophagus | ESCC | 3.67e-09 | 2.83e-01 | 0.067 |
| 5810 | RAD1 | LZE20T | Human | Esophagus | ESCC | 8.22e-14 | 4.37e-01 | 0.0662 |
| 5810 | RAD1 | LZE22T | Human | Esophagus | ESCC | 7.69e-03 | 2.13e-01 | 0.068 |
| 5810 | RAD1 | LZE24T | Human | Esophagus | ESCC | 9.78e-10 | 2.38e-01 | 0.0596 |
| 5810 | RAD1 | LZE6T | Human | Esophagus | ESCC | 4.50e-28 | 1.30e+00 | 0.0845 |
| 5810 | RAD1 | P1T-E | Human | Esophagus | ESCC | 4.85e-03 | 1.73e-01 | 0.0875 |
| 5810 | RAD1 | P2T-E | Human | Esophagus | ESCC | 6.80e-19 | 3.85e-01 | 0.1177 |
| 5810 | RAD1 | P4T-E | Human | Esophagus | ESCC | 6.37e-24 | 4.97e-01 | 0.1323 |
| 5810 | RAD1 | P5T-E | Human | Esophagus | ESCC | 2.24e-14 | 3.70e-01 | 0.1327 |
| 5810 | RAD1 | P8T-E | Human | Esophagus | ESCC | 4.47e-14 | 3.17e-01 | 0.0889 |
| 5810 | RAD1 | P9T-E | Human | Esophagus | ESCC | 8.40e-15 | 2.04e-01 | 0.1131 |
| 5810 | RAD1 | P10T-E | Human | Esophagus | ESCC | 8.31e-34 | 6.08e-01 | 0.116 |
| 5810 | RAD1 | P11T-E | Human | Esophagus | ESCC | 4.05e-12 | 3.18e-01 | 0.1426 |
| 5810 | RAD1 | P12T-E | Human | Esophagus | ESCC | 6.05e-22 | 4.62e-01 | 0.1122 |
| 5810 | RAD1 | P15T-E | Human | Esophagus | ESCC | 1.54e-17 | 3.95e-01 | 0.1149 |
| 5810 | RAD1 | P16T-E | Human | Esophagus | ESCC | 4.99e-15 | 3.55e-01 | 0.1153 |
| 5810 | RAD1 | P17T-E | Human | Esophagus | ESCC | 6.86e-10 | 4.87e-01 | 0.1278 |
| Page: 1 2 3 4 5 6 |
| Tissue | Expression Dynamics | Abbreviation |
| Esophagus |  | ESCC: Esophageal squamous cell carcinoma |
| HGIN: High-grade intraepithelial neoplasias | ||
| LGIN: Low-grade intraepithelial neoplasias | ||
| Liver |  | HCC: Hepatocellular carcinoma |
| NAFLD: Non-alcoholic fatty liver disease | ||
| Oral Cavity | 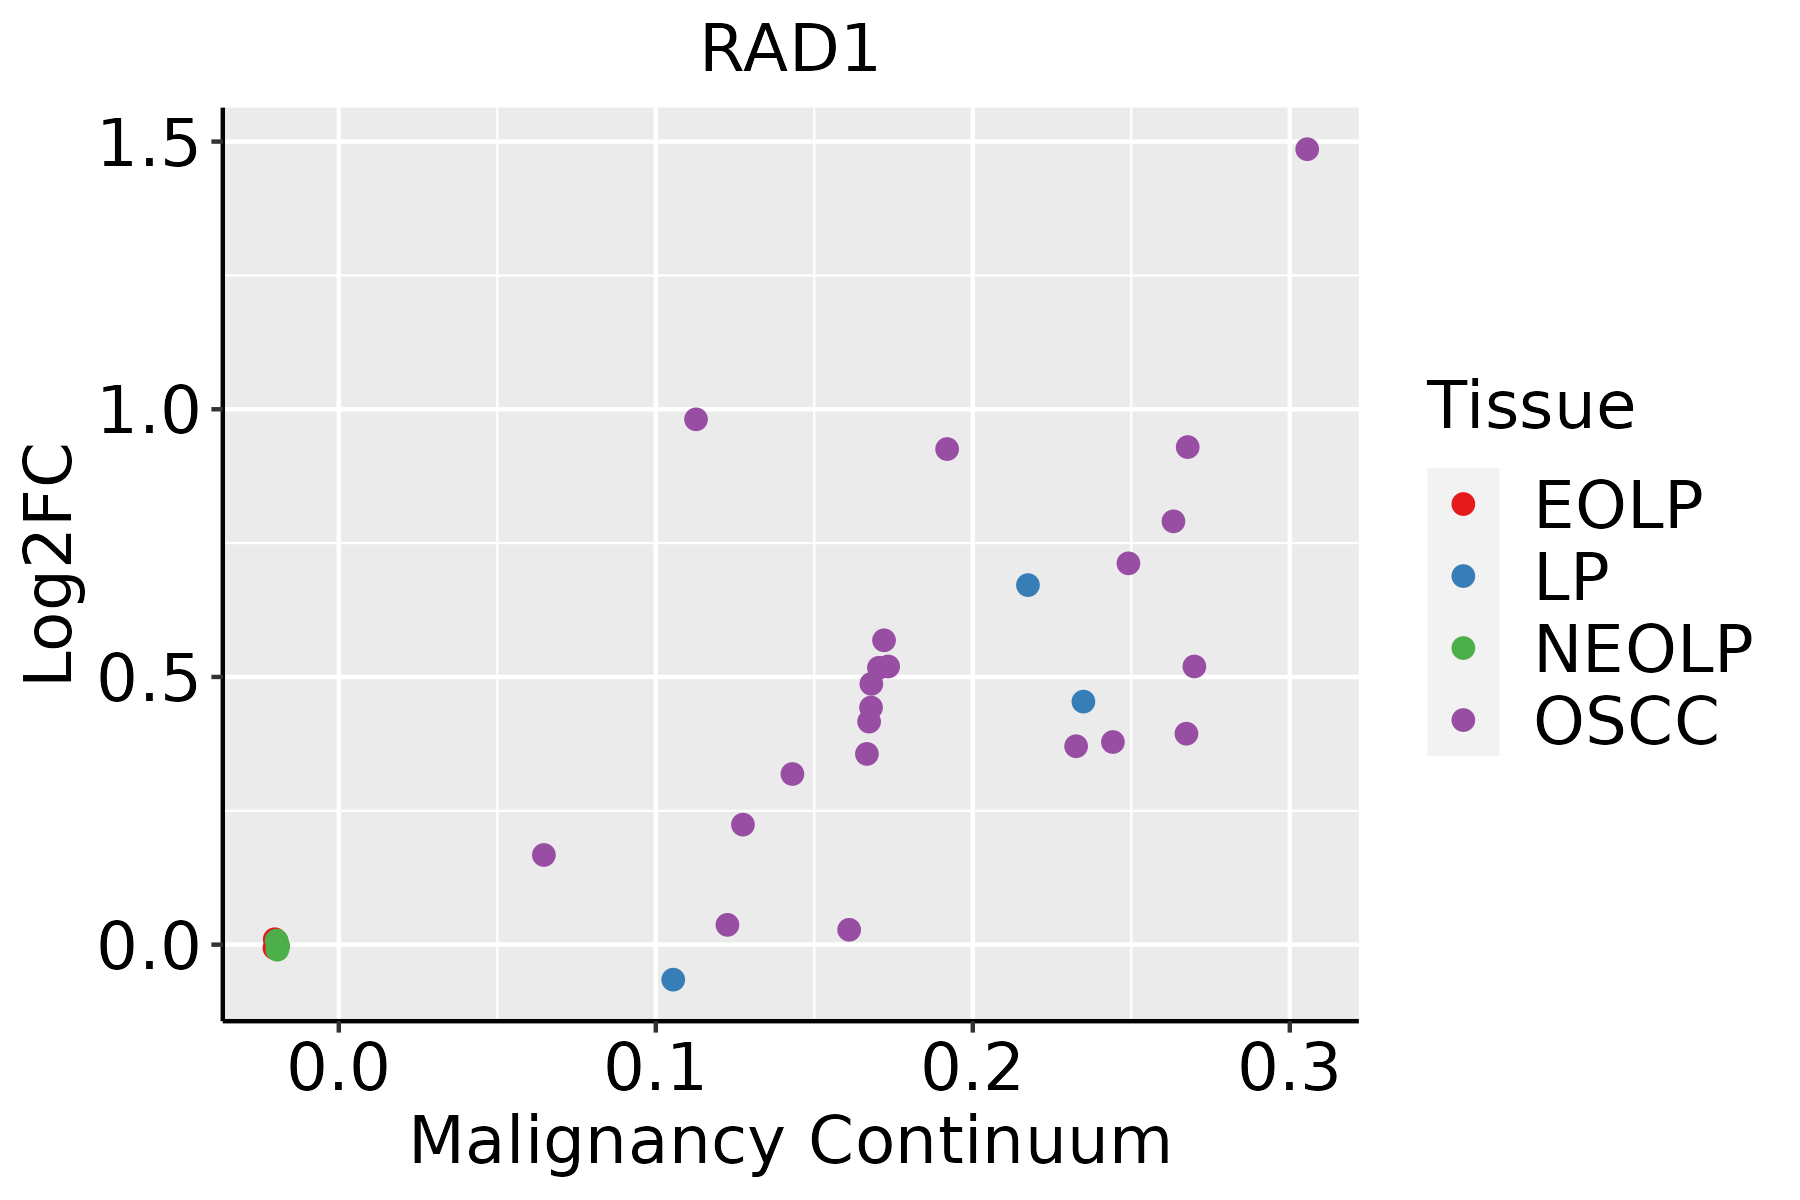 | EOLP: Erosive Oral lichen planus |
| LP: leukoplakia | ||
| NEOLP: Non-erosive oral lichen planus | ||
| OSCC: Oral squamous cell carcinoma | ||
| Skin | 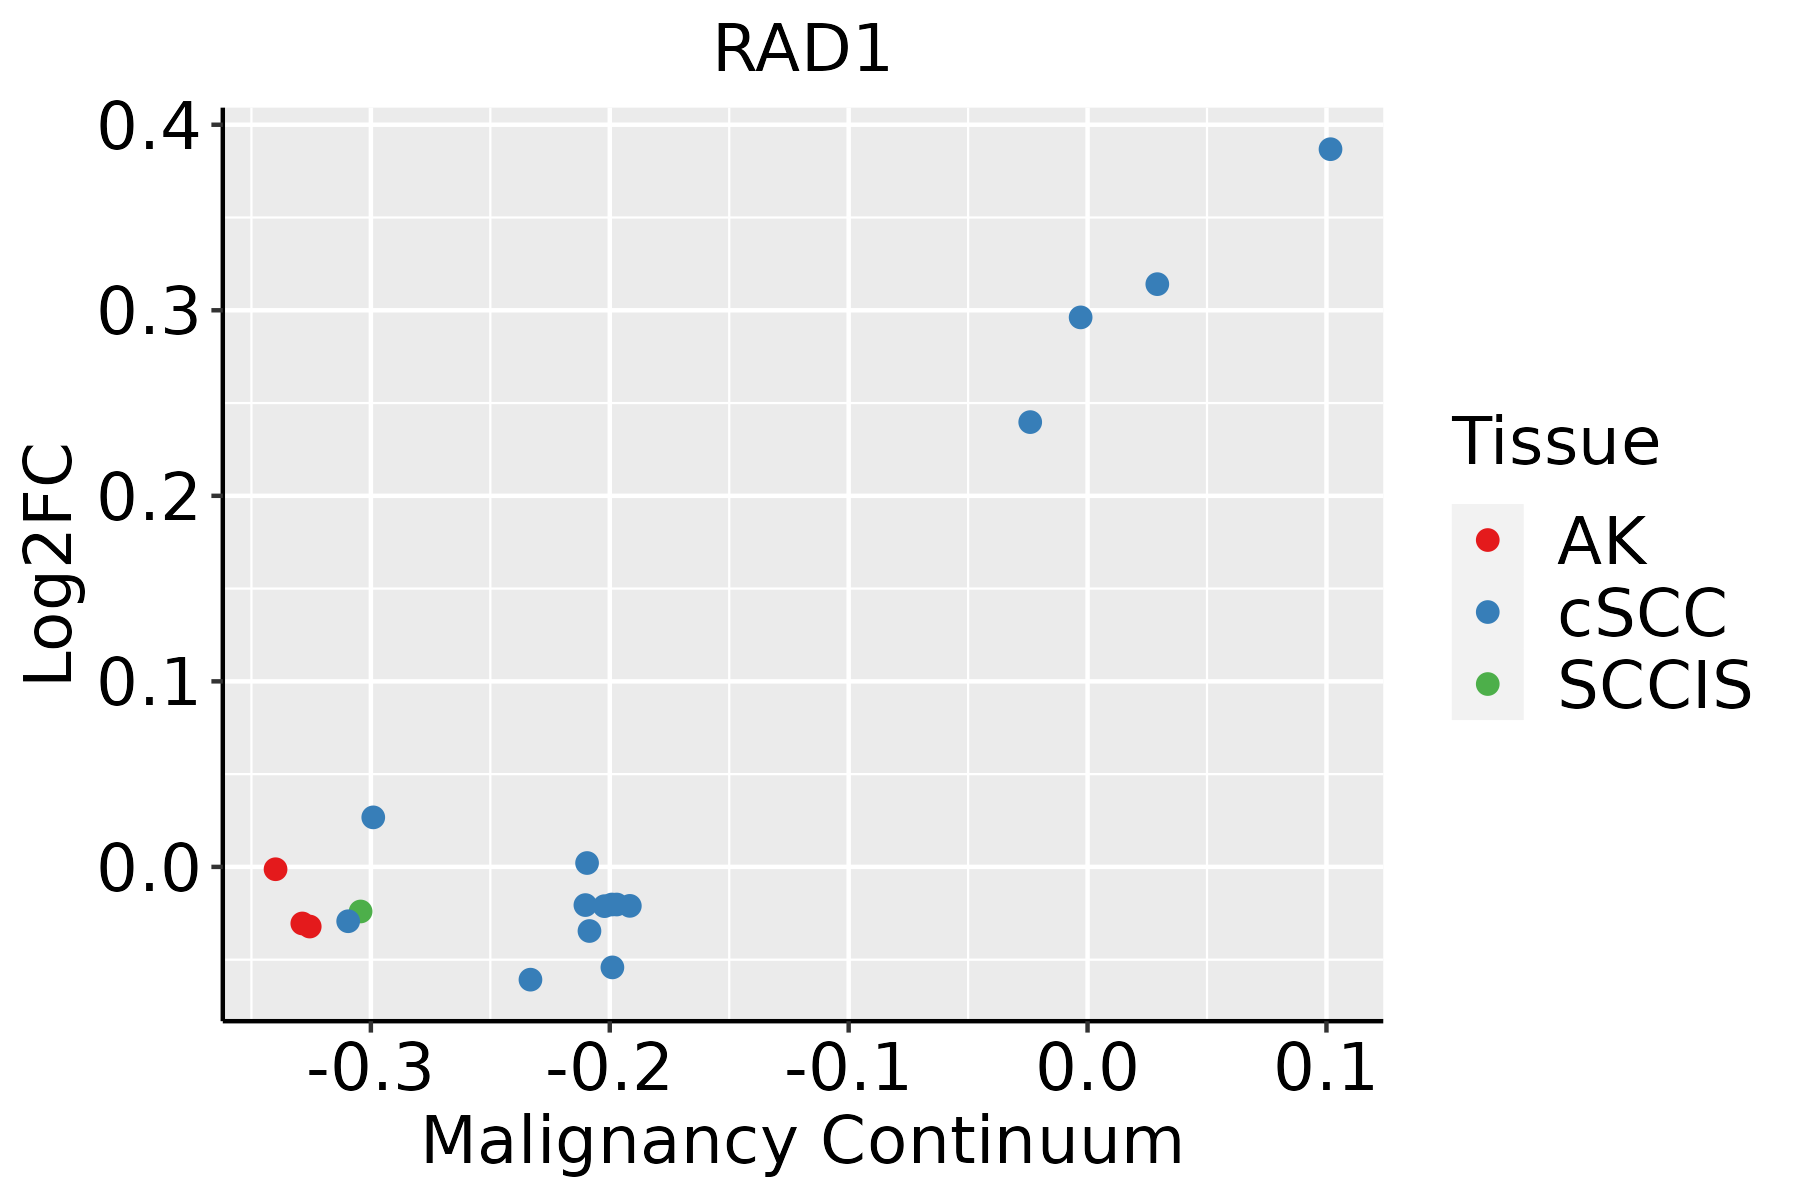 | AK: Actinic keratosis |
| cSCC: Cutaneous squamous cell carcinoma | ||
| SCCIS:squamous cell carcinoma in situ | ||
| Thyroid | 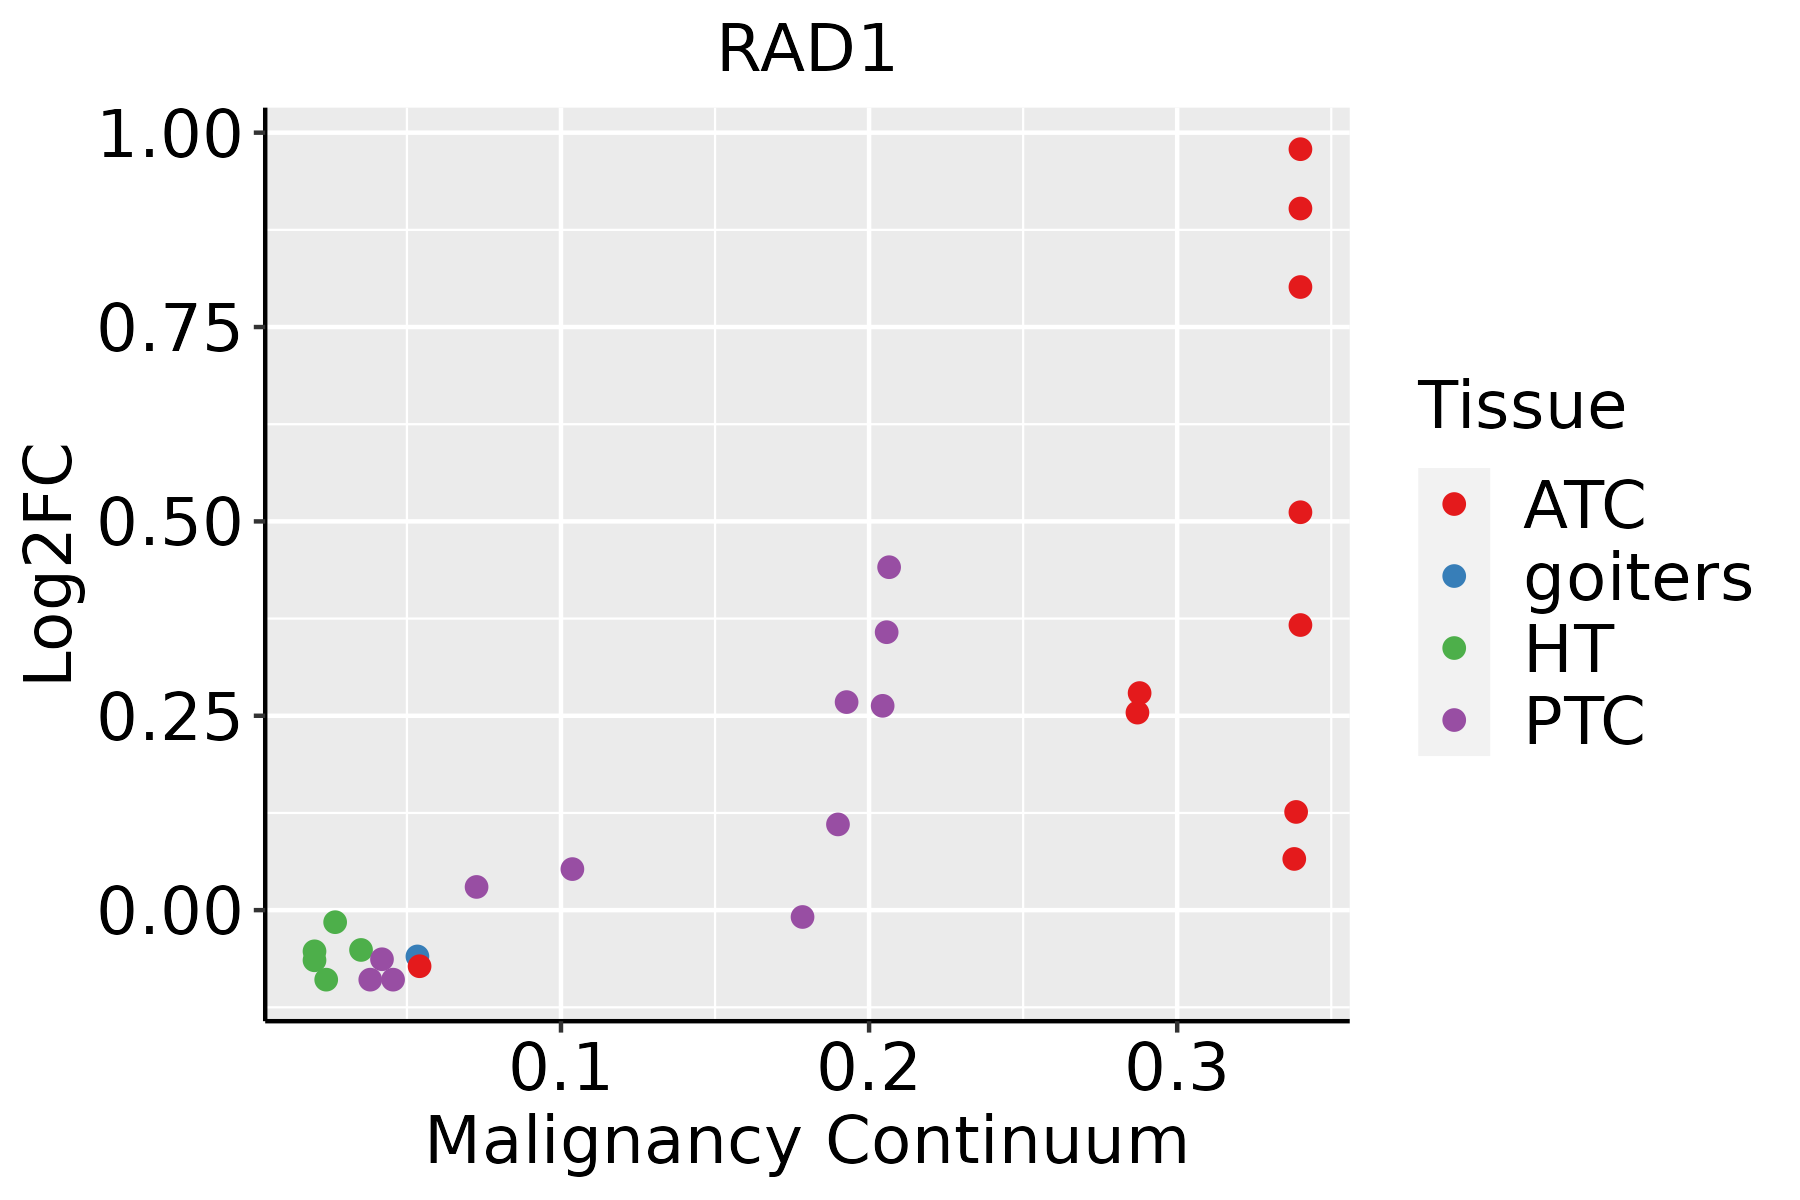 | ATC: Anaplastic thyroid cancer |
| HT: Hashimoto's thyroiditis | ||
| PTC: Papillary thyroid cancer |
| ∗log2FC in expression of this searched gene in stem-like cells from each diseased tissue sample relative to stem-like cells in normal samples in each tissue plotted against the malignancy continuum. Samples are colored based on if they are from different disease stage. |
Top |
Malignant transformation related pathway analysis |
| Find out the enriched GO biological processes and KEGG pathways involved in transition from healthy to precancer to cancer |
| Tissue | Disease Stage | Enriched GO biological Processes |
| Colorectum | AD |  |
| Colorectum | SER |  |
| Colorectum | MSS |  |
| Colorectum | MSI-H |  |
| Colorectum | FAP |  |
| ∗Top 15 enriched GO BP terms are showed in the bar plot of each disease state in each tissue. Each row represents a significant GO biological process which is colored according to the -log10(p.adjust). |
| Page: 1 2 3 4 5 6 7 8 9 |
| GO ID | Tissue | Disease Stage | Description | Gene Ratio | Bg Ratio | pvalue | p.adjust | Count |
| GO:00518656 | Cervix | CC | protein autoubiquitination | 17/2311 | 73/18723 | 6.71e-03 | 3.70e-02 | 17 |
| GO:004477216 | Esophagus | ESCC | mitotic cell cycle phase transition | 281/8552 | 424/18723 | 4.63e-18 | 4.45e-16 | 281 |
| GO:000734615 | Esophagus | ESCC | regulation of mitotic cell cycle | 293/8552 | 457/18723 | 8.00e-16 | 5.64e-14 | 293 |
| GO:00062604 | Esophagus | ESCC | DNA replication | 181/8552 | 260/18723 | 3.55e-15 | 2.05e-13 | 181 |
| GO:00482853 | Esophagus | ESCC | organelle fission | 301/8552 | 488/18723 | 4.64e-13 | 2.12e-11 | 301 |
| GO:001021217 | Esophagus | ESCC | response to ionizing radiation | 110/8552 | 148/18723 | 1.11e-12 | 4.78e-11 | 110 |
| GO:00002802 | Esophagus | ESCC | nuclear division | 270/8552 | 439/18723 | 1.17e-11 | 4.24e-10 | 270 |
| GO:190198713 | Esophagus | ESCC | regulation of cell cycle phase transition | 242/8552 | 390/18723 | 3.86e-11 | 1.26e-09 | 242 |
| GO:000931419 | Esophagus | ESCC | response to radiation | 277/8552 | 456/18723 | 4.42e-11 | 1.43e-09 | 277 |
| GO:190199013 | Esophagus | ESCC | regulation of mitotic cell cycle phase transition | 191/8552 | 299/18723 | 1.35e-10 | 3.94e-09 | 191 |
| GO:00457865 | Esophagus | ESCC | negative regulation of cell cycle | 236/8552 | 385/18723 | 3.62e-10 | 9.93e-09 | 236 |
| GO:00000754 | Esophagus | ESCC | cell cycle checkpoint | 117/8552 | 169/18723 | 4.47e-10 | 1.17e-08 | 117 |
| GO:007121419 | Esophagus | ESCC | cellular response to abiotic stimulus | 206/8552 | 331/18723 | 7.52e-10 | 1.88e-08 | 206 |
| GO:010400419 | Esophagus | ESCC | cellular response to environmental stimulus | 206/8552 | 331/18723 | 7.52e-10 | 1.88e-08 | 206 |
| GO:0010639110 | Esophagus | ESCC | negative regulation of organelle organization | 215/8552 | 348/18723 | 8.20e-10 | 2.01e-08 | 215 |
| GO:004277014 | Esophagus | ESCC | signal transduction in response to DNA damage | 117/8552 | 172/18723 | 2.38e-09 | 5.32e-08 | 117 |
| GO:00448394 | Esophagus | ESCC | cell cycle G2/M phase transition | 103/8552 | 148/18723 | 3.09e-09 | 6.67e-08 | 103 |
| GO:00000864 | Esophagus | ESCC | G2/M transition of mitotic cell cycle | 96/8552 | 137/18723 | 6.00e-09 | 1.23e-07 | 96 |
| GO:00070934 | Esophagus | ESCC | mitotic cell cycle checkpoint | 90/8552 | 129/18723 | 2.49e-08 | 4.69e-07 | 90 |
| GO:00903053 | Esophagus | ESCC | nucleic acid phosphodiester bond hydrolysis | 163/8552 | 261/18723 | 3.07e-08 | 5.73e-07 | 163 |
| Page: 1 2 3 4 5 6 7 8 9 |
| Pathway ID | Tissue | Disease Stage | Description | Gene Ratio | Bg Ratio | pvalue | p.adjust | qvalue | Count |
| hsa0421829 | Esophagus | ESCC | Cellular senescence | 119/4205 | 156/8465 | 5.89e-12 | 9.40e-11 | 4.81e-11 | 119 |
| hsa0421838 | Esophagus | ESCC | Cellular senescence | 119/4205 | 156/8465 | 5.89e-12 | 9.40e-11 | 4.81e-11 | 119 |
| hsa042187 | Liver | Cirrhotic | Cellular senescence | 66/2530 | 156/8465 | 5.94e-04 | 3.60e-03 | 2.22e-03 | 66 |
| hsa0421812 | Liver | Cirrhotic | Cellular senescence | 66/2530 | 156/8465 | 5.94e-04 | 3.60e-03 | 2.22e-03 | 66 |
| hsa0421822 | Liver | HCC | Cellular senescence | 102/4020 | 156/8465 | 4.18e-06 | 3.59e-05 | 2.00e-05 | 102 |
| hsa0421832 | Liver | HCC | Cellular senescence | 102/4020 | 156/8465 | 4.18e-06 | 3.59e-05 | 2.00e-05 | 102 |
| hsa0421820 | Oral cavity | OSCC | Cellular senescence | 112/3704 | 156/8465 | 8.04e-13 | 1.42e-11 | 7.21e-12 | 112 |
| hsa04218110 | Oral cavity | OSCC | Cellular senescence | 112/3704 | 156/8465 | 8.04e-13 | 1.42e-11 | 7.21e-12 | 112 |
| hsa0421827 | Oral cavity | LP | Cellular senescence | 71/2418 | 156/8465 | 4.17e-06 | 3.75e-05 | 2.42e-05 | 71 |
| hsa0421837 | Oral cavity | LP | Cellular senescence | 71/2418 | 156/8465 | 4.17e-06 | 3.75e-05 | 2.42e-05 | 71 |
| Page: 1 |
Top |
Cell-cell communication analysis |
| Identification of potential cell-cell interactions between two cell types and their ligand-receptor pairs for different disease states |
| Ligand | Receptor | LRpair | Pathway | Tissue | Disease Stage |
| Page: 1 |
Top |
Single-cell gene regulatory network inference analysis |
| Find out the significant the regulons (TFs) and the target genes of each regulon across cell types for different disease states |
| TF | Cell Type | Tissue | Disease Stage | Target Gene | RSS | Regulon Activity |
| ∗The dot plots of a searched regulon are shown for all cell subpopulations in each disease state of each tissue based on the regulon specific score inferred using pySCENIC and by calculating the average expression. |
| Page: 1 |
Top |
Somatic mutation of malignant transformation related genes |
| Annotation of somatic variants for genes involved in malignant transformation |
| Hugo Symbol | Variant Class | Variant Classification | dbSNP RS | HGVSc | HGVSp | HGVSp Short | SWISSPROT | BIOTYPE | SIFT | PolyPhen | Tumor Sample Barcode | Tissue | Histology | Sex | Age | Stage | Therapy Types | Drugs | Outcome |
| RAD1 | SNV | Missense_Mutation | c.623N>G | p.Asp208Gly | p.D208G | O60671 | protein_coding | deleterious(0.03) | probably_damaging(0.956) | TCGA-D8-A1XF-01 | Breast | breast invasive carcinoma | Female | <65 | I/II | Chemotherapy | adriamycin+cyclophosphamide | SD | |
| RAD1 | insertion | Frame_Shift_Ins | novel | c.569_570insGGAGTACAGTTGTAGGATTACAGTTCACTCCAGCCTCAATCTCCTA | p.Ser191GlufsTer27 | p.S191Efs*27 | O60671 | protein_coding | TCGA-BH-A0B1-01 | Breast | breast invasive carcinoma | Female | >=65 | I/II | Chemotherapy | adriamycin | SD | ||
| RAD1 | insertion | Frame_Shift_Ins | novel | c.840_841insT | p.Glu281Ter | p.E281* | O60671 | protein_coding | TCGA-BH-A18F-01 | Breast | breast invasive carcinoma | Female | <65 | I/II | Chemotherapy | taxotere | CR | ||
| RAD1 | SNV | Missense_Mutation | c.826N>C | p.Glu276Gln | p.E276Q | O60671 | protein_coding | deleterious(0.02) | benign(0.165) | TCGA-DS-A1OC-01 | Cervix | cervical & endocervical cancer | Female | <65 | I/II | Chemotherapy | gemcitabine | SD | |
| RAD1 | insertion | Nonsense_Mutation | novel | c.109_110insTATGAGT | p.Arg37LeufsTer2 | p.R37Lfs*2 | O60671 | protein_coding | TCGA-DS-A1OD-01 | Cervix | cervical & endocervical cancer | Female | <65 | I/II | Chemotherapy | cisplatin | SD | ||
| RAD1 | SNV | Missense_Mutation | novel | c.190N>C | p.Phe64Leu | p.F64L | O60671 | protein_coding | deleterious(0.02) | probably_damaging(0.917) | TCGA-AA-3877-01 | Colorectum | colon adenocarcinoma | Female | >=65 | I/II | Unknown | Unknown | SD |
| RAD1 | SNV | Missense_Mutation | rs150523066 | c.248N>A | p.Arg83Gln | p.R83Q | O60671 | protein_coding | tolerated(0.38) | benign(0.039) | TCGA-EI-6917-01 | Colorectum | rectum adenocarcinoma | Male | <65 | III/IV | Chemotherapy | 5fluorouracil+oxaciplatina+l-folinian | SD |
| RAD1 | insertion | Frame_Shift_Ins | novel | c.288_289insT | p.Gly97TrpfsTer44 | p.G97Wfs*44 | O60671 | protein_coding | TCGA-AA-3947-01 | Colorectum | colon adenocarcinoma | Female | <65 | I/II | Unknown | Unknown | SD | ||
| RAD1 | SNV | Missense_Mutation | novel | c.472C>A | p.Leu158Met | p.L158M | O60671 | protein_coding | tolerated(0.34) | benign(0.434) | TCGA-A5-A1OF-01 | Endometrium | uterine corpus endometrioid carcinoma | Female | <65 | I/II | Unknown | Unknown | SD |
| RAD1 | SNV | Missense_Mutation | novel | c.640N>A | p.His214Asn | p.H214N | O60671 | protein_coding | deleterious(0.04) | benign(0.001) | TCGA-A5-A2K5-01 | Endometrium | uterine corpus endometrioid carcinoma | Female | >=65 | I/II | Unknown | Unknown | SD |
| Page: 1 2 3 4 |
Top |
Related drugs of malignant transformation related genes |
| Identification of chemicals and drugs interact with genes involved in malignant transfromation |
| (DGIdb 4.0) |
| Entrez ID | Symbol | Category | Interaction Types | Drug Claim Name | Drug Name | PMIDs |
| Page: 1 |

Copyright 2023-Present -The University of Texas Health Science Center at Houston |