
|
|||||
|
 | |
| |
| |
| |
| |
| |
|
Gene: RACGAP1 |
Gene summary for RACGAP1 |
| Gene information | Species | Human | Gene symbol | RACGAP1 | Gene ID | 29127 |
| Gene name | Rac GTPase activating protein 1 | |
| Gene Alias | CYK4 | |
| Cytomap | 12q13.12 | |
| Gene Type | protein-coding | GO ID | GO:0000003 | UniProtAcc | A0A024R136 |
Top |
Malignant transformation analysis |
| Identification of the aberrant gene expression in precancerous and cancerous lesions by comparing the gene expression of stem-like cells in diseased tissues with normal stem cells |
| Entrez ID | Symbol | Replicates | Species | Organ | Tissue | Adj P-value | Log2FC | Malignancy |
| 29127 | RACGAP1 | LZE2T | Human | Esophagus | ESCC | 2.15e-04 | 5.84e-01 | 0.082 |
| 29127 | RACGAP1 | LZE24T | Human | Esophagus | ESCC | 1.69e-06 | 2.29e-01 | 0.0596 |
| 29127 | RACGAP1 | P2T-E | Human | Esophagus | ESCC | 7.39e-09 | 4.54e-01 | 0.1177 |
| 29127 | RACGAP1 | P4T-E | Human | Esophagus | ESCC | 1.35e-11 | 4.52e-01 | 0.1323 |
| 29127 | RACGAP1 | P5T-E | Human | Esophagus | ESCC | 2.29e-04 | 1.64e-01 | 0.1327 |
| 29127 | RACGAP1 | P8T-E | Human | Esophagus | ESCC | 4.83e-03 | 1.32e-01 | 0.0889 |
| 29127 | RACGAP1 | P10T-E | Human | Esophagus | ESCC | 7.95e-06 | 2.45e-01 | 0.116 |
| 29127 | RACGAP1 | P11T-E | Human | Esophagus | ESCC | 2.26e-04 | 2.42e-01 | 0.1426 |
| 29127 | RACGAP1 | P17T-E | Human | Esophagus | ESCC | 4.60e-02 | 5.61e-01 | 0.1278 |
| 29127 | RACGAP1 | P19T-E | Human | Esophagus | ESCC | 6.31e-05 | 5.22e-01 | 0.1662 |
| 29127 | RACGAP1 | P20T-E | Human | Esophagus | ESCC | 2.66e-05 | 2.50e-01 | 0.1124 |
| 29127 | RACGAP1 | P21T-E | Human | Esophagus | ESCC | 8.77e-05 | 2.69e-01 | 0.1617 |
| 29127 | RACGAP1 | P23T-E | Human | Esophagus | ESCC | 8.24e-03 | 2.12e-01 | 0.108 |
| 29127 | RACGAP1 | P24T-E | Human | Esophagus | ESCC | 6.36e-13 | 4.55e-01 | 0.1287 |
| 29127 | RACGAP1 | P26T-E | Human | Esophagus | ESCC | 3.63e-06 | 2.82e-01 | 0.1276 |
| 29127 | RACGAP1 | P28T-E | Human | Esophagus | ESCC | 1.67e-05 | 1.89e-01 | 0.1149 |
| 29127 | RACGAP1 | P30T-E | Human | Esophagus | ESCC | 7.57e-05 | 2.95e-01 | 0.137 |
| 29127 | RACGAP1 | P31T-E | Human | Esophagus | ESCC | 7.98e-05 | 2.22e-01 | 0.1251 |
| 29127 | RACGAP1 | P32T-E | Human | Esophagus | ESCC | 1.44e-08 | 3.68e-01 | 0.1666 |
| 29127 | RACGAP1 | P37T-E | Human | Esophagus | ESCC | 2.72e-05 | 3.02e-01 | 0.1371 |
| Page: 1 2 3 |
| Tissue | Expression Dynamics | Abbreviation |
| Esophagus | 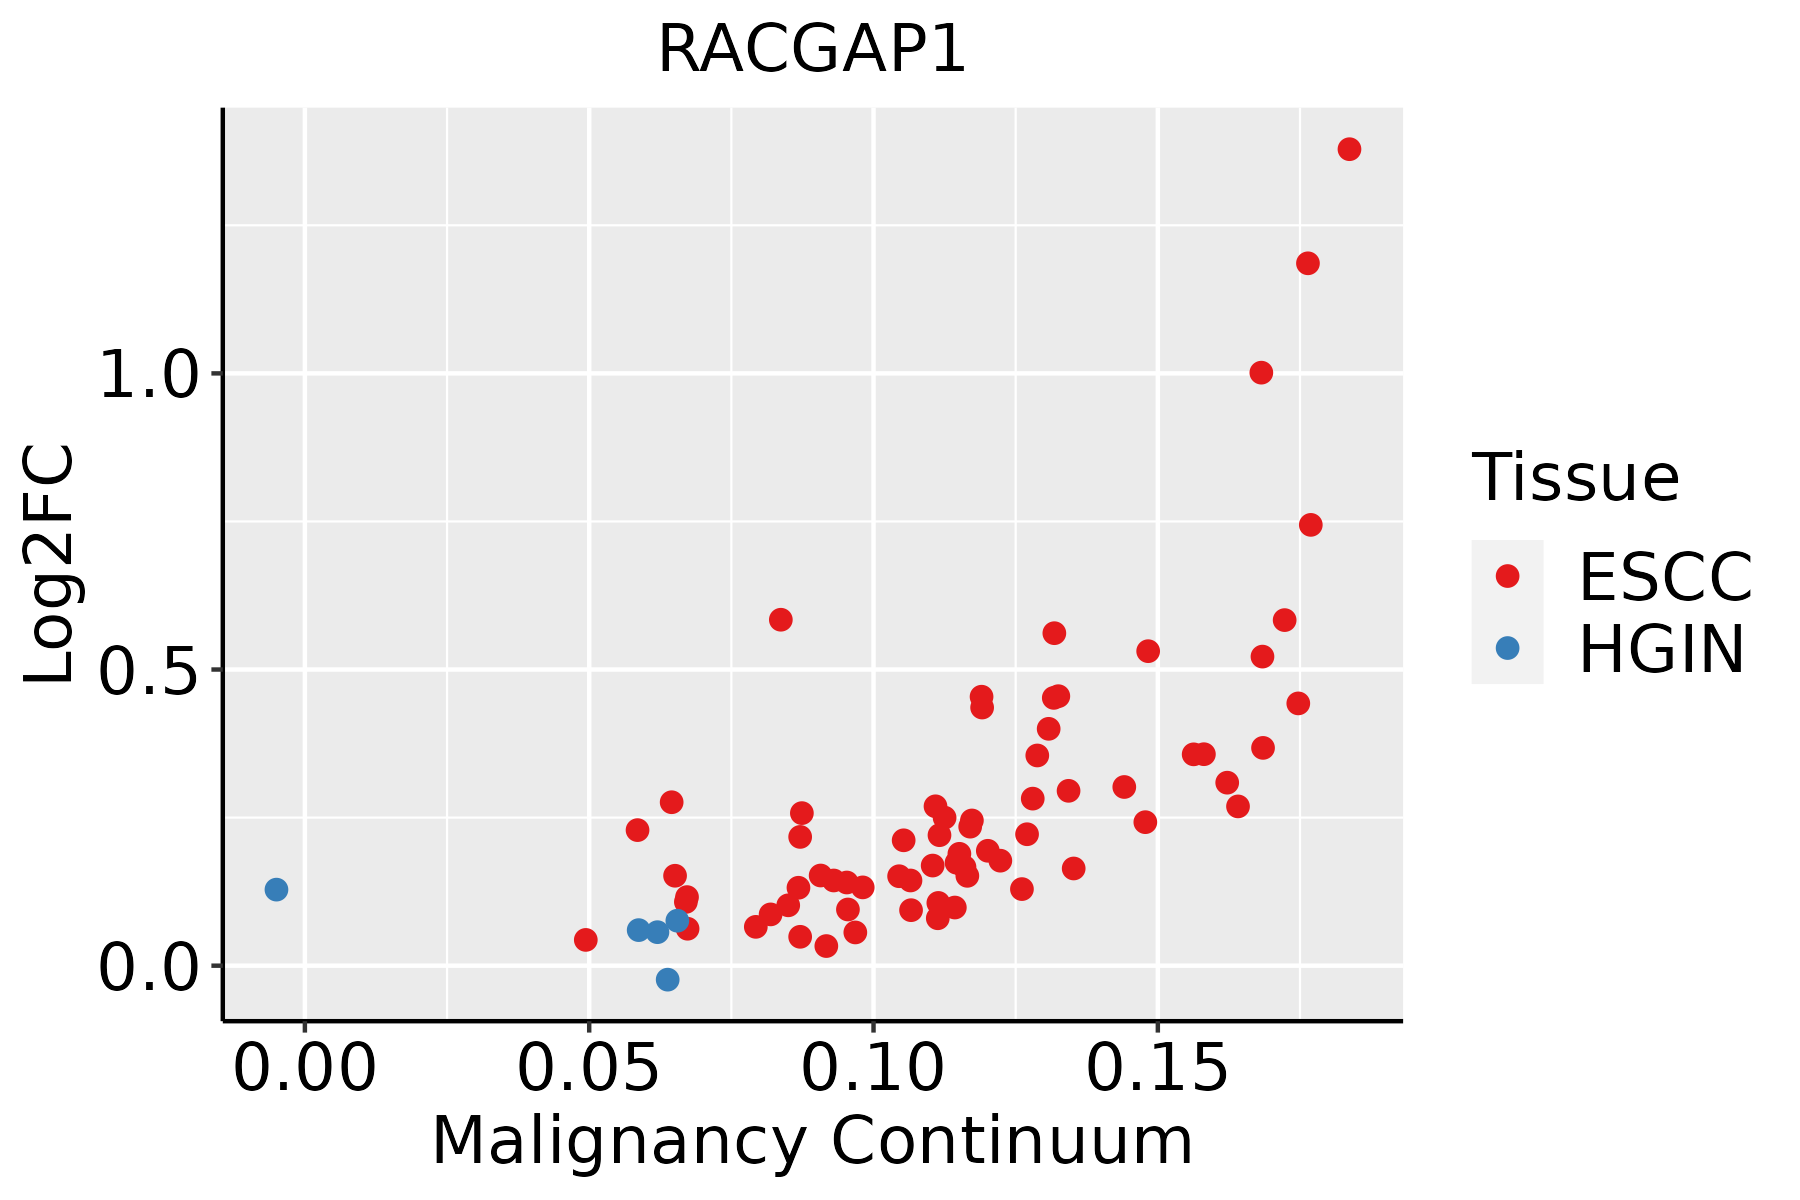 | ESCC: Esophageal squamous cell carcinoma |
| HGIN: High-grade intraepithelial neoplasias | ||
| LGIN: Low-grade intraepithelial neoplasias | ||
| Liver | 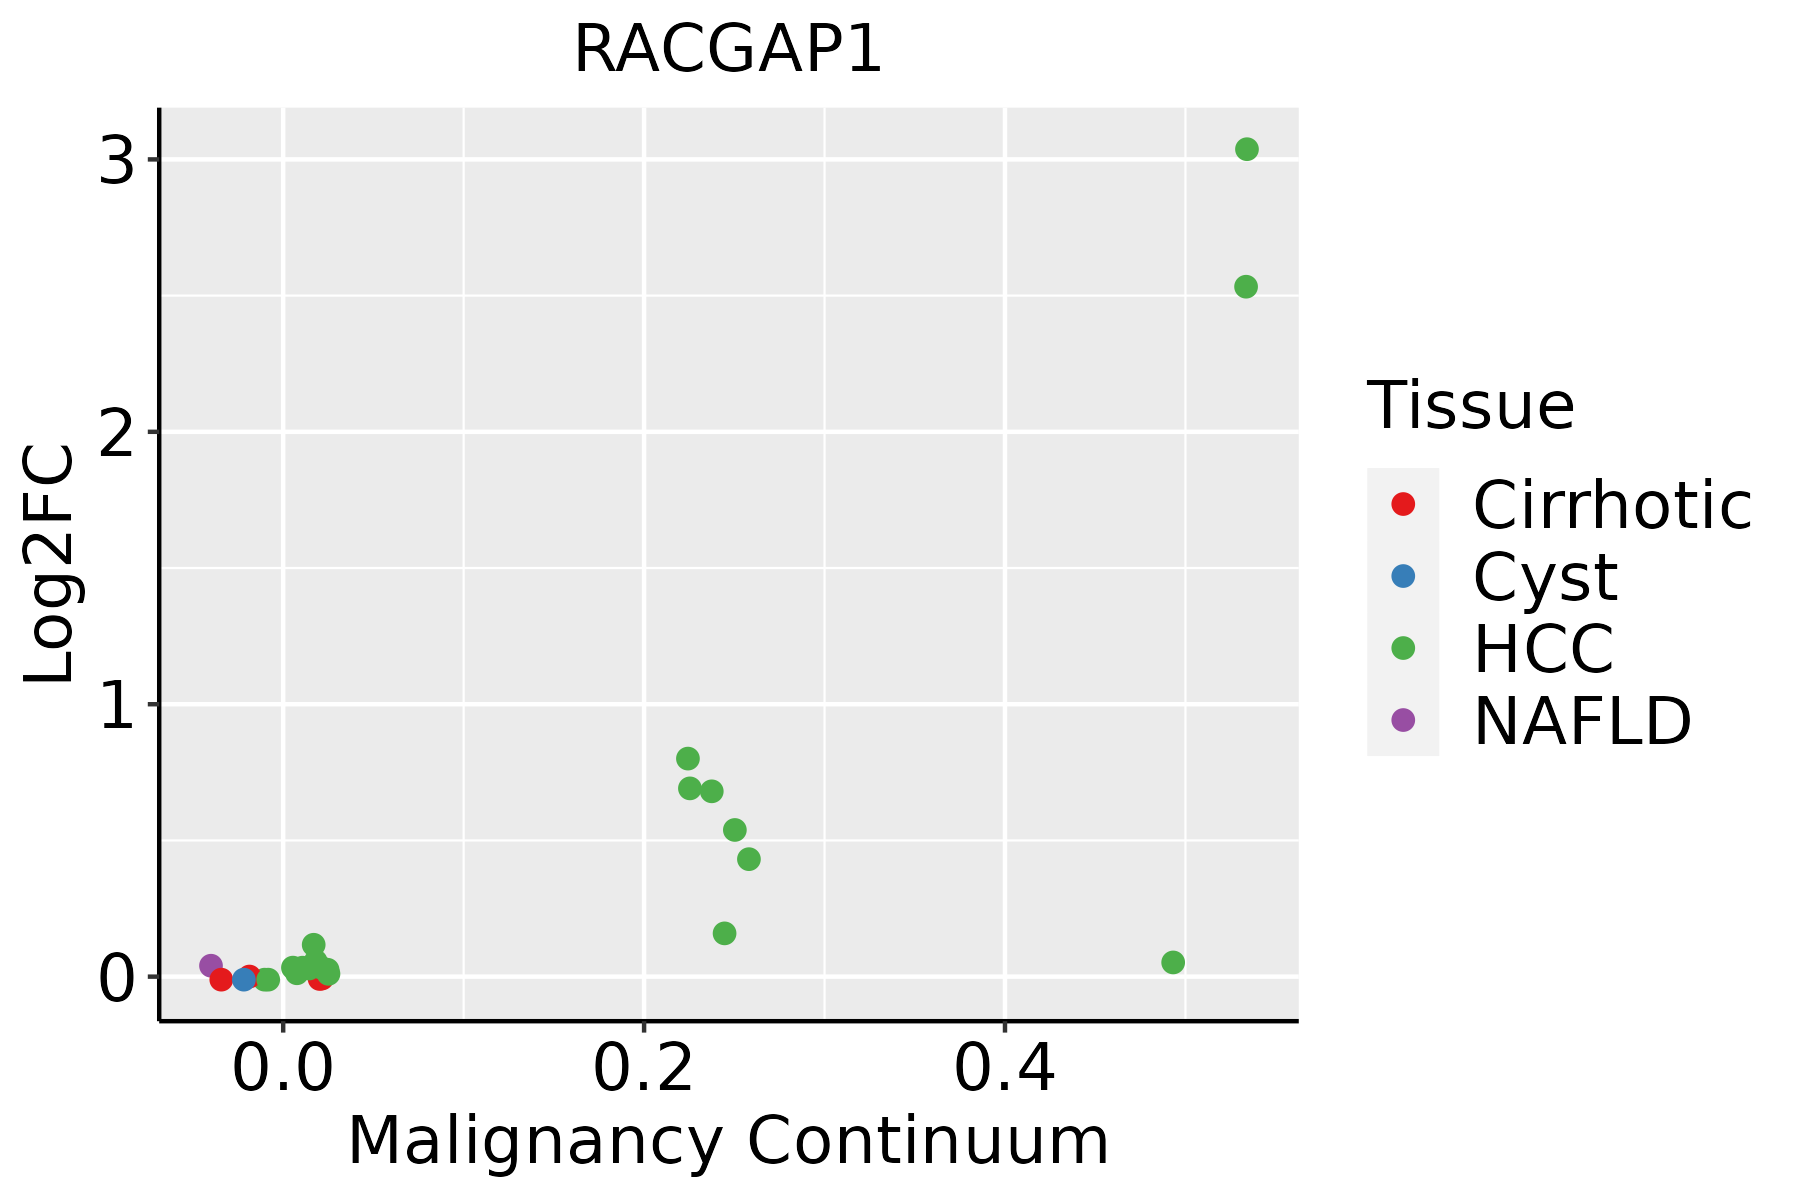 | HCC: Hepatocellular carcinoma |
| NAFLD: Non-alcoholic fatty liver disease | ||
| Oral Cavity |  | EOLP: Erosive Oral lichen planus |
| LP: leukoplakia | ||
| NEOLP: Non-erosive oral lichen planus | ||
| OSCC: Oral squamous cell carcinoma | ||
| Skin |  | AK: Actinic keratosis |
| cSCC: Cutaneous squamous cell carcinoma | ||
| SCCIS:squamous cell carcinoma in situ |
| ∗log2FC in expression of this searched gene in stem-like cells from each diseased tissue sample relative to stem-like cells in normal samples in each tissue plotted against the malignancy continuum. Samples are colored based on if they are from different disease stage. |
Top |
Malignant transformation related pathway analysis |
| Find out the enriched GO biological processes and KEGG pathways involved in transition from healthy to precancer to cancer |
| Tissue | Disease Stage | Enriched GO biological Processes |
| Colorectum | AD |  |
| Colorectum | SER |  |
| Colorectum | MSS |  |
| Colorectum | MSI-H |  |
| Colorectum | FAP |  |
| ∗Top 15 enriched GO BP terms are showed in the bar plot of each disease state in each tissue. Each row represents a significant GO biological process which is colored according to the -log10(p.adjust). |
| Page: 1 2 3 4 5 6 7 8 9 |
| GO ID | Tissue | Disease Stage | Description | Gene Ratio | Bg Ratio | pvalue | p.adjust | Count |
| GO:014001414 | Esophagus | ESCC | mitotic nuclear division | 218/8552 | 287/18723 | 6.17e-26 | 1.78e-23 | 218 |
| GO:000007011 | Esophagus | ESCC | mitotic sister chromatid segregation | 138/8552 | 168/18723 | 1.37e-22 | 2.63e-20 | 138 |
| GO:00008194 | Esophagus | ESCC | sister chromatid segregation | 157/8552 | 202/18723 | 8.41e-21 | 1.33e-18 | 157 |
| GO:000705911 | Esophagus | ESCC | chromosome segregation | 238/8552 | 346/18723 | 1.72e-18 | 1.82e-16 | 238 |
| GO:190285015 | Esophagus | ESCC | microtubule cytoskeleton organization involved in mitosis | 116/8552 | 147/18723 | 1.25e-16 | 9.91e-15 | 116 |
| GO:000705214 | Esophagus | ESCC | mitotic spindle organization | 97/8552 | 120/18723 | 2.17e-15 | 1.33e-13 | 97 |
| GO:000705114 | Esophagus | ESCC | spindle organization | 134/8552 | 184/18723 | 5.70e-14 | 2.87e-12 | 134 |
| GO:00482853 | Esophagus | ESCC | organelle fission | 301/8552 | 488/18723 | 4.64e-13 | 2.12e-11 | 301 |
| GO:00988133 | Esophagus | ESCC | nuclear chromosome segregation | 187/8552 | 281/18723 | 1.00e-12 | 4.36e-11 | 187 |
| GO:00002802 | Esophagus | ESCC | nuclear division | 270/8552 | 439/18723 | 1.17e-11 | 4.24e-10 | 270 |
| GO:000028115 | Esophagus | ESCC | mitotic cytokinesis | 58/8552 | 71/18723 | 4.34e-10 | 1.15e-08 | 58 |
| GO:004578710 | Esophagus | ESCC | positive regulation of cell cycle | 196/8552 | 313/18723 | 9.27e-10 | 2.24e-08 | 196 |
| GO:00512256 | Esophagus | ESCC | spindle assembly | 85/8552 | 117/18723 | 2.72e-09 | 5.98e-08 | 85 |
| GO:003250614 | Esophagus | ESCC | cytokinetic process | 35/8552 | 39/18723 | 9.38e-09 | 1.90e-07 | 35 |
| GO:009030715 | Esophagus | ESCC | mitotic spindle assembly | 52/8552 | 65/18723 | 1.41e-08 | 2.77e-07 | 52 |
| GO:000091016 | Esophagus | ESCC | cytokinesis | 115/8552 | 173/18723 | 2.48e-08 | 4.68e-07 | 115 |
| GO:006164015 | Esophagus | ESCC | cytoskeleton-dependent cytokinesis | 72/8552 | 100/18723 | 8.10e-08 | 1.39e-06 | 72 |
| GO:00900689 | Esophagus | ESCC | positive regulation of cell cycle process | 142/8552 | 236/18723 | 4.79e-06 | 5.08e-05 | 142 |
| GO:00086081 | Esophagus | ESCC | attachment of spindle microtubules to kinetochore | 29/8552 | 35/18723 | 6.61e-06 | 6.75e-05 | 29 |
| GO:003086517 | Esophagus | ESCC | cortical cytoskeleton organization | 44/8552 | 61/18723 | 2.50e-05 | 2.13e-04 | 44 |
| Page: 1 2 3 4 5 6 |
| Pathway ID | Tissue | Disease Stage | Description | Gene Ratio | Bg Ratio | pvalue | p.adjust | qvalue | Count |
| Page: 1 |
Top |
Cell-cell communication analysis |
| Identification of potential cell-cell interactions between two cell types and their ligand-receptor pairs for different disease states |
| Ligand | Receptor | LRpair | Pathway | Tissue | Disease Stage |
| Page: 1 |
Top |
Single-cell gene regulatory network inference analysis |
| Find out the significant the regulons (TFs) and the target genes of each regulon across cell types for different disease states |
| TF | Cell Type | Tissue | Disease Stage | Target Gene | RSS | Regulon Activity |
| ∗The dot plots of a searched regulon are shown for all cell subpopulations in each disease state of each tissue based on the regulon specific score inferred using pySCENIC and by calculating the average expression. |
| Page: 1 |
Top |
Somatic mutation of malignant transformation related genes |
| Annotation of somatic variants for genes involved in malignant transformation |
| Hugo Symbol | Variant Class | Variant Classification | dbSNP RS | HGVSc | HGVSp | HGVSp Short | SWISSPROT | BIOTYPE | SIFT | PolyPhen | Tumor Sample Barcode | Tissue | Histology | Sex | Age | Stage | Therapy Types | Drugs | Outcome |
| RACGAP1 | SNV | Missense_Mutation | novel | c.150N>T | p.Glu50Asp | p.E50D | Q9H0H5 | protein_coding | tolerated(0.12) | benign(0.13) | TCGA-A2-A3Y0-01 | Breast | breast invasive carcinoma | Female | <65 | I/II | Chemotherapy | adriamycin | CR |
| RACGAP1 | SNV | Missense_Mutation | c.1838N>C | p.Ser613Thr | p.S613T | Q9H0H5 | protein_coding | tolerated(0.1) | benign(0.007) | TCGA-AR-A2LE-01 | Breast | breast invasive carcinoma | Female | >=65 | I/II | Hormone Therapy | tamoxiphen | PD | |
| RACGAP1 | SNV | Missense_Mutation | c.1658N>G | p.Leu553Arg | p.L553R | Q9H0H5 | protein_coding | tolerated(0.42) | benign(0.014) | TCGA-D8-A1JK-01 | Breast | breast invasive carcinoma | Female | >=65 | I/II | Unknown | Unknown | SD | |
| RACGAP1 | SNV | Missense_Mutation | c.452N>A | p.Ser151Tyr | p.S151Y | Q9H0H5 | protein_coding | deleterious(0.02) | benign(0.345) | TCGA-EK-A3GK-01 | Cervix | cervical & endocervical cancer | Female | <65 | I/II | Unknown | Unknown | SD | |
| RACGAP1 | SNV | Missense_Mutation | novel | c.1624T>G | p.Phe542Val | p.F542V | Q9H0H5 | protein_coding | tolerated(0.14) | possibly_damaging(0.702) | TCGA-FU-A3HZ-01 | Cervix | cervical & endocervical cancer | Female | <65 | I/II | Chemotherapy | cisplatin | CR |
| RACGAP1 | SNV | Missense_Mutation | novel | c.1585N>C | p.Glu529Gln | p.E529Q | Q9H0H5 | protein_coding | tolerated(0.12) | benign(0.419) | TCGA-JW-A5VJ-01 | Cervix | cervical & endocervical cancer | Female | <65 | I/II | Unknown | Unknown | PD |
| RACGAP1 | SNV | Missense_Mutation | novel | c.194N>A | p.Arg65Gln | p.R65Q | Q9H0H5 | protein_coding | tolerated(0.11) | benign(0.164) | TCGA-AA-A00N-01 | Colorectum | colon adenocarcinoma | Male | >=65 | I/II | Unknown | Unknown | PD |
| RACGAP1 | SNV | Missense_Mutation | c.272N>A | p.Ala91Asp | p.A91D | Q9H0H5 | protein_coding | deleterious(0.01) | possibly_damaging(0.634) | TCGA-AA-A01R-01 | Colorectum | colon adenocarcinoma | Male | <65 | III/IV | Chemotherapy | 5-fluorouracil | PD | |
| RACGAP1 | deletion | Frame_Shift_Del | novel | c.1091_1092delCC | p.Ser364TyrfsTer8 | p.S364Yfs*8 | Q9H0H5 | protein_coding | TCGA-AG-3726-01 | Colorectum | rectum adenocarcinoma | Female | <65 | I/II | Unknown | Unknown | SD | ||
| RACGAP1 | SNV | Missense_Mutation | novel | c.578G>A | p.Gly193Asp | p.G193D | Q9H0H5 | protein_coding | tolerated(0.26) | benign(0.043) | TCGA-A5-A0G2-01 | Endometrium | uterine corpus endometrioid carcinoma | Female | <65 | III/IV | Unknown | Unknown | SD |
| Page: 1 2 3 4 5 6 7 |
Top |
Related drugs of malignant transformation related genes |
| Identification of chemicals and drugs interact with genes involved in malignant transfromation |
| (DGIdb 4.0) |
| Entrez ID | Symbol | Category | Interaction Types | Drug Claim Name | Drug Name | PMIDs |
| 29127 | RACGAP1 | NA | TCMDC-124522 | CHEMBL526776 | ||
| 29127 | RACGAP1 | NA | ISOORIENTIN | ISOORIENTIN | ||
| 29127 | RACGAP1 | NA | THUNBERGINOL B | THUNBERGINOL B | ||
| 29127 | RACGAP1 | NA | GNF-PF-321 | CHEMBL581044 | ||
| 29127 | RACGAP1 | NA | KAEMPFEROL | KAEMPFEROL | ||
| 29127 | RACGAP1 | NA | TCMDC-138263 | CHEMBL535307 | ||
| 29127 | RACGAP1 | NA | 4-(N,NDIMETHYLAMINO)BENZALDOXIME | CHEMBL498513 | ||
| 29127 | RACGAP1 | NA | COUMESTROL | COUMESTROL | ||
| 29127 | RACGAP1 | NA | SULFURETIN | SULFURETIN | ||
| 29127 | RACGAP1 | NA | NSC-60339 | CHEMBL1448793 |
| Page: 1 2 3 4 5 6 7 |

Copyright 2023-Present -The University of Texas Health Science Center at Houston |