
|
|||||
|
 | |
| |
| |
| |
| |
| |
|
Gene: RABL3 |
Gene summary for RABL3 |
| Gene information | Species | Human | Gene symbol | RABL3 | Gene ID | 285282 |
| Gene name | RAB, member of RAS oncogene family like 3 | |
| Gene Alias | PNCA5 | |
| Cytomap | 3q13.33 | |
| Gene Type | protein-coding | GO ID | GO:0001775 | UniProtAcc | Q5HYI8 |
Top |
Malignant transformation analysis |
| Identification of the aberrant gene expression in precancerous and cancerous lesions by comparing the gene expression of stem-like cells in diseased tissues with normal stem cells |
| Entrez ID | Symbol | Replicates | Species | Organ | Tissue | Adj P-value | Log2FC | Malignancy |
| 285282 | RABL3 | LZE2T | Human | Esophagus | ESCC | 1.18e-02 | 3.22e-01 | 0.082 |
| 285282 | RABL3 | LZE4T | Human | Esophagus | ESCC | 4.78e-04 | 2.01e-01 | 0.0811 |
| 285282 | RABL3 | LZE20T | Human | Esophagus | ESCC | 7.96e-03 | 8.97e-02 | 0.0662 |
| 285282 | RABL3 | LZE24T | Human | Esophagus | ESCC | 7.47e-08 | 1.30e-01 | 0.0596 |
| 285282 | RABL3 | P1T-E | Human | Esophagus | ESCC | 1.86e-02 | 2.72e-01 | 0.0875 |
| 285282 | RABL3 | P2T-E | Human | Esophagus | ESCC | 5.83e-11 | 1.43e-01 | 0.1177 |
| 285282 | RABL3 | P4T-E | Human | Esophagus | ESCC | 8.42e-11 | 2.57e-01 | 0.1323 |
| 285282 | RABL3 | P5T-E | Human | Esophagus | ESCC | 1.31e-18 | 3.07e-01 | 0.1327 |
| 285282 | RABL3 | P8T-E | Human | Esophagus | ESCC | 3.47e-17 | 2.26e-01 | 0.0889 |
| 285282 | RABL3 | P9T-E | Human | Esophagus | ESCC | 1.53e-08 | 2.55e-01 | 0.1131 |
| 285282 | RABL3 | P10T-E | Human | Esophagus | ESCC | 1.51e-18 | 2.82e-01 | 0.116 |
| 285282 | RABL3 | P11T-E | Human | Esophagus | ESCC | 4.53e-03 | 2.67e-01 | 0.1426 |
| 285282 | RABL3 | P12T-E | Human | Esophagus | ESCC | 1.65e-14 | 1.88e-01 | 0.1122 |
| 285282 | RABL3 | P15T-E | Human | Esophagus | ESCC | 8.89e-11 | 2.43e-01 | 0.1149 |
| 285282 | RABL3 | P16T-E | Human | Esophagus | ESCC | 2.99e-18 | 2.77e-01 | 0.1153 |
| 285282 | RABL3 | P17T-E | Human | Esophagus | ESCC | 1.43e-06 | 2.28e-01 | 0.1278 |
| 285282 | RABL3 | P20T-E | Human | Esophagus | ESCC | 1.95e-13 | 3.44e-01 | 0.1124 |
| 285282 | RABL3 | P21T-E | Human | Esophagus | ESCC | 3.53e-14 | 1.97e-01 | 0.1617 |
| 285282 | RABL3 | P22T-E | Human | Esophagus | ESCC | 5.06e-14 | 1.49e-01 | 0.1236 |
| 285282 | RABL3 | P23T-E | Human | Esophagus | ESCC | 1.48e-17 | 2.29e-01 | 0.108 |
| Page: 1 2 3 4 |
| Tissue | Expression Dynamics | Abbreviation |
| Esophagus |  | ESCC: Esophageal squamous cell carcinoma |
| HGIN: High-grade intraepithelial neoplasias | ||
| LGIN: Low-grade intraepithelial neoplasias | ||
| Liver | 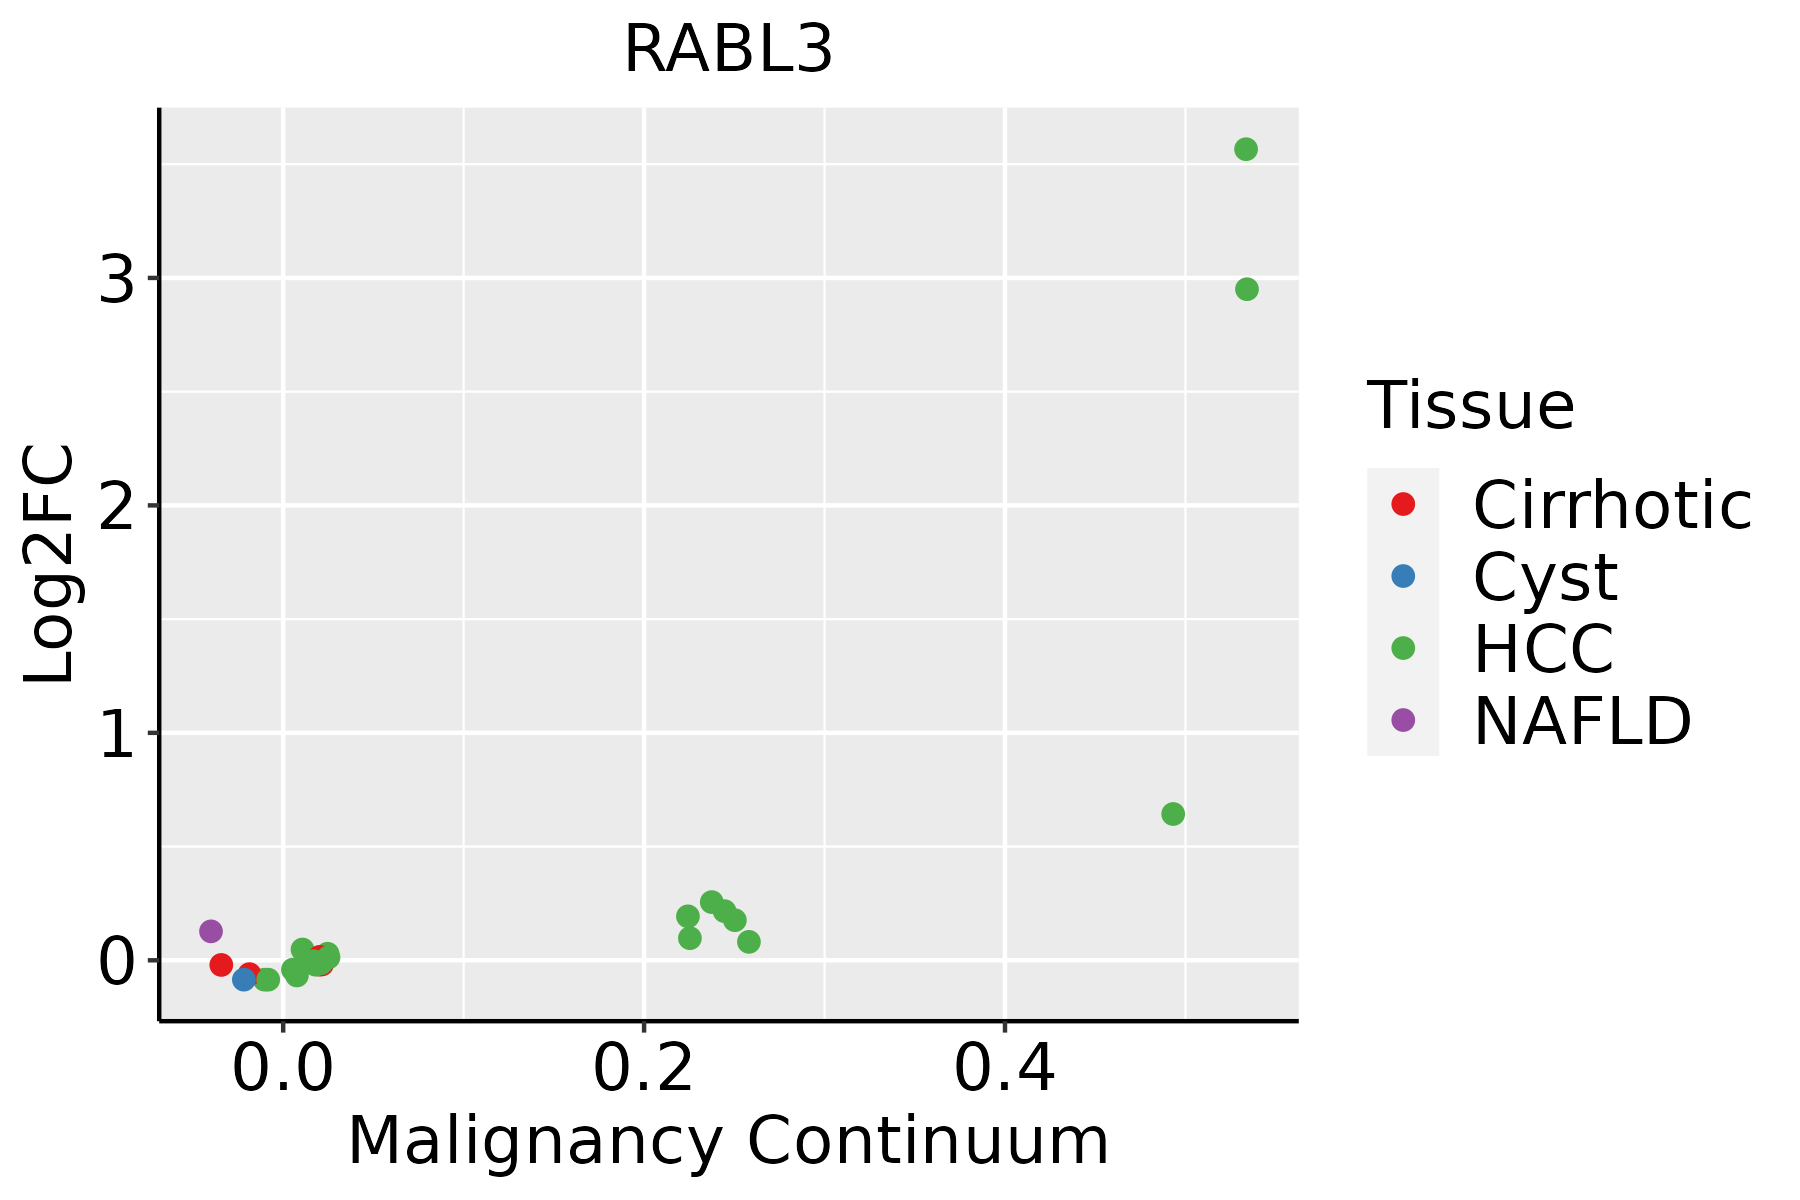 | HCC: Hepatocellular carcinoma |
| NAFLD: Non-alcoholic fatty liver disease | ||
| Oral Cavity |  | EOLP: Erosive Oral lichen planus |
| LP: leukoplakia | ||
| NEOLP: Non-erosive oral lichen planus | ||
| OSCC: Oral squamous cell carcinoma |
| ∗log2FC in expression of this searched gene in stem-like cells from each diseased tissue sample relative to stem-like cells in normal samples in each tissue plotted against the malignancy continuum. Samples are colored based on if they are from different disease stage. |
Top |
Malignant transformation related pathway analysis |
| Find out the enriched GO biological processes and KEGG pathways involved in transition from healthy to precancer to cancer |
| Tissue | Disease Stage | Enriched GO biological Processes |
| Colorectum | AD |  |
| Colorectum | SER |  |
| Colorectum | MSS |  |
| Colorectum | MSI-H |  |
| Colorectum | FAP |  |
| ∗Top 15 enriched GO BP terms are showed in the bar plot of each disease state in each tissue. Each row represents a significant GO biological process which is colored according to the -log10(p.adjust). |
| Page: 1 2 3 4 5 6 7 8 9 |
| GO ID | Tissue | Disease Stage | Description | Gene Ratio | Bg Ratio | pvalue | p.adjust | Count |
| GO:0031647111 | Esophagus | ESCC | regulation of protein stability | 223/8552 | 298/18723 | 5.76e-25 | 1.52e-22 | 223 |
| GO:0050821111 | Esophagus | ESCC | protein stabilization | 140/8552 | 191/18723 | 6.50e-15 | 3.61e-13 | 140 |
| GO:000726510 | Esophagus | ESCC | Ras protein signal transduction | 201/8552 | 337/18723 | 1.44e-07 | 2.30e-06 | 201 |
| GO:00421573 | Esophagus | ESCC | lipoprotein metabolic process | 86/8552 | 135/18723 | 1.78e-05 | 1.57e-04 | 86 |
| GO:00064973 | Esophagus | ESCC | protein lipidation | 62/8552 | 92/18723 | 2.08e-05 | 1.80e-04 | 62 |
| GO:00421583 | Esophagus | ESCC | lipoprotein biosynthetic process | 64/8552 | 96/18723 | 2.61e-05 | 2.20e-04 | 64 |
| GO:004211018 | Esophagus | ESCC | T cell activation | 256/8552 | 487/18723 | 1.18e-03 | 5.87e-03 | 256 |
| GO:19031317 | Esophagus | ESCC | mononuclear cell differentiation | 226/8552 | 426/18723 | 1.20e-03 | 5.88e-03 | 226 |
| GO:00465789 | Esophagus | ESCC | regulation of Ras protein signal transduction | 106/8552 | 189/18723 | 2.49e-03 | 1.08e-02 | 106 |
| GO:00302176 | Esophagus | ESCC | T cell differentiation | 137/8552 | 257/18723 | 8.09e-03 | 2.87e-02 | 137 |
| GO:00300984 | Esophagus | ESCC | lymphocyte differentiation | 192/8552 | 374/18723 | 1.52e-02 | 4.93e-02 | 192 |
| GO:005105610 | Esophagus | ESCC | regulation of small GTPase mediated signal transduction | 157/8552 | 302/18723 | 1.55e-02 | 4.98e-02 | 157 |
| GO:003164722 | Liver | HCC | regulation of protein stability | 211/7958 | 298/18723 | 2.29e-23 | 5.01e-21 | 211 |
| GO:005082122 | Liver | HCC | protein stabilization | 139/7958 | 191/18723 | 1.61e-17 | 1.71e-15 | 139 |
| GO:00421571 | Liver | HCC | lipoprotein metabolic process | 86/7958 | 135/18723 | 5.21e-07 | 8.38e-06 | 86 |
| GO:000726521 | Liver | HCC | Ras protein signal transduction | 187/7958 | 337/18723 | 8.89e-07 | 1.35e-05 | 187 |
| GO:00421581 | Liver | HCC | lipoprotein biosynthetic process | 58/7958 | 96/18723 | 2.99e-04 | 2.13e-03 | 58 |
| GO:00064971 | Liver | HCC | protein lipidation | 55/7958 | 92/18723 | 6.12e-04 | 3.82e-03 | 55 |
| GO:004657811 | Liver | HCC | regulation of Ras protein signal transduction | 100/7958 | 189/18723 | 2.42e-03 | 1.18e-02 | 100 |
| GO:003164720 | Oral cavity | OSCC | regulation of protein stability | 193/7305 | 298/18723 | 1.30e-19 | 1.95e-17 | 193 |
| Page: 1 2 |
| Pathway ID | Tissue | Disease Stage | Description | Gene Ratio | Bg Ratio | pvalue | p.adjust | qvalue | Count |
| Page: 1 |
Top |
Cell-cell communication analysis |
| Identification of potential cell-cell interactions between two cell types and their ligand-receptor pairs for different disease states |
| Ligand | Receptor | LRpair | Pathway | Tissue | Disease Stage |
| Page: 1 |
Top |
Single-cell gene regulatory network inference analysis |
| Find out the significant the regulons (TFs) and the target genes of each regulon across cell types for different disease states |
| TF | Cell Type | Tissue | Disease Stage | Target Gene | RSS | Regulon Activity |
| ∗The dot plots of a searched regulon are shown for all cell subpopulations in each disease state of each tissue based on the regulon specific score inferred using pySCENIC and by calculating the average expression. |
| Page: 1 |
Top |
Somatic mutation of malignant transformation related genes |
| Annotation of somatic variants for genes involved in malignant transformation |
| Hugo Symbol | Variant Class | Variant Classification | dbSNP RS | HGVSc | HGVSp | HGVSp Short | SWISSPROT | BIOTYPE | SIFT | PolyPhen | Tumor Sample Barcode | Tissue | Histology | Sex | Age | Stage | Therapy Types | Drugs | Outcome |
| RABL3 | SNV | Missense_Mutation | rs143780029 | c.469C>T | p.Arg157Cys | p.R157C | Q5HYI8 | protein_coding | deleterious(0.04) | possibly_damaging(0.828) | TCGA-2W-A8YY-01 | Cervix | cervical & endocervical cancer | Female | <65 | I/II | Chemotherapy | cisplatin | CR |
| RABL3 | SNV | Missense_Mutation | rs201184813 | c.470N>A | p.Arg157His | p.R157H | Q5HYI8 | protein_coding | deleterious(0.03) | benign(0.013) | TCGA-EA-A410-01 | Cervix | cervical & endocervical cancer | Female | <65 | I/II | Unknown | Unknown | SD |
| RABL3 | SNV | Missense_Mutation | novel | c.44N>T | p.Ser15Leu | p.S15L | Q5HYI8 | protein_coding | deleterious(0.02) | benign(0.089) | TCGA-EK-A2RJ-01 | Cervix | cervical & endocervical cancer | Female | <65 | I/II | Unknown | Unknown | SD |
| RABL3 | SNV | Missense_Mutation | rs59155676 | c.229N>A | p.Val77Met | p.V77M | Q5HYI8 | protein_coding | tolerated(0.19) | possibly_damaging(0.58) | TCGA-AA-A02R-01 | Colorectum | colon adenocarcinoma | Female | >=65 | I/II | Unknown | Unknown | PD |
| RABL3 | SNV | Missense_Mutation | rs750247151 | c.322C>T | p.Arg108Cys | p.R108C | Q5HYI8 | protein_coding | deleterious(0.05) | probably_damaging(0.998) | TCGA-AG-3892-01 | Colorectum | rectum adenocarcinoma | Female | <65 | I/II | Unknown | Unknown | SD |
| RABL3 | SNV | Missense_Mutation | c.385N>C | p.Asp129His | p.D129H | Q5HYI8 | protein_coding | tolerated(0.08) | probably_damaging(0.951) | TCGA-DY-A1DF-01 | Colorectum | rectum adenocarcinoma | Female | >=65 | III/IV | Unknown | Unknown | SD | |
| RABL3 | SNV | Missense_Mutation | c.650N>T | p.Pro217Leu | p.P217L | Q5HYI8 | protein_coding | tolerated(0.61) | benign(0.001) | TCGA-F5-6812-01 | Colorectum | rectum adenocarcinoma | Male | >=65 | I/II | Unknown | Unknown | SD | |
| RABL3 | SNV | Missense_Mutation | rs767583034 | c.526N>G | p.Ile176Val | p.I176V | Q5HYI8 | protein_coding | tolerated(0.06) | benign(0.122) | TCGA-AX-A06D-01 | Endometrium | uterine corpus endometrioid carcinoma | Female | >=65 | III/IV | Chemotherapy | carboplatin | PD |
| RABL3 | SNV | Missense_Mutation | novel | c.671G>T | p.Arg224Ile | p.R224I | Q5HYI8 | protein_coding | deleterious(0) | probably_damaging(0.986) | TCGA-AX-A06F-01 | Endometrium | uterine corpus endometrioid carcinoma | Female | <65 | III/IV | Chemotherapy | carboplatin | SD |
| RABL3 | SNV | Missense_Mutation | novel | c.488G>T | p.Arg163Met | p.R163M | Q5HYI8 | protein_coding | deleterious(0.04) | probably_damaging(0.959) | TCGA-AX-A2HC-01 | Endometrium | uterine corpus endometrioid carcinoma | Female | <65 | III/IV | Chemotherapy | paclitaxel | PD |
| Page: 1 2 3 |
Top |
Related drugs of malignant transformation related genes |
| Identification of chemicals and drugs interact with genes involved in malignant transfromation |
| (DGIdb 4.0) |
| Entrez ID | Symbol | Category | Interaction Types | Drug Claim Name | Drug Name | PMIDs |
| Page: 1 |

Copyright 2023-Present -The University of Texas Health Science Center at Houston |